Topic 1Amorphous solubility as common reference1 of 3
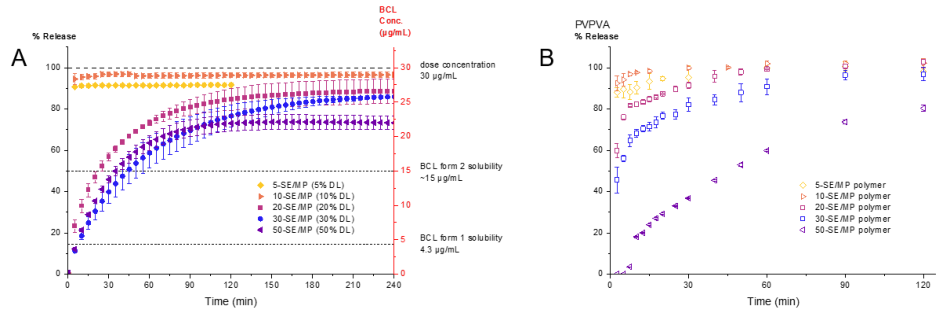
In every category free drug and membrane flux stop at the amorphous solubility, and formulations are judged by reaching it.
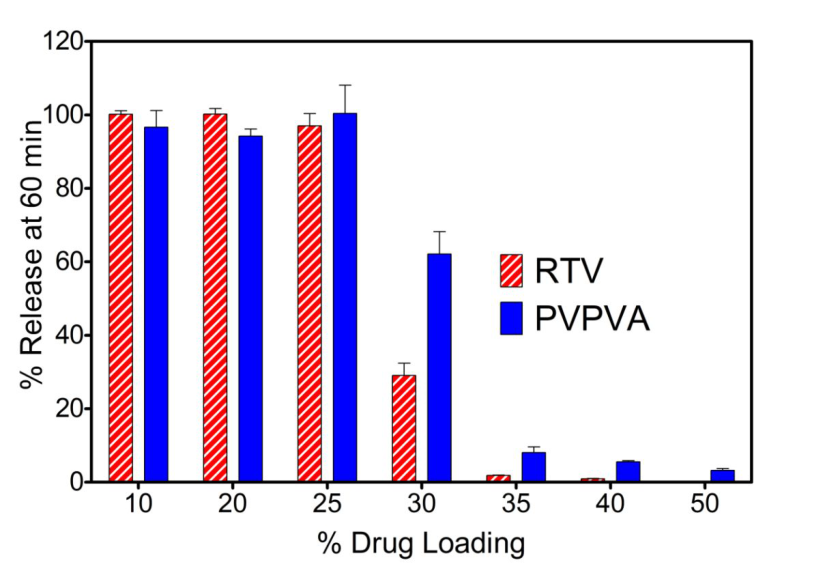
Free drug from dissolving dispersions and six marketed tacrolimus capsules levelled off at about the amorphous solubility (tacrolimus ≈46–50 µg/mL), and membrane flux plateaued from about the same concentration trasi2016 R10, R4, R15, R14; raina2014a R11, R12, R14. In rats the enzalutamide dispersions that reached it beat crystalline drug, while the one that crystallized did not wilson2018 R18, R6, C47. Ritonavir from SBA-15 silica stayed below it even at ten times the dose dening2018 R22, C32, R35.
strongStrong for the cap on free drug and on flux, shown with particle-blind read-outs for several drugs in two categories; moderate for the link to exposure (one drug in rats, three to six animals per arm) and for silica (one silica) raina2014a R11, R12, R14; wilson2018 R18, R6, C47; hate2020a K7, X19; dening2018 C43.
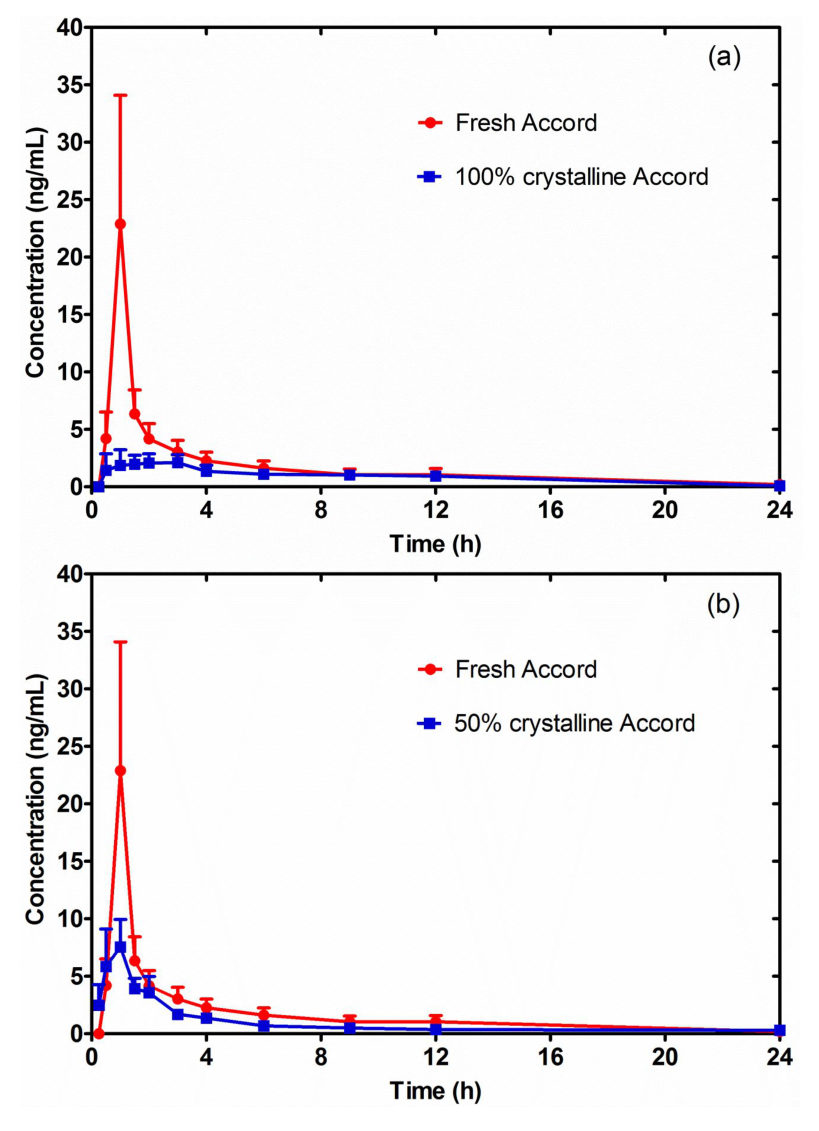
Dispersions that reached the amorphous solubility gave several times the exposure of crystals; the one that crystallized gave less. wilson2018 R16, R17
Marketed dispersions sit at the amorphous solubility (Sa); silica approaches it but stays below even at a tenfold dose. trasi2016 R10, R4, R15, R14; dening2018 R23, R22, M1, R8
For your drug
- Measure the amorphous solubility of the drug in the intended medium by an onset method and confirm it by flux or ultracentrifuged supernatant.
- Ask of each candidate formulation whether it reaches that value; a silica formulation that stays below it or a dispersion that crystallizes before it will not give the flux of the amorphous drug.
raina2015a R11, X9; dening2018 R22, C32, R35; wilson2018 R18, R6, C47
How it works and key numbers
- Beyond the amorphous solubility the excess drug forms a submicron, non-crystalline colloid, for ritonavir ≈350 nm droplets at 20 µg/mL and none at 10 µg/mL ilevbare2013d R1, R2.
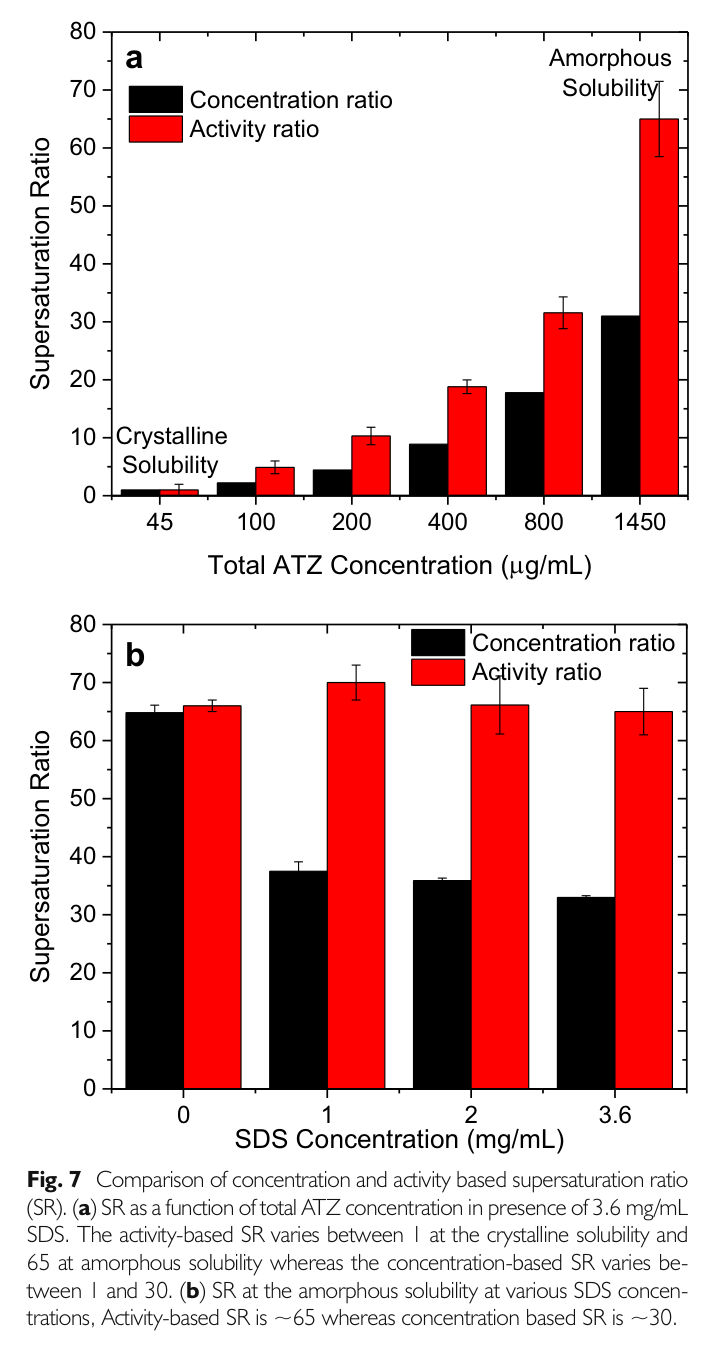
- Once this second phase is present the thermodynamic activity of the drug is constant, so the flux across a membrane plateaus raina2014a R11, R12, R14.
- On silica the adsorption of drug rises steeply as the solution approaches the amorphous solubility, so release "approaches but does not exceed" it and no drug-rich phase forms dening2019 R2, R1; dening2018 C32, C33, C64.
- (synthesis: one thermodynamic quantity, measured in one category, sets the free drug, the flux and the benchmark of the other carriers.)
Evidence: data, conditions and papers
Finding F1. The amorphous solubility is the reference of every category: free drug from dispersions and marketed products levels off there, membrane flux plateaus there, dispersions that reached it raised exposure in rats, and mesoporous silica stays below it
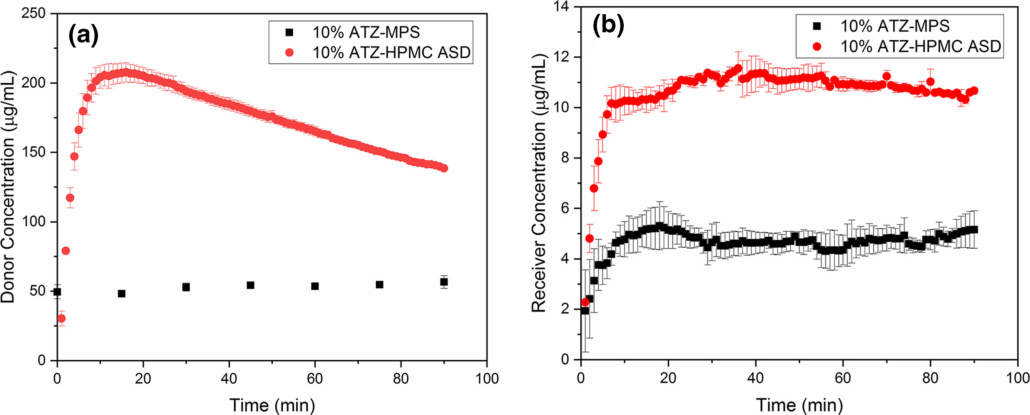
In short. Whether supersaturation came from a solvent shift, a pH shift or a dissolving dispersion, the free drug levelled off at the amorphous solubility, and flux, NMR and ultracentrifugation put the free drug from six marketed tacrolimus capsules at about the same value (≈46–50 µg/mL) alonzo2011 R14, M1; jackson2015 R9, R2, M1; trasi2015b R13, M1, M2; trasi2016 R10, R4, R15, R14 (Dissolution F1). Across a membrane the flux rose with donor concentration up to about the concentration of the second phase and then stayed at a plateau, for felodipine at 25 °C 63–71 × 10⁻³ µg/min from 5 up to 100 µg/mL raina2014a R11, R12, R14 (Bioperformance F2). In rats the three enzalutamide dispersions that reached the amorphous solubility beat the crystalline control (p < 0.05), and the one that crystallized gave less than the crystals wilson2018 R18, R6, C47 (Bioperformance F23). Ritonavir from SBA-15 silica dosed at up to ten times its amorphous solubility plateaued at about 24 µg/mL, about 85% of it, with no drug-rich phase, and an atazanavir–silica formulation gave about 4.3–5.2 µg/mL in the receiver against about 10.2–11.6 µg/mL for an HPMC dispersion dening2018 R22, C32, R35; hate2020a R24, R25, C37 (Mesoporous silica F15).
Type. cross-category synthesis of 11 source findings (solvent-shift and pH-shift solutions, dispersions, marketed capsules, diffusion, flow-through, hollow-fibre and PAMPA cells, rats, silica formulations; about 25 drugs) Strength. for the cap on free drug and on flux, shown with particle-blind read-outs for several drugs in two categories (Dissolution F1, Bioperformance F2); moderate for the link to exposure, one drug in rats with three to six animals per arm (Bioperformance F23); moderate for silica, one silica and a direct comparison at one loading and one dose hate2020a K7, X19; dening2018 C43 (Mesoporous silica F15).
How it was shown
Dissolution compared the onset of a drug-rich phase with the calculated amorphous solubility and read the free drug of dissolving dispersions and six marketed tacrolimus capsules by flux, NMR and ultracentrifugation ilevbare2013a R8; almeidaesousa2015 R5, R11; mosqueragiraldo2015 R13. Bioperformance measured flux against donor concentration and dosed four enzalutamide dispersions and crystalline drug to rats raina2014a R11, R12, R14; indulkar2016 R9; wilson2018 R16, R17. Mesoporous silica dosed ritonavir–SBA-15 up to ten times the amorphous solubility and set atazanavir–SBA-15 against a 10% HPMC dispersion in a hollow-fibre module dening2018 R23, R22, M1, R8; hate2020a R24, R25, C37.
What the data show
In rats AUC0–48 was about 770 µg·h/mL for the 10% enzalutamide–copovidone dispersion and about 575 for the two 50% dispersions, against about 61 for the 10% HPMCAS dispersion, which crystallized, and about 91 for crystalline drug wilson2018 R16, R17. From SBA-15 the free ritonavir rose only from about 10 to about 24 µg/mL as the dose rose from 50 to 1000% of the amorphous solubility (27.9 µg/mL) dening2018 R23, R22, M1, R8.
| system | read-out | result | ids |
|---|---|---|---|
| about 20 drugs, solvent and pH shift | onset against calculated amorphous solubility | 0.91–1.15 times for 17 of 24 rows | ilevbare2013a R8; almeidaesousa2015 R5, R11; mosqueragiraldo2015 R13 |
| six marketed tacrolimus capsules | flux, NMR, ultracentrifugation | free drug at about the amorphous solubility (≈46–50 µg/mL) | trasi2016 R10, R4, R15, R14 |
| felodipine, nifedipine; clotrimazole; telaprevir dispersion | side-by-side and flow-through cells | flux plateau from about the onset of the second phase | raina2014a R11, R12, R14; indulkar2016 R9; mosqueragiraldo2018b R1, R2 |
| four enzalutamide dispersions and crystalline drug | rats, 10 mL/kg gavage | dispersions that reached the ceiling beat crystals (p < 0.05); the crystallizing one did not | wilson2018 R18, R6, C47 |
| atazanavir–SBA-15 against 10% HPMC dispersion | hollow fibre, 200 µg/mL dose | receiver about 4.3–5.2 against 10.2–11.6 µg/mL | hate2020a R24, R25, C37 |
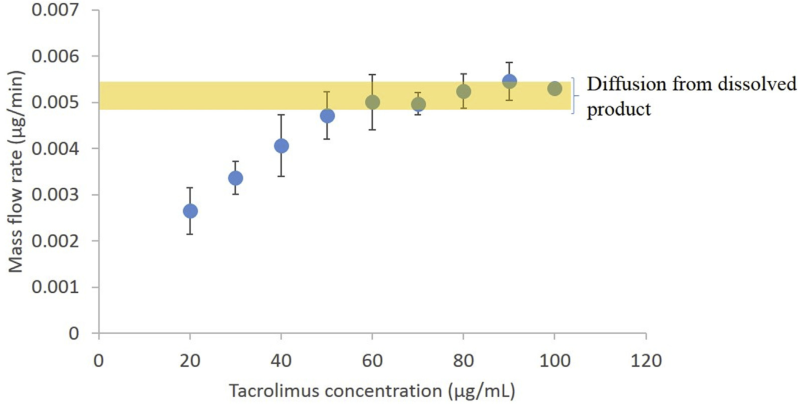
The mass flow rises with concentration and then flattens, and the six marketed products fall in the band on the plateau trasi2016 R15, R14.
Why
The Bioperformance authors read the flux plateau as constant thermodynamic activity once a second phase is present raina2014a R11, R12, R14; the excess drug forms a submicron, non-crystalline colloid ilevbare2013d R1, R2. For silica the authors conclude that release "approaches but does not exceed" the amorphous solubility dening2018 C32, C33, C64, because adsorption onto the silica rises steeply as the solution approaches it dening2019 R2, R1. (synthesis: one thermodynamic quantity sets the free drug, the flux and the benchmark of the other carriers.)
Limits and transfer
In a PAMPA cell with a sink receiver the mass flow kept rising from about 5.0 to 8.8 µg/min between 80 and 1000 µg/mL hate2022 R19. Measure the amorphous solubility of the new drug in the intended medium by an onset method and confirm it by flux or ultracentrifuged supernatant raina2015a R11, X9; a silica formulation that stays below it or a dispersion that crystallizes before it will not give the flux of the amorphous drug dening2018 R22, C32, R35; wilson2018 R18, R6, C47.
How it was shown
Dissolution measured the onset of a drug-rich phase in solvent-shift and pH-shift solutions by extinction, fluorescence and NMR and compared it with the amorphous solubility calculated from crystalline solubility, the free-energy difference and water uptake; it then dissolved amorphous films, salts, dispersions and six marketed tacrolimus capsules and read the free drug by flux, NMR and ultracentrifugation ilevbare2013a R8; almeidaesousa2015 R5, R11; mosqueragiraldo2015 R13 (Dissolution F1). Characterization methods compared the extinction, probe and thermodynamic onsets for six dihydropyridines raina2015a R11, X9 (Characterization methods F5). Bioperformance measured flux against donor concentration in a side-by-side diffusion cell, a flow-through cell and a PAMPA cell raina2014a R11, R12, R14; indulkar2016 R9; hate2022 R1 (Bioperformance F2) and dosed four enzalutamide dispersions and crystalline drug to rats by gavage wilson2018 R16, R17 (Bioperformance F23). Mesoporous silica dosed ritonavir–SBA-15 from half to ten times the amorphous solubility, read dissolution and cellulose-membrane mass flow, and set an atazanavir–SBA-15 formulation against a 10% HPMC dispersion in a hollow-fibre module dening2018 R23, R22, M1, R8 (Mesoporous silica F8); hate2020a R24, R25, C37 (Mesoporous silica F15).
What the data show
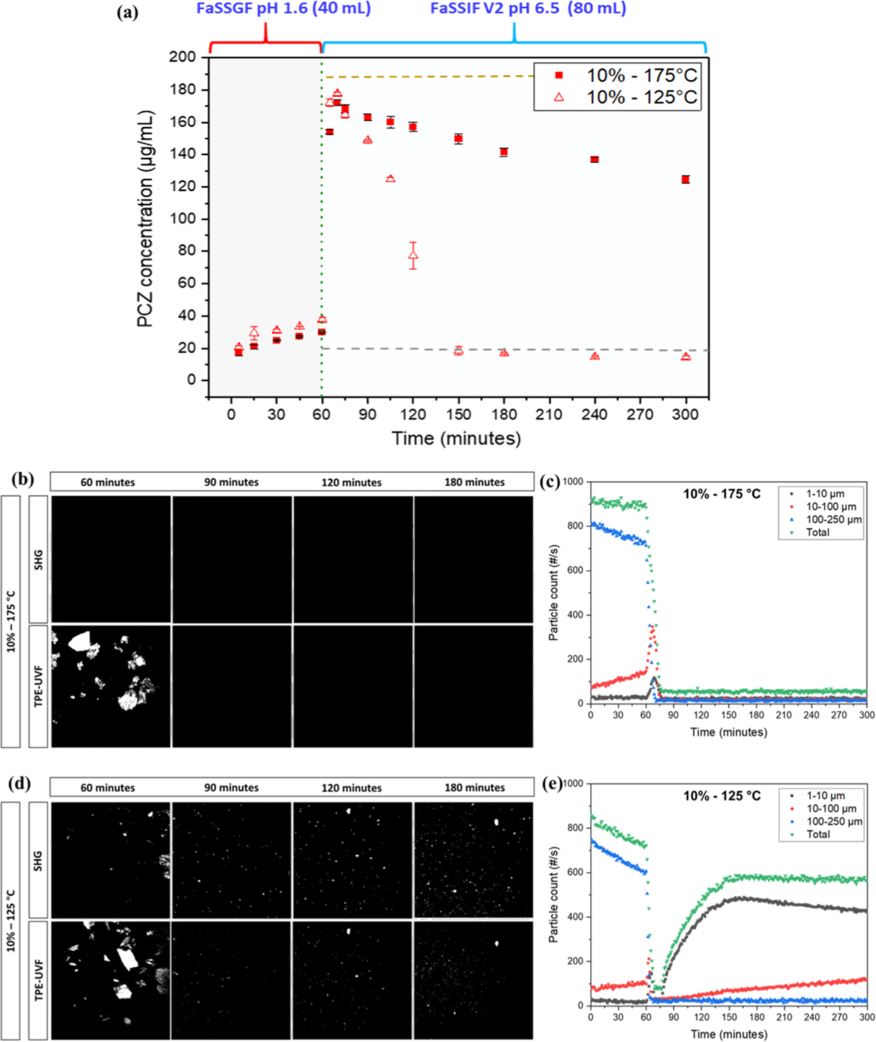
The onset of the drug-rich phase lay at 0.91–1.15 times the calculated amorphous solubility for 17 of 24 rows ilevbare2013a R8; almeidaesousa2015 R5, R11; mosqueragiraldo2015 R13 (Dissolution F1), and the extinction, probe and thermodynamic onsets of five of six dihydropyridines lay within a factor of 1.0–1.7 raina2015a R11, X9 (Characterization methods F5). Beyond it the dissolved drug and the membrane flux of telaprevir, ritonavir, lopinavir and paclitaxel stopped rising mosqueragiraldo2015 R10, R12; trasi2015a R2, R1 (Dissolution F1). The same plateau appeared for felodipine at 37 °C (136–149 × 10⁻³ µg/min from 25 µg/mL), nifedipine (about 1.7–1.9 µg/min from about 72 µg/mL), clotrimazole in a flow-through cell and telaprevir released from a dispersion raina2014a R11, R12, R14; indulkar2016 R9; mosqueragiraldo2018b R1, R2 (Bioperformance F2). In rats AUC0–48 was about 770 µg·h/mL for the 10% enzalutamide–copovidone dispersion, about 575 for the 50% copovidone and 50% HPMCAS dispersions, about 61 for the 10% HPMCAS dispersion, which crystallized, and about 91 for crystalline drug wilson2018 R16, R17 (Bioperformance F23). From SBA-15 the free ritonavir rose only from about 10 to about 24 µg/mL as the dose rose from 50 to 1000% of the amorphous solubility (27.9 µg/mL), and membrane mass flow reached that of amorphous ritonavir only at the tenfold dose dening2018 R23, R22, M1, R8 (Mesoporous silica F8). At the end of the chain, a posaconazole dispersion at 50% loading fell to about the LLPS concentration within about 30 min after a pH shift shah2024 R18, C32 (ASD process F41).
| source finding | system | conditions | result | ids |
|---|---|---|---|---|
| Dissolution F1 | about 20 drugs, solvent and pH shift | onset against calculated amorphous solubility | 0.91–1.15 times for 17 of 24 rows | ilevbare2013a R8; almeidaesousa2015 R5, R11; mosqueragiraldo2015 R13 |
| Dissolution F1 | six marketed tacrolimus capsules; felodipine, danazol, ritonavir, lopinavir dispersions | flux, NMR, ultracentrifugation | free drug at about the amorphous solubility (tacrolimus ≈46–50 µg/mL) | alonzo2011 R14, M1; jackson2015 R9, R2, M1; trasi2015b R13, M1, M2; trasi2016 R10, R4, R15, R14 |
| Characterization methods F5 | six dihydropyridines | extinction, probe, thermodynamic onset | within a factor of 1.0–1.7 for five of six | raina2015a R11, X9 |
| Bioperformance F2 | felodipine, nifedipine; clotrimazole; telaprevir dispersion | side-by-side and flow-through cells | flux plateau from about the onset of the second phase | raina2014a R11, R12, R14; indulkar2016 R9; mosqueragiraldo2018b R1, R2 |
| Bioperformance F23 | four enzalutamide dispersions and crystalline drug | rats, 10 mL/kg gavage | dispersions that reached the ceiling beat crystals (p < 0.05); the crystallizing one did not | wilson2018 R18, R6, C47 |
| Mesoporous silica F8 | ritonavir–SBA-15 | 50–1000% of the amorphous solubility | free drug about 10 to 24 µg/mL against 27.9; flux of amorphous drug only at tenfold dose | dening2018 R23, R22, M1, R8 |
| Mesoporous silica F15 | atazanavir–SBA-15 against 10% HPMC dispersion | hollow fibre, 200 µg/mL dose | donor about 48–57 against 207 µg/mL; receiver about 4.3–5.2 against 10.2–11.6 µg/mL | hate2020a R24, R25, C37 |
| ASD process F41 | posaconazole–HPMCAS, 50% loading | gastric-to-intestinal pH shift | peak and fall to about the LLPS concentration within about 30 min | shah2024 R18, C32 |
Figure
Why
The Bioperformance authors read the flux plateau as constant thermodynamic activity once a second phase is present raina2014a R11, R12, R14 (Bioperformance F2). Beyond the amorphous solubility the excess drug forms a submicron, non-crystalline colloid, for ritonavir ≈350 nm droplets at 20 µg/mL and none at 10 µg/mL ilevbare2013d R1, R2 (Dissolution F1). For silica the authors conclude that release "approaches but does not exceed" the amorphous solubility and that no drug-rich phase forms dening2018 C32, C33, C64 (Mesoporous silica F8), because adsorption of drug onto the silica rises steeply as the solution approaches the amorphous solubility dening2019 R2, R1 (Mesoporous silica F3). (synthesis: one thermodynamic quantity, measured in one category, sets the free drug, the flux and the benchmark of the other carriers; a formulation is judged in every category by whether and for how long it reaches that value.)
Conditions and limits
The cap was measured in buffers and simulated media, with membranes of cellulose, lipid-impregnated PVDF or Caco-2 cells, and the animal result is one drug in rats (Bioperformance F2, Bioperformance F23). The calculated value cannot be recomputed for four of the 2013 predictions, and the best-fitting route changes with the compound (Dissolution F1). (synthesis: the silica results hold for one silica, SBA-15 with 7.1 nm pores loaded from solvent, the only one the Mesoporous silica chapter tested.)
Counterexamples and conflicts
The estimate from melting data failed in FaSSIF (214.6 measured against 308.0 estimated) raina2015c R1; raina2014a X3 (Bioperformance F1). In a hollow-fibre module the transfer of atazanavir did not plateau above the amorphous solubility but rose at a lower slope (AUC slope 5.51 below, 1.29 above) hate2018 R9, E3, E4 (Bioperformance F15), and in a PAMPA cell with a sink receiver the mass flow kept rising from about 5.0 to 8.8 µg/min between 80 and 1000 µg/mL hate2022 R19 (Bioperformance F22). (synthesis: the plateau holds where the receiver does not remove drug faster than the droplets resupply the donor; with a strong sink the droplets add transfer.)
Transfer check
Measure the amorphous solubility of the new drug in the intended medium by an onset method and confirm it by a particle-blind read-out such as flux or ultracentrifuged supernatant raina2015a R11, X9 (Characterization methods F5). Then ask of each candidate formulation whether it reaches that value: a silica formulation that stays below it dening2018 R22, C32, R35 (Mesoporous silica F15) or a dispersion that crystallizes before it wilson2018 R18, R6, C47 (Bioperformance F23) will not give the flux of the amorphous drug.
History
2011–2013: dispersions of felodipine were read by flux, and the onset of a drug-rich phase was set against the calculated amorphous solubility alonzo2011 R14, M1; ilevbare2013a R8 (Dissolution F1). 2014: Raina and co-workers showed the flux plateau at that concentration raina2014a R11, R12, R14 (Bioperformance F2). 2015–2016: the plateau was extended to further drugs and the six marketed tacrolimus capsules were placed on it mosqueragiraldo2015 R10, R12; trasi2016 R10, R4, R15, R14 (Dissolution F1). 2018: the first rat study tied reaching the ceiling to exposure wilson2018 R18, R6, C47 (Bioperformance F23), and silica was measured against it dening2018 R22, C32, R35 (Mesoporous silica F15). 2020–2022: silica was set against a polymer dispersion of the same drug, and PAMPA with a sink receiver showed transfer above the ceiling hate2020a R24, R25, C37 (Mesoporous silica F15); hate2022 R19 (Bioperformance F22). 2024: the LLPS concentration served as the working amorphous solubility of a pH-shift test of extrudates shah2024 R18, C32 (ASD process F41).