Category

Dissolution

What happens to an amorphous drug, or an amorphous solid dispersion (ASD), in an aqueous medium, from the solid to the supersaturated solution and back to crystals.

What this page covers

The category covers the ceiling of the supersaturated solution, the amorphous solubility above which a drug-rich phase separates, its measurement, calculation and the components that move it (pH, salt, temperature, a second drug, surfactants, bile salts, dissolved polymers); crystallization from the supersaturated solution, nucleation and growth measured separately, and what polymers, surfactants, bile salts, lecithin and intestinal fluids do to them; what a dissolving dispersion reaches and how long it holds it, the colloid it forms, seeds and residual crystals, crystallization of the wetted solid, gastric stages and biorelevant media; and how a dispersion releases its drug, congruently with the polymer or from a drug-rich surface, the limit of congruency (LoC) between the two and the drug, polymer, additive, medium and process properties that move it. It has four chapters, in their logical order C. Amorphous solubility and LLPS, D. Crystallization from solution, B. Supersaturation from ASD dissolution and A. Release mechanism and LoC, and 91 papers from 2008 to 2025. The category findings are in findings.md, the links between the chapters in links.md and the citation keys in sources.md. Crystallization of the amorphous solid in storage and the crystallization classes of neat drugs belong to Solid state stability, membrane transport and exposure in animals to Bioperformance, manufacturing to ASD process, and the probe, scattering, NMR and imaging techniques as methods to Characterization methods.

4 chapters91 papers2008–202512 category findings

01How the parts fit together

  • A. Release and LoC → C. Amorphous solubility only polymer-controlled release passes the ceiling and forms nanodroplets (F1, F7)
  • C. Amorphous solubility → A. Release and LoC polymer drawn into the drug-rich phase lowers the ceiling and the LoC (F3)
  • B. Supersaturation from ASD → D. Crystallization seeds, residual and matrix crystals bypass nucleation inhibition (F4)
  • A. Release and LoC → D. Crystallization surfactants that raise the LoC promote nucleation and growth (F6)
  • D. Crystallization → A. Release and LoC HPMCAS grade and pH trade inhibition against release (F10)

The chain runs from the ceiling to its loss and back to the release that produces the supersaturation; the extra links are where one chapter limits or reverses another. indulkar2019a R11, R9; trasi2016 R10; alonzo2012 R18; que2019 R8; shah2025 R3, R4

The four chapters follow one supersaturated solution from its upper limit to its loss and back to the solid that produced it. Amorphous solubility and LLPS sets the ceiling: past a drug-specific concentration a drug-rich phase separates, and the free drug, its activity and the membrane flux stop rising (F1). Crystallization from solution asks how fast nuclei form and grow below and above that ceiling and what slows them. Supersaturation from ASD dissolution puts a dissolving dispersion in front of both: how close it comes to the ceiling, how long it stays there, and what seeds, matrix crystals, surfactants, gastric stages and media do. Release mechanism and LoC goes one step further back, to whether the dispersion releases its drug fast enough to reach the ceiling at all. The chapters were written in that order, and each later one uses the earlier ones as its reference: the ceiling of the first chapter is the benchmark of the third, and the nucleation and growth tests of the second are the screens of the third and fourth.

The chain that runs through them is this. Below its limit of congruency a dispersion releases drug and polymer together, passes the amorphous solubility within minutes and puts the excess into drug-rich droplets; one loading step above it the polymer leaves first and the drug stays at or below the ceiling (F7). Whatever the route, the free drug stops at the amorphous solubility, and a second drug, a polymer or a bile salt that mixes into the drug-rich phase lowers that ceiling and, in the gel, the limit itself (F1, F3). The supersaturation then lasts as long as nucleation is held off: polymers act mainly on nucleation, so seeds, residual crystals and crystals formed in the wetted solid bypass them, and the droplets above the ceiling both hold the free drug and bring crystallization sooner (F4, F5). Each conclusion depends on reading free drug or activity rather than total concentration (F2).

Four conflicts run across the chapters. The surfactants that raise the limit of congruency promote crystallization of the drug they release (F6). Raising the glass transition of the drug by salt formation helped a fast crystallizer and harmed release in PVPVA (F8). The polymer that releases fastest is not the best inhibitor, and inhibitor rankings did not transfer between drugs (F9). The ionization of an enteric polymer works for release and against inhibition, and in the gastrointestinal sequence an undissolved enteric polymer leaves the wetted drug to crystallize in acid (F10, F11); intestinal media add components that act on the ceiling, on nucleation and on release with different signs (F12).

02Chapters

chapterpapersyearswhat it coversits key findings
C. Amorphous solubility and LLPS122013–2022The drug-rich phase that separates from highly supersaturated solutions, its onset and detection, the amorphous solubility and its calculation, the effect of pH, salt, temperature, a second drug, micelles, bile salts and dissolved polymers on it, droplet stability, and reaching the limit from solid forms and after a pH shiftF1 drug-rich phase before crystals, F5 onset near the calculated amorphous solubility, F8 free drug and flux level off, F19 polymers in the drug-rich phase lower it
D. Crystallization from solution282012–2025Precipitates after a pH shift, nucleation and growth measured separately, polymers on growth and on nucleation, polymer pairs, surfactants, seeds and their origin, bile salts as monomers and micelles, lecithin, simulated, volunteer-based and human intestinal fluids, and the HPMCAS gradeF6 growth and nucleation inhibition differ, F20 polymers fail with seeds, F31 bile salts delay nucleation beyond solubilization, F37 droplets make inhibition harder
B. Supersaturation from ASD dissolution222008–2025Crystallization routes of wetted amorphous solids, polymer rankings and solution screens, the ceiling seen from dissolving dispersions and the methods that see it, colloids, drug loading, a second drug and undissolved polymers, additives at droplets, surfactants, seeds and residual crystals, gastric stages, coatings and biorelevant mediaF7 dispersions capped at the amorphous solubility, F10 loading and release speed, F22 seeds by growth area, F24 crystals in acid
A. Release mechanism and LoC292017–2025Congruent and drug-controlled release and their measurement, nanodroplets and their origin, the limit of congruency and its drug, polymer, phase-separation and Tg causes, the gel layer imaged, enteric polymers, buffers and polymer salts, weak-base complexes with HPMCAS, surfactants, plasticizers, process and particle surfaceF2 congruent release at the polymer's pace, F6 the limit as a narrow switch, F25 droplets against a continuous drug-rich layer, F32 weak bases complex HPMCAS

03Category findings

Conclusions that appear only when the chapters are read together. Click a card to read it.

04Which chapter each finding draws on

Show the table of chapters and findings
Amorphous solubility as the ceilingLoss of supersaturation by crystallizationRelease regime and limit of congruencyEnteric polymers and pH shiftsBile salts and biorelevant media
chapterF1F2F3F4F5F6F7F8F9F10F11F12
C. Amorphous solubility and LLPS
D. Crystallization from solution
B. Supersaturation from ASD dissolution
A. Release mechanism and LoC

Dot size = number of chapter findings each category finding draws on.

05Connections to other categories

Solid state stability / Crystallization tendency. The melt and solvent-evaporation classes of the weak bases, of the three induction-time drugs and of the six dihydropyridines came from there hsieh2012 P7; hsieh2014 R18; ilevbare2013c M1–M3; raina2015b R1, and slow crystallization "may explain" why slow crystallizers phase separate before they crystallize ilevbare2013a C27. The solution results test those classes: six dihydropyridines spread over 0.25–12 h in solution from two melt classes, and the acetaminophen polymers rank differently in solution than in the melt raina2015b R1, R6; trasi2015 R14. The counterion effect on amorphous salts was the basis of the delamanid salts, and nifedipine and resveratrol were taken as fast crystallizers duong2022a C5; raina2014b C26; wegiel2015 R22. See F4, F8 and F9.

Solid state stability / Physical stability and Miscibility and drug-polymer interactions. Taken: moisture-induced amorphous–amorphous phase separation of PVP dispersions and its dependence on polymer hygroscopicity purohit2017b C9; rumondor2010c C38, the dry and humid rankings of PVP, HPMC and HPMCAS with felodipine konno2008a R18, the storage stability of the same resveratrol dispersions wegiel2015 R21, the Flory–Huggins χ of ibuprofen with PVP-VA ueda2021 R14, C39, halogen bonding to the vinylpyrrolidone carbonyl que2020 C1 and the critical ionization of enteric polymers hiew2022a R27; qi2022 R19; bapat2023 M3. Given: the tacrolimus amorphous and crystalline solubility to the study of commercial amorphous tacrolimus trasi2017 M1, and congruent release and the limit, used for lumefantrine hiew2022a C44. See F3, F7, F9 and F10.

Bioperformance. The flux plateau at the LLPS concentration was first shown for felodipine and nifedipine and extended in this category to telaprevir, ritonavir, lopinavir and paclitaxel mosqueragiraldo2015 C4, R16, R12; trasi2015a R2; nanodroplets as a reservoir that sustains maximum flux were taken from there indulkar2017b C4; que2019 C3. The composite-FaSSIF recipe and the activity-based supersaturation of atazanavir were shared with the flux studies in simulated and aspirated fluids elkhabaz2021 R4, C6, and the tacrolimus amorphous solubility of about 50 µg/mL was cited by three tacrolimus crystallinity and absorption studies purohit2018 R4; hate2019 M1; purohit2019 M3. See F1, F5 and F12.

Characterization methods. The extinction and probe onsets of Solution methods are the ones measured here almeidaesousa2016 R3; indulkar2015 R12, NMR of the dissolved drug and of the drug-rich phase is a methods result of this category ueda2021 P3, R16, the UV overestimate from particles and SHG detection of crystals were taken from there alonzo2011 R25; jackson2015 C12; jackson2014 R13, C13, and the fluorescence methods for the phase behaviour of dispersions came from Solid-state methods purohit2017b R20. See F2.

ASD process. The mutual lowering of amorphous solubility by a second drug explained lower concentrations from ritonavir–lopinavir co-granules trasi2019 C5, C38; the seed work was cited for percent crystallinity being a crude specification moseson2020a C4, C41, and a posaconazole study found 0.3% residual crystallinity deciding the outcome after a pH shift shah2024 C56, C36. The surface-normalized method and XPS were used for spray-dried ritonavir–PVPVA li2020 E13, R10, C67, and the ritonavir limit of 25% set the loading of coated tablets benson2025 R20. See F3, F4 and F7.

Mesoporous silica and Peptide permeability. The ritonavir results on slow crystallization and HPMC inhibition were cited by a mesoporous silica study (builds_on, as listed in the evidence index of Crystallization from solution), and congruent release from copovidone dispersions and the five-polymer release patterns were used for a peptide permeation enhancer bapat2025b E1, C12. See F7 and F9.

How to read this page. Each finding is one conclusion: a headline, a plain statement, one picture and what it means for your drug. Open How it works for the steps and numbers, and Evidence for the data and conditions, at medium (B) or full (C) length. The coloured tag grades the evidence as strong, moderate or weak. Dotted words show a definition. An id such as hate2017 R15 names a paper and an item in its card. Text marked (synthesis: …) joins several papers and is not one paper's claim.

Evidence length

Topic 1 of 5 · 3 findings · F1–F3

Amorphous solubility as the ceiling

F1

Topic 1Amorphous solubility as the ceiling1 of 3

Whatever the route, free drug levels off at the amorphous solubility, and the excess forms a drug-rich colloid.

Whether supersaturation came from a solvent shift, a pH shift, dissolving dispersions or six marketed tacrolimus capsules, free drug read by flux, NMR or ultracentrifugation stopped at about the amorphous solubility trasi2015a R2, R1; hsieh2012 R10; alonzo2011 R14, M1; jackson2015 R9, R2, M1; trasi2015b R13, M1, M2; trasi2016 R10, R4, R15, R14. The excess appeared as a submicron, non-crystalline colloid: for ritonavir ≈350 nm droplets at 20 µg/mL and none at 10 µg/mL ilevbare2013d R1, R2.

strongStrong for the level at which free drug and flux stop, shown by particle-blind read-outs for several drugs in two chapters; moderate for the calculated value, which missed for ibuprofen and delamanid trasi2015a R2; trasi2015b R13; ueda2022 R16, X6; duong2022a R27, C43.

free drug measureddanazol dispersionsflux; PVP, HPMC, HPMCASSa 87.1–9.1lopinavir dispersionsultracentrifugationSa 17≈17.8ritonavir dispersionsultracentrifugationSa 25≈26.9six tacrolimus capsuleson the plateau of the pure drug≈46–500102030405060free drug from dissolving dispersions, µg/mL

Free drug of each dispersion or product lies at the amorphous solubility (Sa) of the drug, whatever the polymer or the maker. jackson2015 R9, R2, M1; trasi2015b R13, M1, M2; trasi2016 R10, R4

For your drug

  1. Measure the amorphous solubility in the test medium by the onset of a drug-rich phase with at least two methods and compare it with the calculation; a ratio near 1.3–1.7 or 0.4 means checking the free-energy method, crystal form and detection limit first.
  2. Above the estimated amorphous solubility measure free drug by flux, solution NMR or ultracentrifugation, and do not design for free drug above it.

almeidaesousa2015 X5; mosqueragiraldo2015 C23; alonzo2011 P4; jackson2015 P4; trasi2015b P9

How it works and key numbers
  1. At the onset of liquid–liquid phase separation the drug has the same activity in the water and in the water-saturated drug-rich droplets, so the concentration in the water is the amorphous solubility ilevbare2013a C36, C61, C60.
  2. Added drug only increases the amount of drug-rich phase; because the flux J = DSa/(h\gamma_m) follows the donor activity, a flux plateau marks an activity plateau mosqueragiraldo2015 C35, C10, E4, E5; trasi2015a C5.
  3. In a dissolving dispersion a drug-rich phase in metastable equilibrium forms rapidly and fixes the free drug, so all dispersions that undergo LLPS "should" give the same flux jackson2015 C27, C31.
  4. Polymer-controlled release continues past the amorphous solubility and the excess separates as droplets, whereas a drug-controlled surface dissolves by \frac{dx}{dt} = C\,(S - x) and slows toward zero as the solution approaches S indulkar2019a C49, C48; purohit2017b C50.
  5. (synthesis: the routes differ in whether and how fast they reach the amorphous solubility, not in where the free drug stops jackson2015 C31; trasi2016 C36, C37.)
0.91–1.15onset over calculated amorphous solubility in 17 of 24 rowsilevbare2013a R8; almeidaesousa2015 R5, R11
≈46–50 µg/mLfree tacrolimus from six marketed capsules, on the plateau of the pure drugtrasi2016 R10, R4
≈350 nm at 20 µg/mLritonavir droplets from a dissolving dispersion; none at 10 µg/mLilevbare2013d R1, R2
Evidence: data, conditions and papers

Finding F1. Whether supersaturation comes from a solvent shift, a pH shift or a dissolving amorphous drug, dispersion or marketed product, the free drug levels off at the amorphous solubility, and drug beyond it forms a drug-rich colloid

In short. In solvent-shift solutions the onset of a drug-rich phase lay at 0.91–1.15 times the amorphous solubility calculated from crystalline solubility, free-energy difference and water uptake for 17 of 24 rows ilevbare2013a R8; almeidaesousa2015 R5, R11; mosqueragiraldo2015 R13 (C F5), and beyond it the dissolved drug and the membrane flux of telaprevir, ritonavir, lopinavir and paclitaxel stopped rising mosqueragiraldo2015 R10, R12; trasi2015a R2, R1 (C F8). Dissolving amorphous films, a ritonavir–PVP dispersion and salts reached but did not exceed it indulkar2015 R18, F6; ilevbare2013a R17, R8, R13; almeidaesousa2016 R12, R2 (C F13), and flux, NMR and ultracentrifugation put the free drug from dispersions of felodipine, danazol, ritonavir and lopinavir, and from six marketed tacrolimus capsules (≈46–50 µg/mL), at about the same value alonzo2011 R14, M1; jackson2015 R9, R2, M1; trasi2015b R13, M1, M2; trasi2016 R10, R4, R15, R14 (B F7). The excess appeared as a submicron, non-crystalline colloid, for ritonavir ≈350 nm droplets at 20 µg/mL and none at 10 µg/mL ilevbare2013d R1, R2 (B F9). In the release chapter only dispersions whose release stayed under polymer control passed the amorphous solubility and formed such droplets, while drug-controlled release stopped at or below it purohit2017b R10, R11, R7; indulkar2019a R9, R20 (A F4); indulkar2019a R12; purohit2017b R15, R16, R10, R1 (A F3).

Type. cross-chapter synthesis of 11 chapter findings (solvent shift, pH shift, amorphous films, salts, dispersions, marketed capsules, compacts; about 20 drugs) Strength. for the cap on free drug and flux, which particle-blind read-outs show in two chapters with several drugs each (C F8, B F7); moderate for the calculated value, which cannot be recomputed for four of the 2013 predictions and whose best-fitting route changes with the compound (C F5, D F2); moderate for the link to the release regime, which is a co-occurrence in films and compacts (A F4).

How it was shown

Ilevbare and Taylor (2013) recorded extinction during continuous addition of a methanol stock and calculated the amorphous solubility from the crystalline solubility, Tm, ΔHf and water sorption ilevbare2013a P5, P1, P2, P15. Flux, ¹H NMR and ultracentrifugation then read the free drug of solutions and of dissolving dispersions mosqueragiraldo2015 P10, P11; trasi2015a P6; alonzo2011 P4; trasi2015b P9, including the contents of six marketed tacrolimus capsules in 40 mL of pH 4.5 buffer trasi2016 P11, P9.

What the data show

For ritonavir in water at 37 °C the onset was 37.2 µg/mL against a predicted 39.2 µg/mL ilevbare2013a R8, R13. Beyond it the dissolved drug and the flux levelled off, and in the release chapter ritonavir films formed nanodroplets exactly where their free drug reached 27–30 µg/mL trasi2015a R2, R1; purohit2017b R10, R11, R7.

systemmethod and conditionsresultids
17 compounds, solvent shiftonset against calculated amorphous solubility17 of 24 rows at 0.91–1.15 times the predictionilevbare2013a R8, R13; almeidaesousa2015 R5, R11
ritonavir, lopinavir, paclitaxelside-by-side fluxflux levels off; break points 27.3, 16.1, 30.1 µg/mLtrasi2015a R2, R1
ritonavir and lopinavir dispersionsultracentrifugationplateaus ≈26.9 and ≈17.8 µg/mL against 25 and 17 µg/mLtrasi2015b R13, M1, M2
six marketed tacrolimus capsules40 mL pH 4.5, 37 °C; membrane mass flow≈46–50 µg/mL, on the plateau of the pure drugtrasi2016 R10, R4, R15, R14
ritonavir–PVP 10:90stepwise addition, scattering≈350 nm droplets at 20 µg/mL, none at 10 µg/mLilevbare2013d R1, R2
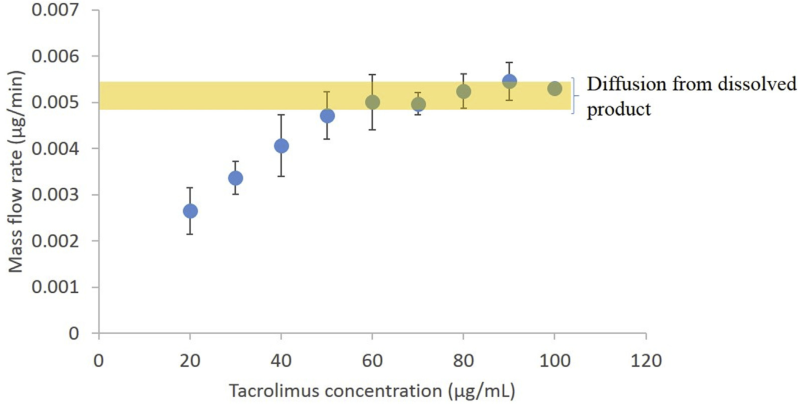
Fig. 8 of trasi2016: membrane mass flow of tacrolimus solutions against concentration, with the band of the six dissolved products
Fig. 8 · trasi2016membrane mass flow of tacrolimus solutions against concentration, with the band of the six dissolved products

The mass flow rises with concentration and then flattens, and the six marketed products fall in the band on the plateau trasi2016 R15, R14.

Why

Ilevbare and Taylor argue from phase equilibrium: the drug has the same activity in the water and in the water-saturated drug-rich droplets, so the concentration at the onset is the amorphous solubility ilevbare2013a C36, C61, C60. Flux follows the donor activity, so a flux plateau marks an activity plateau, and drug added above the amorphous solubility only forms more drug-rich phase mosqueragiraldo2015 C35, C10; trasi2016 C36, C37. (synthesis: the routes differ in whether and how fast they reach the amorphous solubility, not in where the free drug stops.)

Limits and transfer

The tacrolimus products were tested in one buffer with unknown drug loadings trasi2016 P11, X4, and the ibuprofen temperature series lies 1.4–1.7 times above the calculation ueda2022 R16, C37, X6. Measure the amorphous solubility in the test medium with at least two methods almeidaesousa2015 X5; above it measure free drug by flux, solution NMR or ultracentrifugation alonzo2011 P4; jackson2015 P4; trasi2015b P9.

How it was shown

Alonzo and co-workers (2011) measured the free felodipine of dissolving HPMC dispersions by dialysis flux and solution ¹H NMR alonzo2011 P4, P7 (B F7). Hsieh and co-workers (2012) compared the supernatant of amorphous precipitates after a pH rise with two Hoffman estimates of the amorphous solubility, without and with a correction for sorbed water hsieh2012 P11, P13, P8 (D F2). Ilevbare and Taylor (2013) recorded extinction during continuous addition of a methanol stock and compared it with DLS, a pyrene probe and ultracentrifugation ilevbare2013a P5, P11, P10, P7 (C F4), calculated the amorphous solubility from the crystalline solubility, Tm, ΔHf and water sorption ilevbare2013a P1, P2, P15 (C F5), and added portions of a 1:9 ritonavir–PVP dispersion with an in situ UV probe ilevbare2013a P13, P14 (C F8); in a second paper the dispersion was added stepwise, diluted back and its dispersed phase isolated for DSC ilevbare2013d P4, P3, P9 (B F9). In 2015 Mosquera-Giraldo and Taylor followed dissolved telaprevir by ¹H NMR and diffusive flux, and Trasi and Taylor took the break point of flux against donor concentration for three drugs mosqueragiraldo2015 P10, P11; trasi2015a P6, R1 (C F8); Indulkar and co-workers dissolved amorphous films under non-sink conditions indulkar2015 P13, R18 (C F13); Jackson and co-workers measured the flux of danazol dispersions and Trasi and co-workers ultracentrifuged ritonavir and lopinavir dispersions jackson2015 P4; trasi2015b P9 (B F7). In 2016 Trasi and co-workers dissolved the contents of six marketed 5-mg tacrolimus capsules in 40 mL of pH 4.5 buffer and measured membrane mass flow trasi2016 P11, P9 (B F7), and Jackson and co-workers read the danazol onset with 1–1000 µg/mL polymer by four methods and measured the maximum flux jackson2016 P4, P5, P6, P7, P8, P9 (D F22). From 2017 the release chapter measured free ritonavir from films by ultracentrifugation, pyrene and particle tracking, and compared the drug released from compacts with the amorphous-solubility line purohit2017b P16, P17, P12; indulkar2019a R1, P6 (A F4).

What the data show

For ritonavir in water at 37 °C the onset was 37.2 µg/mL against a predicted 39.2 and a film-dissolution value of 34.2 µg/mL ilevbare2013a R8, R13 (C F5). Beyond the onset the flux of ritonavir, lopinavir and paclitaxel flattened at about 0.21–0.22, 0.13–0.14 and 0.25–0.27 µg/min, with break points of 27.3, 16.1 and 30.1 µg/mL that matched three other estimates trasi2015a R2, R1 (C F8), and the NMR-measured dissolved ibuprofen stayed at 150–157 µg/mL from 200 to 600 µg/mL added ueda2021 R10 (C F8). After a pH rise the supernatants of four amorphous precipitates (5.09, 157, 76.5 and 11.3 µg/mL) lay between or near the two estimates, and carvedilol's 8.68 µg/mL below both hsieh2012 R10 (D F2). Three polymers at 1–1000 µg/mL left the danazol onset at 7–9.1 µg/mL against a recalculated 7.8 µg/mL and did not lower its maximum flux jackson2016 R8, R9, R3, R11 (D F22). From dissolving dispersions, receiver slopes of felodipine were 8.5–10.5 times those of the crystal against a predicted amorphous advantage of about 9, danazol dispersions that formed a drug-rich phase gave 7.1–9.1 µg/mL free drug against an amorphous solubility of 8 µg/mL even where UV read ≈16.2 µg/mL, and ultracentrifuged ritonavir and lopinavir dispersions plateaued at ≈26.9 and ≈17.8 µg/mL against 25 and 17 µg/mL alonzo2011 R14, M1, R1; jackson2015 R9, R2, M1; trasi2015b R13, M1, M2 (B F7). The six tacrolimus capsules, innovator and generics, all levelled at ≈46–50 µg/mL and their solutions crossed a membrane at 0.0048–0.0054 µg/min, on the plateau of the pure drug trasi2016 R10, R4, R15, R14 (B F7). In the release chapter ritonavir films formed nanodroplets exactly where their free drug reached 27–30 µg/mL purohit2017b R10, R11, R7 (A F4), and from 50:50 films the PVP or PVPVA dissolved while ritonavir reached only ≈18 and ≈9 µg/mL purohit2017b R15, R16, R10, R1 (A F3).

chapter findingsystemmethod and conditionsresultids
C F517 compounds, solvent shiftonset against calculated amorphous solubility17 of 24 rows at 0.91–1.15 times the prediction; ritonavir 37.2 against 39.2 µg/mLilevbare2013a R8, R13; almeidaesousa2015 R5, R11
C F8telaprevir; ritonavir, lopinavir, paclitaxelNMR and side-by-side fluxdissolved drug and flux level off; break points 27.3, 16.1, 30.1 µg/mLmosqueragiraldo2015 R10, R12; trasi2015a R2, R1
C F13clotrimazole, atazanavir, nicardipine films; ritonavir–PVP 1:9non-sink dissolution, UVmaxima 69–110% of the LLPS concentration; dispersion stalled at 18.3 against 18.8 µg/mLindulkar2015 R18, F6; ilevbare2013a R17, R8
D F2four type 2 weak basespH rise, supernatant against two Hoffman estimates5.09, 157, 76.5, 11.3 µg/mL between or near the estimateshsieh2012 R10
D F22danazol with PVP, HPMC, HPMC-AS 1–1000 µg/mLfour onset methods, fluxonset 7–9.1 µg/mL against 7.8 calculated; maximum flux not loweredjackson2016 R8, R9, R3, R11
B F7felodipine, danazol, ritonavir, lopinavir dispersionsdialysis flux, NMR, side-by-side flux, ultracentrifugationfree drug at about the amorphous solubility whatever the loading or polymeralonzo2011 R14, M1; jackson2015 R9, R2; trasi2015b R13
B F7six marketed tacrolimus capsules40 mL pH 4.5, 37 °C; membrane mass flow≈46–50 µg/mL, on the plateau of the pure drugtrasi2016 R10, R4, R15, R14
B F9ritonavir–PVP 10:90stepwise addition, scattering, DSC of the phase≈350 nm droplets at 20 µg/mL, none at 10 µg/mL; phase Tg about 1 °Cilevbare2013d R1, R2
A F4ritonavir films; ritonavir–PVPVA tabletsfree drug, pyrene, NTA; release against the amorphous-solubility linedroplets only where free drug reached 27–30 µg/mL; 10–25% tablets passed it within 5–10 minpurohit2017b R10, R11, R7; indulkar2019a R9, R20
A F3ritonavir films 50:50; ritonavir–PVPVA tablets 50%free drug; release into saturated medium≈18 and ≈9 µg/mL against about 27 µg/mL; no drug release into saturated mediumpurohit2017b R15, R16, R10, R1; indulkar2019a R12

Figure

Fig. 8 of trasi2016: membrane mass flow of tacrolimus solutions against concentration, with the band of the six dissolved products
Fig. 8 · trasi2016membrane mass flow of tacrolimus solutions against concentration, with the band of the six dissolved products
The mass flow of tacrolimus solutions rises with concentration and then flattens; the six marketed products fall in the band on the plateau, at the amorphous solubility of the pure drug trasi2016 R15, R14 (B F7).

Why

Ilevbare and Taylor argue from phase equilibrium: the drug has the same activity in the water and in the water-saturated drug-rich droplets, so the concentration in the water at the onset is the amorphous solubility ilevbare2013a C36, C61, C60 (C F5). In an equilibrated two-phase system added drug only increases the amount of drug-rich phase, and because flux J = DSa/(h\gamma_m) follows the donor activity, a flux plateau marks an activity plateau mosqueragiraldo2015 C35, C10, E4, E5; trasi2015a C5 (C F8). The supersaturation chapter applies the same argument to dissolving dispersions: a drug-rich phase in metastable equilibrium forms rapidly and fixes the free drug, so all dispersions that undergo LLPS "should" give the same flux jackson2015 C27, C31 (B F7), and drug added above the amorphous solubility only forms more drug-rich phase trasi2016 C36, C37 (B F7). The release chapter explains which dispersions get there: polymer-driven release continues past the amorphous solubility because the polymer sets the rate, and the excess separates as droplets, whereas a drug-controlled surface dissolves by \frac{dx}{dt} = C\,(S - x) and slows toward zero as the solution approaches S indulkar2019a C49, C48; purohit2017b C50 (A F4); purohit2017b E3, C50 (A F3). (synthesis: the amorphous solubility is a property of the drug and the medium, so the routes of the four chapters differ in whether and how fast they reach it, not in where the free drug stops; the release regime of F7 and crystallization during the approach, F4, decide whether it is reached.)

Conditions and limits

The dispersion test of the LLPS chapter was one composition, one polymer and one run, with total drug read by UV ilevbare2013a X15 (C F13). The danazol fluxes are relative, and the tacrolimus products were tested in one buffer with unknown drug loadings jackson2015 X4; trasi2016 P11, X4 (B F7). Zero release into saturated medium was shown for one loading of one drug indulkar2019a X8 (A F3). For a drug that degrades on melting, such as pazopanib, the calculation cannot be made sugihara2018 C17 (C F5). The cap was shown for lipophilic, poorly soluble drugs in buffers; in micellar and biorelevant media the concentration at the cap is not the activity (F2).

Counterexamples and conflicts

A component that mixes into the drug-rich phase lowers the cap: with PVP and HPMC the danazol dispersions sat at 7.1–7.3 against 8.7–9.1 µg/mL with HPMCAS jackson2015 R9, R2 (B F7), and a second drug, dissolved polymers and undissolved polymers lowered it further (F3). UV readings above the limit were not resolved for seeded paclitaxel, praziquantel and delamanid dispersions que2018 X4; polyzois2024 X3, X4; nguyen2023c X9 (B F8). In the release chapter the low-Tg drugs loratadine and clopidogrel passed the amorphous solubility although the polymer ran ahead yang2021 R19, R16, C14, C15 (A F4). The calculation can miss: the ibuprofen temperature series lies 1.4–1.7 times above it, traced to D2O against H2O inputs as "one possible reason" ueda2022 R16, C37, X6 (C F5), and for delamanid the Hoffman ratio of 31.8 lay below the measured 42.3 duong2022a R27, C43 (B F23).

Transfer check

Measure the amorphous solubility in the test medium by the onset of a drug-rich phase with at least two methods and compare it with the calculation; a ratio near 1.3–1.7 or 0.4 means check the free-energy method, crystal form and detection limit first almeidaesousa2015 X5; mosqueragiraldo2015 C23 (C F5). Above the estimated amorphous solubility measure free drug by flux, solution NMR or ultracentrifugation and do not design for free drug above it alonzo2011 P4; jackson2015 P4; trasi2015b P9 (B F7). In a release test, compare the released amount with the amorphous solubility measured in the same medium and expect droplets only once it is passed purohit2017b P16, P17, P12; saboo2019 P12 (A F4).

History

2011: Alonzo and co-workers found the free felodipine of 90:10 and 50:50 dispersions near the predicted amorphous advantage, an equality they called possibly "purely coincidental" alonzo2011 R14, C48 (B F7). 2012: Hsieh and co-workers placed the plateaus of amorphous precipitates near estimated amorphous solubilities hsieh2012 R10 (D F2). 2013: Ilevbare and Taylor identified the LLPS onset with the amorphous solubility, proposed it as a way to measure that solubility without a reference amorphous solid, and showed a dissolving ritonavir–PVP dispersion stalling at it ilevbare2013a C6, R17 (C F5, C F8); Ilevbare and co-workers saw the colloid of a dissolving dispersion appear at the LLPS concentration ilevbare2013d R1 (B F9). 2015: flux plateaus were shown for telaprevir, ritonavir, lopinavir and paclitaxel mosqueragiraldo2015 R10, R12; trasi2015a R2 (C F8), and Jackson and co-workers concluded that the maximum supersaturation of an ASD "is dictated by the LLPS concentration" jackson2015 C38 (B F7). 2016: Trasi and co-workers extended the cap to six marketed capsules, "at least in the case of tacrolimus" trasi2016 C45 (B F7), and Jackson and co-workers revised the danazol onset to about 8 µg/mL jackson2016 R8, R13 (D F22). 2017–2019: the release chapter tied passing the cap to polymer-controlled release purohit2017b R10, R11; indulkar2019a R9, R20 (A F4). 2021: NMR showed the cap for ibuprofen in one tube ueda2021 R10 (C F8), and loratadine showed that partly incongruent release of a low-Tg drug can also pass it yang2021 R19, C15 (A F4).

F2

Topic 1Amorphous solubility as the ceiling2 of 3

Near the amorphous solubility and in micelles, total drug misleads; free drug or activity has to be measured.

In situ UV counted drug-rich colloid as dissolved drug: a danazol dispersion read ≈16.2 µg/mL by UV and 8.2 ± 1.2 µg/mL by flux jackson2015 R2, R9. In SDS the concentration-based supersaturation of atazanavir at its amorphous solubility was about 33–37.5 and the activity-based value about 65–70 indulkar2017a R11, R13. In release tests the drug curve alone did not show the release regime; the polymer had to be assayed as well indulkar2019a R12, R13.

moderateModerate to strong: each overread is shown against a particle-blind or activity read-out in the same paper, but the flux calibration assumes that micelles do not cross the membrane and most values come from one laboratory alonzo2011 R1, R14; indulkar2017a X9, X12.

in situ UVflux, NMR, or centrifugation and HPLCfelodipine–HPMC 90:10≈8.9≈27danazol–HPMCAS 90:108.2 ± 1.2≈16.2indomethacin crystal suspension8.8≈29.5CRH1 hemi-NAP salt11.419.105101520253035drug concentration read, µg/mL

The UV probe reads particles as solute; a particle-blind method on the same sample gives about half or less. alonzo2011 R1, R14, R15; jackson2015 R2, R9; xie2017 R11, R15; almeidaesousa2016 R12

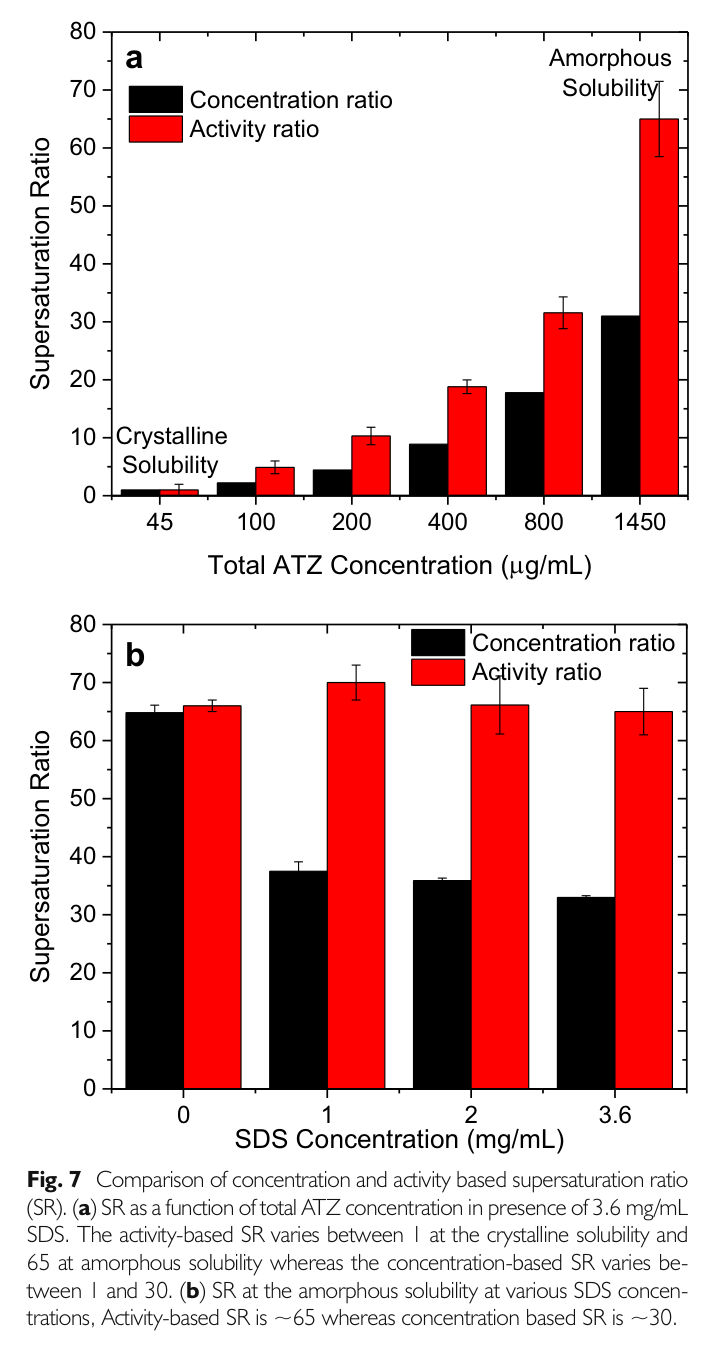
concentration ratioactivity ratio from fluxin 1–3.6 mg/mL SDS33–37.565–70six mediaconcentration ratio in human fluidabout 1450–5601020304050607080supersaturation of atazanavir at its amorphous solubility

Micelles raise the total drug, so the concentration ratio falls while the activity ratio stays at the buffer level. indulkar2017a R11, R13; elkhabaz2019b R8, R9, C21

For your drug

  1. If the medium turns cloudy, treat UV values as total drug, confirm the dissolved level by ultracentrifugation, flux or solution NMR, and test which filter pore size retains the drug's droplets.
  2. In a micellar or biorelevant medium measure flux in buffer first, repeat in the medium and compare activity and concentration ratios; for a dispersion, assay drug and polymer from constant-area compacts and rerun the target loading in presaturated medium.

trasi2015b R6, P9; alonzo2011 P4; trasi2016 R8; indulkar2017a P7, P8, X9; saboo2019 P10, P20; indulkar2019a R12, C43

How it works and key numbers
  1. For UV, "the most likely explanation" is that submicron particles absorb light like the solution and are not removed by second-derivative processing, whereas diffusion and NMR detect only highly mobile species alonzo2011 C27.
  2. Supersaturation is the activity ratio SR = \gamma c/(\gamma^{*} c^{*}); the concentration ratio equals it only if the activity coefficients at the two concentrations are equal, and micelles break that equality indulkar2017a E9, C20.
  3. An additive could lengthen induction times merely by lowering the driving force; fixing the ratio, showing unchanged flux or calibrating the activity rules this out chen2015 C7; li2016a C47, C50, C51; lu2017 C25, C26.
  4. A drug-controlled surface in medium already at the amorphous solubility has no driving force, so continued release into such a medium marks polymer control and zero release a drug-rich surface indulkar2017b E4, E5, C35; indulkar2019a C43, C42.
≈16.2 vs 8.2 µg/mLdanazol dispersion by in situ UV against fluxjackson2015 R2, R9
33–37.5 vs 65–70concentration-based against activity-based supersaturation of atazanavir in SDSindulkar2017a R11, R13
10% vs 50%ritonavir–PVPVA tablets into ritonavir-saturated medium: release as in buffer, or no drugindulkar2019a R12, R13
Evidence: data, conditions and papers

Finding F2. Near and above the amorphous solubility, and in micellar media, the total drug concentration misleads: in situ UV and filtration count the colloid, concentration ratios understate the supersaturation, and only free drug or activity, with the polymer assayed beside the drug, compares routes, media and release regimes

In short. In situ UV read ≈27 µg/mL for a 90:10 HPMC–felodipine dispersion and ≈16.2 µg/mL for a danazol dispersion whose flux gave 8.2 ± 1.2 µg/mL, and colloids of HPMCAS dispersions of ritonavir and lopinavir passed 0.45 µm filters alonzo2011 R1, R14, R15; jackson2015 R2, R9; trasi2015b R6, R7, C22, C27 (B F8); in solvent-shift solutions extinction cannot tell crystals from droplets and an in situ UV probe read 19.1 µg/mL against 11.4 µg/mL by centrifugation and HPLC almeidaesousa2015 C16, X3; almeidaesousa2016 R12 (C F4). In SDS the ratio of total concentration to crystalline solubility at the amorphous solubility of atazanavir was about 33–37.5, the ratio of flux-derived activities about 65–70, as in buffer indulkar2017a R11, R13 (C F16), and only the activity scale separated the delay of nucleation by bile salts from solubilization chen2015 R1, R3; li2016a R13, R15; lu2017 R1, R3 (D F31). For release, the drug curve alone does not show the regime: assaying the polymer from a compact of constant area and dissolving into medium already at the amorphous solubility did indulkar2019a R12, R13; indulkar2017b R8, R9, R1 (A F1).

Type. cross-chapter synthesis of 9 chapter findings (method comparisons in all four chapters) Strength. to strong: each overread or understatement is shown against a particle-blind or activity read-out in the same paper (B F8, C F16, D F31), but the flux calibration assumes that micelles do not cross the membrane and most values come from one laboratory (C F16, C F4).

How it was shown

Alonzo and co-workers (2011) compared the UV spectrum of a dissolving felodipine dispersion with a solution and a crystalline nanosuspension, and Jackson and co-workers (2015) compared UV with flux for danazol alonzo2011 P2, P10; jackson2015 P2, P4. Indulkar and co-workers (2017) calibrated atazanavir flux in buffer and converted flux in 1–3.6 mg/mL SDS into free drug and activity indulkar2017a P7, P8, P9, E9. From 2018 the release chapter assayed drug and polymer in the same samples and dissolved dispersions into presaturated medium bhardwaj2018 P6, P7, E4; indulkar2019a P2, P3; saboo2019 P9, E4.

What the data show

In SDS the free atazanavir at the amorphous solubility was about 65–70 µg/mL although the total was about 1450 µg/mL indulkar2017a R11, R13. For nevirapine with 13 bile salts the concentration ratio stayed at about 7.1–8.7 while the induction time ran from 0 to about 577 min li2016a R13, R15.

systemmethod and conditionsresultids
felodipine–HPMC 90:10 and 50:50in situ UV against flux and NMRUV ≈27 against ≈8.9 µg/mLalonzo2011 R1, R14, R15, R19
danazol–HPMCAS 90:10; ritonavir and lopinavir–HPMCASUV against flux; 0.45 µm filtration, NTA≈16.2 against 8.2 ± 1.2 µg/mL; colloids of about 500 and 160 nm passed the filterjackson2015 R2, R9; trasi2015b R6, R7, C22, C27
atazanavir in 1–3.6 mg/mL SDSflux calibration in bufferconcentration ratio 33–37.5, activity ratio 65–70indulkar2017a R11, R13
atazanavir, posaconazole in six media incl. human fluidflux against concentrationflux-based maximum 50–56 and 29–37 constant; concentration-based down to 14 and 5elkhabaz2019b R8, R9, C21
nilvadipine–PVPVA; ritonavir–PVPVAconstant-area compacts, both components; presaturated mediumneat polymer 1700 times faster; 10% released, 50% did notsaboo2019 R5, R7; indulkar2019a R12, R13
Fig. 7 of indulkar2017a: concentration-based and activity-based supersaturation of atazanavir in SDS
Fig. 7 · indulkar2017aconcentration-based and activity-based supersaturation of atazanavir in SDS

At each SDS level the concentration-based supersaturation at the amorphous solubility lies near half of the activity-based value, which stays at the buffer level indulkar2017a R11, R13.

Why

For UV, "the most likely explanation" is that submicron particles absorb light like the solution alonzo2011 C27. Supersaturation is the activity ratio SR = \gamma c/(\gamma^{*} c^{*}), which the concentration ratio equals only if the activity coefficients are equal, and micelles break that indulkar2017a E9, C20. A drug-controlled surface in medium at the amorphous solubility has no driving force, so continued release into a saturated medium marks polymer control indulkar2017b E4, E5, C35; indulkar2019a C43, C42.

Limits and transfer

The flux calibration assumes that micelles do not cross the 6–8 kDa membrane indulkar2017a X9, X12. If the medium turns cloudy, treat UV values as total drug and confirm the dissolved level by ultracentrifugation, flux or solution NMR trasi2015b R6, P9; alonzo2011 P4; in a micellar medium measure flux in buffer first and compare activity and concentration ratios indulkar2017a P7, P8, X9, C55.

How it was shown

Alonzo and co-workers (2011) compared the UV spectrum of a dissolving 90:10 HPMC–felodipine dispersion with a solution, a crystalline nanosuspension and their sum, and Jackson and co-workers (2015) compared UV with flux for danazol alonzo2011 P2, P10; jackson2015 P2, P4 (B F8). In 2013–2016 the LLPS chapter recorded extinction during continuous addition and compared it with DLS, polarity probes, ultracentrifugation with HPLC, NMR and flux ilevbare2013a P5, P11, P10, P7; mosqueragiraldo2015 P10; trasi2015a P6 (C F4). Filtrates were examined by nanoparticle tracking or HPLC, and tacrolimus solutions passed through 0.22 and 0.7 µm glass filters trasi2015b P8; xie2017 P9; trasi2016 P6 (B F8). Chen and co-workers (2015) fixed the ratio of drug concentration to the crystalline solubility in each medium, Li and co-workers (2016) measured membrane mass flow with and without bile salt, and Lu and co-workers (2017) set telaprevir so that the flux-based activity ratio was 11.5 or 28.8 chen2015 P1, P2, C7; li2016a P1, P8, E1, E2; lu2017 E1, E2, P1, R1 (D F31). Li and co-workers (2016) referred lopinavir leached in acid to the crystalline solubility measured in each surfactant medium li2016b P5, E1 (B F19). Indulkar and co-workers (2017) calibrated atazanavir flux in buffer and converted flux in 1–3.6 mg/mL SDS into free drug and activity indulkar2017a P7, P8, P9, E9 (C F16). From 2018 the release chapter pressed dispersions into a die so that one face of about 0.5 cm² dissolved, assayed drug and polymer in the same samples, normalized each rate by the weight fraction, and dissolved dispersions into presaturated medium bhardwaj2018 P6, P7, E4; indulkar2019a P2, P3; saboo2019 P9, E4 (A F1). Ueda and co-workers (2020–2021) split the ¹H NMR peaks of ibuprofen into dissolved and drug-rich sets and read the polymer lost from solution ueda2020b P4; ueda2021 P2, P3, P4 (C F15).

What the data show

Colloid counted as solute. The 90:10 felodipine spectrum peaked at 367 nm with a valley at 312 nm, between dissolved felodipine and a crystalline nanosuspension, while flux and NMR gave dissolved levels like the 50:50 dispersion alonzo2011 R1, R14, R15, R19 (B F8). An indomethacin crystal suspension read ≈29.5 µg/mL by in situ UV against 8.8 µg/mL by HPLC of the filtered supernatant, and tacrolimus droplets passed a 0.7 µm filter but not a 0.22 µm one xie2017 R11, R15, X7; trasi2016 R8 (B F8). For telaprevir in 50 mM pH 6.5 buffer extinction, ultracentrifugation and the flux plateau agreed (146, 149 and 148 µg/mL), but extinction failed outright for two bile salts lu2017b R2.a, R4 (C F4). Reading time mattered as well: the danazol probe signal appeared at 10–14 µg/mL when read 15 s after each addition and at about 8 µg/mL after 1 or 5 min jackson2016 R13, R12 (D F22). Concentration against activity. In SDS the free atazanavir at the amorphous solubility was about 65–70 µg/mL although the total was about 1450 µg/mL indulkar2017a R11, R13 (C F16). Across six media, buffers, simulated intestinal fluids and pooled human fluid, the flux-based maximum of atazanavir and posaconazole stayed at about 50–56 and 29–37 while the concentration-based value fell to about 14 and 5 in the human fluid elkhabaz2019b R8, R9, C21 (C F16). For nevirapine with 13 bile salts the concentration ratio stayed at about 7.1–8.7 while the induction time ran from 0 to about 577 min, and the mass flow of celecoxib and nevirapine did not change with 0.1% STC or SGC li2016a R13, R15 (D F31); at 12 mM the dihydroxy media needed about 140 instead of about 60 µg/mL telaprevir for the same activity lu2017 R1 (D F31). With lopinavir in acid, surfactants raised leached drug and crystalline solubility together so that C/Ceq stayed at ≈3.25–3.9 with HPMCAS-HF li2016b R19, R20 (B F19), a concentration ratio that the SDS result shows need not equal the activity ratio (synthesis). Drug against polymer. Neat PVPVA dissolved about 1700 times faster than amorphous nilvadipine, and 10% ritonavir–PVPVA tablets released as in plain buffer into ritonavir-saturated medium while 50% tablets released no drug saboo2019 R5, R7; indulkar2019a R12, R13 (A F1). One tube for drug and polymer. For ibuprofen NMR gave 154 µg/mL dissolved drug against 151 µg/mL calculated and a polymer:drug weight ratio of 0.40–1.14 in the drug-rich phase for six polymers ueda2021 R3, R5, R6, R4 (C F15).

chapter findingsystemmethod and conditionsresultids
B F8felodipine–HPMC 90:10 and 50:50in situ UV against flux and NMRUV ≈27 against ≈8.9 µg/mL; flux and NMR similaralonzo2011 R1, R14, R15, R19
B F8danazol–HPMCAS 90:10; ritonavir and lopinavir–HPMCASUV against flux; 0.45 µm filtration, NTA≈16.2 against 8.2 ± 1.2 µg/mL; colloids of about 500 and 160 nm passed the filterjackson2015 R2, R9; trasi2015b R6, R7, C22, C27
C F4CRH1 hemi-NAP salt; telaprevir with bile saltsin situ UV against centrifugation and HPLC; extinction19.1 against 11.4 µg/mL; extinction failed for two bile saltsalmeidaesousa2016 R12; lu2017b R4
D F22danazolpyrene read at 15 s, 1 and 5 minonset 10–14 µg/mL at 15 s, about 8 µg/mL laterjackson2016 R13, R12
C F16atazanavir in 1–3.6 mg/mL SDSflux calibration in bufferconcentration ratio 33–37.5, activity ratio 65–70indulkar2017a R11, R13
C F16atazanavir, posaconazole in six media incl. human fluidflux against concentrationflux-based maximum 50–56 and 29–37 constant; concentration-based down to 14 and 5elkhabaz2019b R8, R9, C21
D F31nevirapine, celecoxib with bile salts; telaprevirmatched ratio, mass flow, activity calibrationinduction times rose at matched ratio and unchanged flux; 140 against 60 µg/mL for equal activity at 12 mMli2016a R13, R15; lu2017 R1
B F19lopinavir–HPMCAS-HF and HPMCP at pH 3leaching with surfactants, C/Ceqratio ≈3.25–3.9 (HF) and ≈1.55–1.8 (HPMCP)li2016b R19, R20
A F1nilvadipine–PVPVA; ritonavir–PVPVA; nifedipine dispersionsconstant-area compacts, both components; presaturated mediumneat polymer 1700 times faster; 10% released, 50% did not; nifedipine dissolved into saturated watersaboo2019 R5, R7; indulkar2019a R12, R13; indulkar2017b R8, R9, R1
C F15ibuprofen with six polymersquantitative ¹H NMR in D2O buffer154 against 151 µg/mL; polymer:drug 0.40–1.14 in the drug-rich phaseueda2021 R3, R5, R6, R4

Figure

Fig. 7 of indulkar2017a: concentration-based and activity-based supersaturation of atazanavir in SDS
Fig. 7 · indulkar2017aconcentration-based and activity-based supersaturation of atazanavir in SDS
At each SDS level the concentration-based supersaturation at the amorphous solubility lies near half of the activity-based value, which stays at the buffer level indulkar2017a R11, R13 (C F16).

Why

For UV, "the most likely explanation" is that submicron particles absorb light like the solution and are not removed by second-derivative processing, whereas diffusion and NMR detect only highly mobile species alonzo2011 C27 (B F8); in-situ UV overreads because nanometre-sized drug-rich species absorb like dissolved drug ("highly probable") almeidaesousa2016 C20, C30 (C F4). Supersaturation is the activity ratio SR = \gamma c/(\gamma^{*} c^{*}), which the concentration ratio equals only if the activity coefficients at the two concentrations are equal, and micelles break that indulkar2017a E9, C20 (C F16). An additive could lengthen induction times merely by lowering the driving force, so fixing the ratio, showing unchanged flux or calibrating the activity rules this out chen2015 C7; li2016a C47, C50, C51; lu2017 C25, C26 (D F31). For release, a drug-controlled surface in medium at the amorphous solubility has no driving force, so continued release into a saturated medium marks polymer control and zero release a drug-rich surface indulkar2017b E4, E5, C35; indulkar2019a C43, C42 (A F1). (synthesis: the chapters meet the same problem from three sides, a colloid that is counted as solute, a micelle that is counted as driving force, and a polymer that is not counted at all; in each case the quantity that sets the outcome, the free drug's activity or the component that sets the release rate, has to be measured directly.)

Conditions and limits

The particle absorbance at the probe was not quantified alonzo2011 K3 (B F8). The flux calibration assumes that micelles do not cross the 6–8 kDa membrane, and for bile salts part of the offsets lies within the uncertainty of the solubilities indulkar2017a X9, X12; lu2017b X7, X8 (C F16). The flux check of bile salts covers two bile salts and two drugs li2016a X17 (D F31). How the medium was presaturated is not stated, and the release papers differ in their congruency criterion indulkar2019a X8; saboo2020 P5; que2021 P9; yang2021 P17; hiew2022b P8, X6 (A F1). NMR reads the drug-rich phase only for low-Tg drugs: for nifedipine and glibenclamide it saw only the dissolved drug ueda2020b R16 (C F15).

Counterexamples and conflicts

In some systems the simpler read-out sufficed: for telaprevir in buffer extinction, ultracentrifugation and flux agreed within 3 µg/mL lu2017b R2.a (C F4), and with a micellar solubilizer below its CMC the two ratios may agree indulkar2017a C55 (C F16). For telaprevir with six bile salts the activity ratio scattered about the concentration ratio rather than below it lu2017b R17 (C F16). Later papers still report UV readings above the amorphous solubility without a particle-blind check que2018 X4; elkhabaz2019a X3; polyzois2024 X3; nguyen2023c X9 (B F8).

Transfer check

If the medium turns cloudy, treat UV values as total drug, confirm the dissolved level by ultracentrifugation, flux or solution NMR, and test which pore size retains the drug's droplets trasi2015b R6, P9; alonzo2011 P4; trasi2016 R8 (B F8). In a micellar or biorelevant medium measure flux in buffer first, repeat in the medium and compare activity and concentration ratios indulkar2017a P7, P8, X9, C55 (C F16); before reading a longer induction time as inhibition, measure the crystalline solubility and the mass flow with and without the additive li2016a R15; lu2017 R1, R5 (D F31). For a dispersion, press compacts of the dispersion, the neat polymer and the neat amorphous drug in the same die, assay both components, and rerun the target loading in presaturated medium saboo2019 P10, P20; indulkar2019a R12, C43 (A F1).

History

2011: Alonzo and co-workers traced the UV excess of a felodipine dispersion to particles by its spectrum and by flux and NMR alonzo2011 R1, R14, R15 (B F8). 2013–2016: the LLPS chapter set several onset principles side by side and found extinction blind to the nature of the second phase almeidaesousa2015 C16; almeidaesousa2016 R12 (C F4); Trasi and co-workers found colloids passing 0.45 µm filters and called ultracentrifugation "the optimum way" trasi2015b R6, R7, C27 (B F8). 2015–2017: the bile-salt papers separated nucleation from solubilization by matched ratios, flux and an activity calibration chen2015 R1, R3; li2016a R13, R15; lu2017 R1, R3 (D F31), and Indulkar and co-workers showed the twofold understatement in SDS indulkar2017a R11, R13 (C F16). 2018–2020: the release chapter adopted constant-area compacts with both components assayed bhardwaj2018 P6, P7, E4; saboo2019 P9, E4 (A F1). 2019: the activity scale was carried to pooled human intestinal fluid elkhabaz2019b R8, R9, C21 (C F16). 2021: NMR read dissolved drug and polymer in the drug-rich phase in one tube ueda2021 R3, R4, R5 (C F15).

F3

Topic 1Amorphous solubility as the ceiling3 of 3

A component that mixes into the drug-rich phase lowers the amorphous solubility, and in the gel the limit of congruency.

A second drug, a dissolved or undissolved polymer and a bile salt each lowered the amorphous solubility of a drug trasi2015a R7, R9, R11; ueda2020b R1; li2018 R3, R1; indulkar2018 R6. With 10 µM lopinavir, paclitaxel or felodipine in solution, ritonavir separated at about 14, 10 and 12 instead of about 26 µg/mL trasi2015a R7, R9, R11. Phenolphthalein analogues that carried more PVPVA into their drug-rich nanoparticles had lower limits of congruency deac2023b R3, R8, R1.

strongStrong for the lowering itself, measured by fluorescence, ultracentrifugation, flux or NMR; moderate for the link to the limit of congruency, which rests on cited limits and a rank order of four analogues; danazol is a counterexample trasi2015a R13; ueda2020b R13; deac2023b X6, X14; jackson2016 R8, R9.

drug alonewith the added componentritonavir10 µM second drug10–1426ibuprofendissolved HPMC or PVP-VA90.7–96.9177.1atazanavirtaurocholate3865lopinavir, 15% drugundissolved polymer, pH 30.3–4.317.4phenolphthaleinPVPVA27.52000.1110100amorphous solubility or maximum free drug, µg/mL (log scale)

Each added component that enters the drug-rich phase lowers the level at which the drug separates. trasi2015a R7, R9, R11; ueda2020b R1; indulkar2018 R6; li2018 R3, R1; deac2023b R1

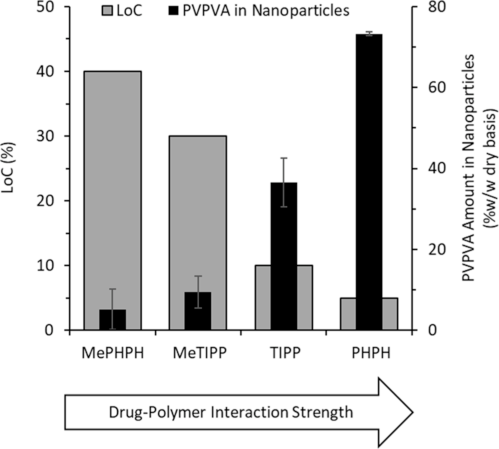
PVPVA in the drug-rich nanoparticles, wt%PHPHcited limit 5%about 77TIPPcited limit 10%36.5MeTIPPcited limit 30%9MePHPHcited limit 40%about 5

The more polymer the drug-rich phase holds, the lower the limit of congruency; the critical points of measured diagrams, about 33, 33, 14 and 4%, follow the order of the limits. deac2023b R3, R8; deac2024b R37

For your drug

  1. For co-dosed drugs, ultracentrifuge a mixture at the intended ratio, since the drug present in the smaller molar amount loses most; measure the amorphous solubility with the dispersion polymer dissolved at 150–300 µg/mL or more.
  2. Make drug-rich nanoparticles of the candidate in buffer with 0.5 mg/mL polymer: a polymer-rich particle phase or a large drop in amorphous solubility flags an associative system, for which these papers predict a low limit of congruency.

trasi2015a P8, P12, E4, C50; ueda2020b P3, P4, X5; deac2023b P1, P2, R1, C65

How it works and key numbers
  1. Amorphous drugs are liquid-like and can mix; with ideal mixing each drug's chemical potential falls by RT\ln x, so S_a(x_1) = S_a^\circ x_1 ("suggests") trasi2015a C37, E2, E3, E4.
  2. Ionic charge keeps diclofenac anions out of the hydrophobic ritonavir-rich phase, so ionized diclofenac did not lower it trasi2015a C35, C44, R11.
  3. HPMC and PVP-VA distribute into the droplets in large amount and dilute the drug there; the unchanged crystalline solubility shows that the polymers do not solubilize it ueda2020b C32, C33, C11.
  4. For undissolved polymers, mixing and water uptake lower the drug's chemical potential relative to the pure amorphous phase, applied as \Delta\mu_{drug}/RT = \ln\Phi_{drug} + (1 - 1/r)\Phi_{poly} + \chi\Phi_{poly}^{2} only "in a qualitative manner" li2018 C43, C44, C45, E4, C46.
  5. In the hydrating gel the phenols are read as drawing PVPVA in by hydrogen bonding, so that their polymer-rich drug phase becomes the majority, and connects, at a lower loading ("are hypothesized") deac2023b C43, C45, C46, C48, C63.
about 26 → 10–14 µg/mLritonavir LLPS concentration with 10 µM of a second unionized drugtrasi2015a R7, R9, R11
177.1 → 96.9 and 90.7 µg/mLibuprofen amorphous solubility with dissolved HPMC and PVP-VAueda2020b R1
77 vs 5 wt%PVPVA in PHPH against MePHPH nanoparticles, whose limits are 5 and 40%deac2023b R3, R8
Evidence: data, conditions and papers

Finding F3. A component that mixes into the drug-rich phase lowers the ceiling of free drug, whether it is a second drug, a dissolved or undissolved polymer or a bile salt, and in the gel of a dissolving dispersion a polymer drawn into the drug-rich phase went with a lower limit of congruency

In short. With 10 µM lopinavir, paclitaxel or felodipine in solution ritonavir separated at about 14, 10 and 12 instead of about 26 µg/mL, while ionized diclofenac stayed out of the ritonavir-rich phase trasi2015a R7, R9, R11 (C F11), and dissolving ritonavir–lopinavir films and dispersions gave five of six mixed values within 0.5 µg/mL of C_{max} = S_a\,x_d trasi2015b R5, E1 (B F11). Dissolved HPMC and PVP-VA lowered the amorphous solubility of ibuprofen from 177.1 to 96.9 and 90.7 µg/mL with its crystalline solubility unchanged ueda2020b R1 (C F19), polymers that entered enzalutamide droplets lowered the dissolved drug from 42 to about 20–37 µg/mL, and taurocholate lowered the amorphous solubility of atazanavir from 65 to 38 µg/mL wilson2021 R8; indulkar2018 R6 (D F19). An undissolved polymer mixed with lopinavir held it below its 17.4 µg/mL amorphous solubility, at 15% drug at ≈0.3–4.3 µg/mL li2018 R3, R1 (B F18). In the release chapter phenolphthalein carried about 77 wt% PVPVA into its drug-rich nanoparticles against about 5 wt% for its methyl ether, PVPVA lowered its amorphous solubility from 200 to 27.5 µg/mL, and the order of four analogues was the reverse of their limits of congruency deac2023b R3, R8, R1 (A F27); measured drug–PVPVA–water diagrams placed their critical points (about 33, 33, 14 and 4%) in the order of the limits (40, 30, 10 and 5%) deac2024b R37 (A F30).

Type. cross-chapter synthesis of 12 chapter findings (two-drug mixtures, dissolved and undissolved polymers, bile salts, drug-rich nanoparticles and phase diagrams; ritonavir, lopinavir, ibuprofen, enzalutamide, atazanavir and four phenolphthalein analogues) Strength. for the lowering itself, measured by fluorescence, ultracentrifugation, flux or NMR in each chapter (C F11, C F19, B F11); moderate for the link to the limit of congruency, which rests on cited limits and a rank order of four analogues (A F27, A F30); danazol is a counterexample (D F22).

How it was shown

Trasi and Taylor (2015) added ritonavir to pyrene solutions with 5–20 µM lopinavir, paclitaxel or felodipine and measured the flux of binary donors trasi2015a P3, P7, P6. Ueda and co-workers (2020–2021) read by NMR how much dissolved polymer entered the drug-rich phase of ibuprofen ueda2020b P1, P2, P3, P4; ueda2021 A1, A2, A3. Li and Taylor (2018) stirred lopinavir films in pH 3 buffer, where the enteric polymers stay undissolved, and Deac and co-workers (2023) measured PVPVA in drug-rich nanoparticles of four phenolphthalein analogues li2018 P4, P5, P14; deac2023b P1, P2, P8, P9.

What the data show

NMR showed the HPMC and PVP-VA signals in solution falling to about 141 and 85 of 300 µg/mL once droplets formed, while cationic EUD-E stayed at about 289 µg/mL ueda2020b R13, R1.

systemmethod and conditionsresultids
ritonavir with lopinavir, paclitaxel, felodipine, diclofenacpyrene, ultracentrifugation, flux; pH 6.8, 25 °CLLPS about 26 → 10–14 µg/mL; ionized diclofenac stays in solutiontrasi2015a R7, R9, R11, R13
ibuprofen with 300 µg/mL HPMC, PVP-VA, EUD-Eonset of scattering; NMR177.1 → 96.9 and 90.7 µg/mL; EUD-E raised both solubilitiesueda2020b R1, R13
atazanavir with taurocholate; enzalutamide with polymersamorphous solubility; dissolved drug65 → 38 µg/mL; 42 → about 20–37 µg/mLindulkar2018 R6; wilson2021 R8
lopinavir films with HPMCAS, CAP, EC, HPMCP at 15–85%pH 3, 25 °C, 48 hbelow 17.4 µg/mL, lowest at 15% drug (≈0.3–4.3 µg/mL)li2018 R3, R1
PHPH, TIPP, MeTIPP, MePHPH with PVPVAdrug-rich nanoparticles; measured phase diagramsabout 77, 36.5, 9, 5 wt% PVPVA, reverse of limits 5, 10, 30, 40%; critical points in the order of the limitsdeac2023b R3, R8; deac2024b R37
Fig. 7 of deac2023b: cited limit of congruency against PVPVA in the drug nanoparticles, ordered by interaction strength
Fig. 7 · deac2023bcited limit of congruency against PVPVA in the drug nanoparticles, ordered by interaction strength

The analogue whose drug-rich nanoparticles hold the most PVPVA has the lowest limit of congruency, and the order runs through all four deac2023b R3, R8.

Why

With ideal mixing each drug's chemical potential falls by RT\ln x, so S_a(x_1) = S_a^\circ x_1 ("suggests"), and ionic charge keeps diclofenac anions out of the hydrophobic phase trasi2015a C37, E2, E3, E4, C35, C44. A large amount of HPMC and PVP-VA distributes into the droplets, which "leads to" the reduction because the polymer dilutes the drug there ueda2020b C32, C33. In the release chapter the phenols are read as drawing PVPVA in by hydrogen bonding, so that their polymer-rich drug phase becomes the majority at a lower loading ("are hypothesized") deac2023b C43, C45, C46, C48, C63.

Limits and transfer

Mixing is only approximately ideal trasi2015a X9, and release was not measured in the 2023 and 2024 papers, whose limits are cited deac2023b X6, X14; deac2024b X9, X5. Three polymers at 1–1000 µg/mL did not move the danazol onset jackson2016 R8, R9. Measure the amorphous solubility with the dispersion polymer dissolved at 150–300 µg/mL or more ueda2020b P3, P4, X5.

How it was shown

Trasi and Taylor (2015) added ritonavir to pyrene solutions with 5–20 µM lopinavir, paclitaxel or felodipine, added lopinavir or diclofenac to a pre-formed ritonavir-rich phase before ultracentrifugation, and measured the flux of binary donors trasi2015a P3, P7, P8, P9, P10, P6 (C F11); in a companion paper they dissolved drug-only films of ritonavir, lopinavir and their 7:3, 5:5 and 3:7 mixtures, and 20% total-drug dispersions in PVP and HPMCAS trasi2015b P2, P6, P1, P9 (B F11). Raina and co-workers (2015) measured by NMR how much polymer went into the felodipine precipitate and how much stayed in the water raina2015b P8, R12 (D F26). Jackson and co-workers (2016) read the danazol onset and the maximum flux with 1–1000 µg/mL PVP, HPMC or HPMC-AS in the buffer jackson2016 M9, P4, P5, P9 (D F22). Li and Taylor (2018) cast lopinavir films with seven polymers at 15–85% drug, stirred them in pH 3 buffer where the enteric polymers stay undissolved, and compared them with a physical mixture of amorphous lopinavir and HPMCAS li2018 P4, P5, P14 (B F18). Ueda and co-workers (2020–2022) measured the crystalline and amorphous solubility of ibuprofen in buffer and polymer solutions and read by NMR how much polymer entered its drug-rich phase, at several polymer levels and from 15 to 60 °C ueda2020b P1, P2, P3, P4; ueda2021 A1, A2, A3; ueda2022 P3, P4, R3 (C F19, C F20, C F21). Wilson and co-workers (2021) measured the polymer content of enzalutamide droplets by NMR depletion wilson2021 R7, R8 (D F37). In the release chapter Deac and co-workers made drug-rich nanoparticles of four phenolphthalein analogues in buffer containing PVPVA and measured the polymer in them (2023), and equilibrated dispersions with buffer and analysed both phases, fitting PC-SAFT diagrams (2024) deac2023b P1, P2, P8, P9; deac2024b P4, P7, P3, P19, P20 (A F27, A F30).

What the data show

Second drug. In 30 + 30 µg/mL mixtures free ritonavir was 9.3 µg/mL with paclitaxel and 13.2 µg/mL with lopinavir by flux, the flux of both drugs fell, and lopinavir added to a ritonavir-rich phase left only about a third in the bulk trasi2015a R13, R12, R9 (C F11). From films ritonavir reached 22.9 µg/mL alone and 15.2, 11.4 and 6.3 µg/mL at 7:3, 5:5 and 3:7 RTV:LPV, two single-drug dispersions added together gave about the 5:5 values, and mixed drug-rich phases did not crystallize within 5 h whereas lopinavir alone crystallized between 1 and 2 h trasi2015b R5, R11, R9, R15 (B F11). Dissolved polymer. NMR showed the HPMC and PVP-VA signals in solution falling to about 141 and 85 of 300 µg/mL once droplets formed, while cationic EUD-E stayed at about 289 µg/mL and raised both solubilities ueda2020b R13, R1 (C F19). The polymer:drug weight ratio in the drug-rich phase was about 0.40 (PVP K12) to 1.14 (HPMC 615), and at equal polymer content PVP-VA lowered the dissolved drug more than HPMC 603 ueda2021 R5, R11 (C F20). Between 15 and 60 °C the ratio rose, for HPMC from about 0.20 to 1.46, and the amorphous solubility in HPMC solution fell from about 0.86 to 0.52 of that in buffer ueda2022 R10, R17 (C F21). Undissolved polymer. At 85% drug the lopinavir films reached ≈10.5–15.7 µg/mL, phase-separated CA and EUD films ≈12.8–17.0, a physical mixture ≈17–18.5 and HPMC films ≈17.5–19 µg/mL li2018 R3, R8, R14 (B F18). In the gel. PVPVA left 10% PHPH and 70% MePHPH particles but entered 50% PHPH particles deac2023b R4, R5 (A F27); in the measured diagrams the PHPH-rich phase held 41.9–52.2 wt% PVPVA and the MePHPH-rich phase 13.7–2.5 wt%, and along a hydration path the drug-rich fraction of MePHPH jumped from about 0.15 at 27% to about 0.82 at 39.5% loading deac2024b R15, R17, R35 (A F30). Indomethacin and two phenols that hydrogen-bond to PVPVA had limits of 10, 5 and 10% against at least 25, 30 and 40% for analogues that cannot saboo2020 R3; que2021 R7, R19 (A F17).

chapter findingsystemmethod and conditionsresultids
C F11ritonavir with lopinavir, paclitaxel, felodipine, diclofenacpyrene, ultracentrifugation, flux; pH 6.8, 25 °CLLPS about 26 → 10–14 µg/mL; ionized diclofenac stays in solutiontrasi2015a R7, R9, R11, R13
B F11ritonavir–lopinavir films and PVP or HPMCAS dispersionsdissolution, ultracentrifugationfive of six mixed values within 0.5 µg/mL of ideal mixingtrasi2015b R5, E1, R13
C F19ibuprofen with 300 µg/mL HPMC, PVP-VA, EUD-Eonset of scattering; NMR177.1 → 96.9 and 90.7 µg/mL; EUD-E raised both solubilitiesueda2020b R1, R13
C F20ibuprofen with six polymersNMR, 1000 µg/mL polymerpolymer:drug 0.40–1.14 in the drug-rich phaseueda2021 R5, R11
C F21ibuprofen with PVP, PVP-VA, HPMCNMR, 15–60 °Cratio rises with temperature; Sa/Sa0 for HPMC 0.86 → 0.52ueda2022 R10, R17
D F19atazanavir with taurocholate; enzalutamide with polymersamorphous solubility; dissolved drug65 → 38 µg/mL; 42 → about 20–37 µg/mLindulkar2018 R6; wilson2021 R8
D F22danazol with PVP, HPMC, HPMC-AS 1–1000 µg/mLfour onset methods, fluxonset 7–9.1 µg/mL, maximum flux not loweredjackson2016 R8, R9
B F18lopinavir films with HPMCAS, CAP, EC, HPMCP at 15–85%pH 3, 25 °C, 48 hbelow 17.4 µg/mL, lowest at 15% drug (≈0.3–4.3 µg/mL)li2018 R3, R1
A F27PHPH, TIPP, MeTIPP, MePHPH with PVPVAdrug-rich nanoparticles, NMR and HPLCabout 77, 36.5, 9, 5 wt% PVPVA, reverse of limits 5, 10, 30, 40%deac2023b R3, R8
A F30four analogues in PVPVAmeasured and PC-SAFT phase diagramscritical points about 33.2, 32.6, 13.7, 3.7% against limits 40, 30, 10, 5%deac2024b R37, R35
A F17indomethacin and its ester; four phenolphthalein analoguesconstant-area compacts in PVPVAhydrogen-bonding drugs 5–10%, analogues 25–40%saboo2020 R3; que2021 R7, R19

Figure

Fig. 7 of deac2023b: cited limit of congruency against PVPVA in the drug nanoparticles, ordered by interaction strength
Fig. 7 · deac2023bcited limit of congruency against PVPVA in the drug nanoparticles, ordered by interaction strength
The analogue whose drug-rich nanoparticles hold the most PVPVA has the lowest limit of congruency, and the order runs through all four deac2023b R3, R8 (A F27).

Why

Amorphous drugs are liquid-like and can mix; with ideal mixing each drug's chemical potential falls by RT\ln x, so S_a(x_1) = S_a^\circ x_1 ("suggests"), and ionic charge keeps diclofenac anions out of the hydrophobic phase trasi2015a C37, E2, E3, E4, C35, C44 (C F11). A large amount of HPMC and PVP-VA distributes into the droplets, which "leads to" the reduction because the polymer dilutes the drug there; the unchanged crystalline solubility shows that the polymers do not solubilize it ueda2020b C32, C33, C11 (C F19). For undissolved polymers Li and Taylor argue the same way: mixing with a polymer and taking up water lower the drug's chemical potential relative to the pure amorphous phase, as long as the dispersion stays one phase, and they apply the Flory–Huggins term \Delta\mu_{drug}/RT = \ln\Phi_{drug} + (1 - 1/r)\Phi_{poly} + \chi\Phi_{poly}^{2} only "in a qualitative manner" li2018 C43, C44, C45, E4, C46 (B F18). In the release chapter the phenols are read as drawing PVPVA in by hydrogen bonding, so that their polymer-rich drug phase becomes the majority, and connects, at a lower loading ("are hypothesized") deac2023b C43, C45, C46, C48, C63 (A F27); the critical point of the measured diagram is proposed as a "surrogate" for the limit deac2024b C64 (A F30). (synthesis: the four chapters measure the same quantity, the activity of drug in a drug-rich phase that also holds something else; in solution that lowers the ceiling of free drug, and in the hydrating gel the same uptake of polymer enlarges the drug-rich phase, which F7 links to the loss of congruent release.)

Conditions and limits

Mixing is only approximately ideal: ritonavir's points lie 2–4 µg/mL above the line trasi2015a X9 (C F11). The polymer results for ibuprofen are one drug in pH 2.0 phosphate in D2O, with dissolved polymers rather than dissolving dispersions ueda2020b X6, M7, X5 (C F19). Several lopinavir curves were still rising between 3 and 48 h, so part of the suppression may be slow release li2018 X4, X5 (B F18). Release was not measured in the 2023 drug-load paper or the 2024 phase-diagram paper, whose limits are cited, and for PHPH the predicted inversion misses the film switch three- to fourfold deac2023b X6, X14; deac2024b X9, X5 (A F27, A F30).

Counterexamples and conflicts

Three polymers at 1–1000 µg/mL did not move the danazol onset or lower its maximum flux, which the authors read as "significant amounts of polymer do not mix with the danazol-rich phase" jackson2016 R8, R9, C38, C41 (D F22). How much polymer enters the droplets did not rank crystallization inhibitors: Eudragit E PO made up about 41 w/w% of enzalutamide droplets and inhibited worst, while HPMCAS-H, the grade that entered posaconazole droplets most, inhibited best wilson2021 R7, R3; shah2025 R17, R3 (D F37). In the release chapter hydrogen bonding did not predict the limit in a consistent direction: for ledipasvir the levelling of drug–polymer bonding near the limit "may be coincidental", and for felodipine the strongest bonding went with the lowest limits que2019 R25, C43, C45; saboo2020a R24, R15, C48 (A F10). The analogue pairs differ also in Tg and drug–drug bonding que2021 X12, C44; saboo2020 X6 (A F17).

Transfer check

For co-dosed drugs, ultracentrifuge a mixture at the intended ratio; the drug present in the smaller molar amount loses most trasi2015a P8, P12, E4, C50 (C F11). Measure the amorphous solubility with the dispersion polymer dissolved at 150–300 µg/mL or more ueda2020b P3, P4, X5 (C F19); for an enteric or insoluble polymer, measure the drug at two or three loadings where the polymer stays undissolved, for 48 h and against a physical mixture li2018 P5, P14, C56, C35 (B F18). Make drug-rich nanoparticles of the candidate in buffer with 0.5 mg/mL polymer: a polymer-rich particle phase or a large drop in amorphous solubility flags an associative system, for which these papers predict a low limit of congruency deac2023b P1, P2, R1, C65 (A F27).

History

2015: Trasi and Taylor showed that a second unionized drug lowers the amorphous solubility of the first and fitted ideal mixing trasi2015a R7, R16, E4 (C F11), and carried it to dissolving films and dispersions trasi2015b R5, R13 (B F11); Raina and co-workers found effective polymers in both the precipitate and the water raina2015b R12 (D F26). 2016: danazol showed no polymer effect on the onset jackson2016 R8 (D F22). 2018: Li and Taylor found undissolved polymers that lower the maximum below the amorphous solubility li2018 R3 (B F18), and Indulkar and co-workers found taurocholate lowering that of atazanavir indulkar2018 R6 (D F19). 2020–2022: Ueda and co-workers measured polymer uptake into the drug-rich phase by NMR, its dependence on polymer type and amount and its rise with temperature ueda2020b R1, R13; ueda2021 R5; ueda2022 R10 (C F19, C F20, C F21). 2021: Wilson and co-workers separated polymer uptake from inhibition wilson2021 R7, R3 (D F37). 2020–2021: the release chapter found lower limits for hydrogen-bonding drugs saboo2020 R3; que2021 R7, R19 (A F17), and 2023–2024 traced them to the polymer in the drug-rich phase and to the critical point deac2023b R3, R8; deac2024b R37 (A F27, A F30).

Topic 2 of 5 · 3 findings · F4–F6

Loss of supersaturation by crystallization

F4

Topic 2Loss of supersaturation by crystallization1 of 3

Polymers delay nucleation far more than growth, so crystals already present remove most of their protection.

In solution 1 µg/mL HPMC slowed felodipine growth 1.6-fold but nucleation about 1,400-fold alonzo2012 R5, R16, R17. Crystals that were already there bypassed this: HPMCAS held unseeded paclitaxel for more than 16 h, but seeded runs fell to 7.9–25.3 µg/mL que2018 R3, R13, R14, and delamanid dispersions released incompletely "once any level of residual crystallinity could be detected" duong2022a R14, R15, C56. Crystals that formed in the wetted solid escaped a polymer dissolved in the medium xie2016a R9, R10, C31.

strongStrong for the contrast between nucleation and growth inhibition and for the loss of protection with seeds, measured with seeded and unseeded runs in several drugs; moderate for crystals formed in the wetted solid, seen directly in some systems and inferred in others alonzo2012 R5, R17; xie2016a R12, R13, R9, R10; que2018 R13.

Slowing by a dissolved polymer, fold (log scale)felodipine · growth1 µg/mL HPMC1.6×felodipine · nucleation1 µg/mL HPMCabout 1,400×celecoxib · growth5 µg/mL HPMCASabout 70×celecoxib · nucleation5 µg/mL HPMCASabout 4000×

In both drugs the polymer acts far more on the formation of nuclei than on growth of crystals already present. alonzo2012 R5, R16, R17; xie2016a R12, R13, C40

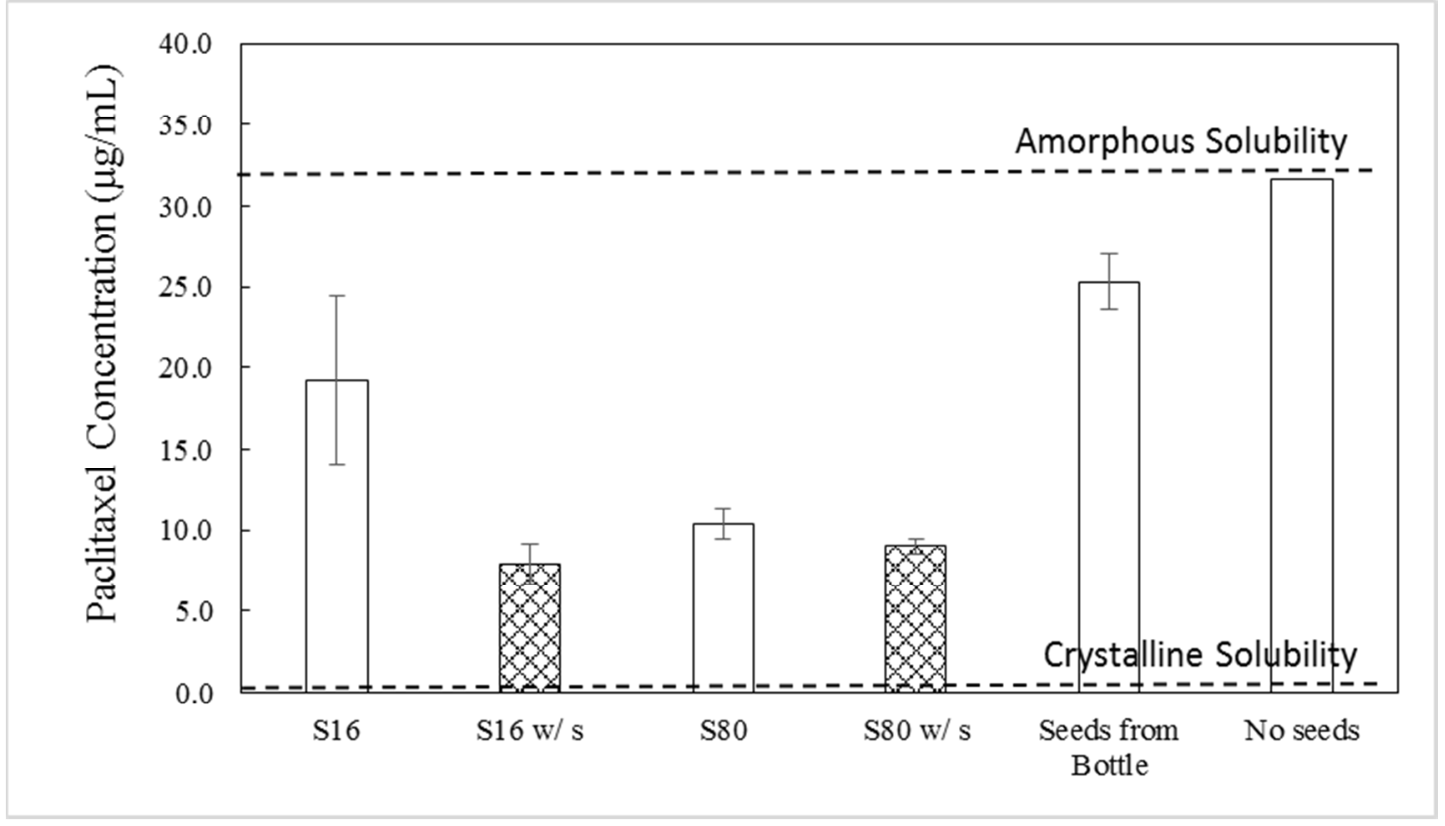
unseededseeded, 18 wt% seedsno seeds≈31.6bulk API seeds≈25.3long needles≈10.4≈19.2sonicated needles≈7.9≈9.005101520253035paclitaxel left in solution after 16 h, µg/mL (HPLC)

A 49/51 paclitaxel–HPMCAS film dissolved into buffer or into seed suspensions; the start was about 88 times the crystalline solubility. que2018 R1, R2, R13, R14

For your drug

  1. Measure nucleation (unseeded induction time) and growth (seeded slope) separately for each candidate polymer, at the supersaturation the dispersion will reach.
  2. Check every dispersion for residual crystals by a sensitive method before release testing, and slurry it to look for crystals in the particles and on the dissolving surface; an inhibitor in the medium is no substitute for one in the solid.

alonzo2012 P4, P5, P10; duong2022a R3, R2, C56; xie2016a C31, C54

How it works and key numbers
  1. Alonzo and co-workers call the effect of HPMC on nucleation "much more pronounced" than on growth, and conclude that preventing crystals altogether "would be the only effective method" alonzo2012 C46, C41, C44, C45.
  2. Ilevbare and co-workers propose that nucleation inhibition needs a polymer with more affinity for the solute than for water or itself, whereas growth inhibition needs adsorption on a crystal face; neither was measured ilevbare2013c C4, C5, C40, X14.
  3. On a seed, a two-dimensional nucleus of critical radius \rho_c = \gamma a/(kT\ln S), 5–7 nm at S = 88, fits between adsorbed chains about 10.5–16.8 nm apart, so growth continues que2018 C13, E2, C38, R12.
  4. Crystallization in the wetted matrix is something HPMCAS in solution "cannot influence", so the inhibitor has to stay in contact with the drug during hydration xie2016a C31, C33, C54.
  5. (synthesis: any route that supplies crystal surface, seeds, residual crystals or crystals formed in the solid before the polymer is in contact, bypasses the step the polymer controls alonzo2012 C41; xie2016a C31.)
To feel the numbers. For felodipine with HPMC the polymer acted about 1,400 ÷ 1.6 ≈ 875 times more strongly on nucleation than on growth.
1.6× vs about 1,400×felodipine growth against nucleation slowed by 1 µg/mL HPMCalonzo2012 R5, R16, R17
0.4 µg/mL160 nm posaconazole seeds that removed the induction period at the amorphous solubilityduong2022b R13, M2
≈2 and ≈20 of 100 µg/mLrelease of 25% delamanid dispersions with residual crystals (HPMCAS, HPMCP)duong2022a R14, R15, R8
Evidence: data, conditions and papers

Finding F4. Polymers held supersaturation mainly by delaying nucleation, so crystals that were already present, or that formed in the wetted solid, removed most of that protection: seeds, residual crystallinity, crystals in particles and crystals on a dissolving surface

In short. In solution 1 µg/mL HPMC slowed felodipine growth 1.6-fold but nucleation about 1,400-fold alonzo2012 R5, R16, R17 (D F6), and 5 µg/mL HPMCAS slowed celecoxib growth about 70-fold but nucleation an estimated ~4000-fold xie2016a R12, R13, C40 (B F5). The same polymers did not hold a solution that contained crystals: seeded felodipine with HPMC fell from about 5.1 to 2.2 µg/mL within 58 min while the unseeded solution held alonzo2012 R18 (D F20), HPMCAS held unseeded paclitaxel at S ≈88 for more than 16 h but seeds left 7.9–25.3 µg/mL que2018 R3, R13, R14 (B F22), and residual crystals in delamanid dispersions left release incomplete "once any level of residual crystallinity could be detected" duong2022a R14, R15, C56 (B F23). Crystals that formed in the wetted solid escaped a polymer dissolved in the medium: wetted nifedipine and celecoxib crystallized with or without it raina2014b C11, R2; xie2015 R9, R10 (B F2), PAA dispersions released only about half their celecoxib while HPMCAS in the medium held the dissolved drug xie2016a R9, R10, C31 (B F16), and crystals on the dissolving surface of indomethacin methyl ester compacts ended congruent release with 1000 µg/mL HPMC-606 in the medium saboo2020 R8, R9, R22, C36, C37 (A F19).

Type. cross-chapter synthesis of 12 chapter findings (seeded and unseeded solutions, slurries of wetted amorphous solids and dispersions, seeded dispersion dissolution, dispersions with residual crystals, dissolving compacts; felodipine, celecoxib, ritonavir, acetaminophen, paclitaxel, nifedipine, delamanid, posaconazole, indomethacin methyl ester) Strength. for the contrast between nucleation and growth inhibition, measured with seeded and unseeded runs in several drugs (D F6, B F5) and for the loss of protection with seeds (D F20, B F22); moderate for crystals formed in the wetted solid, which are seen directly in some systems and inferred in others (B F16).

How it was shown

Alonzo and co-workers (2012) ran seeded and unseeded felodipine solutions with 1 µg/mL HPMC and combined them into a relative nucleation rate J/J_0 alonzo2012 P4, P5, P10, E9, E10. Slurries of amorphous drugs were followed by in situ Raman with and without polymer in the buffer alonzo2010 P1, P2, P3, P5; xie2015 P3, P7, and Saboo and co-workers (2020) dissolved indomethacin methyl ester compacts with HPMC-606 in the medium saboo2020 P6, P8, P9.

What the data show

Growth inhibition weakened as supersaturation rose, CAP Adp 0.85 from 6.4-fold at S 3.8 to 1.6-fold at S 15.3, the amorphous solubility ilevbare2012b R5. With 5 µg/mL HPMC or HPMCAS wetted celecoxib formed no crystals in the liquid but crystallized on its particles within 5–20 min xie2015 R9, R10, R7.

systemmethod and conditionsresultids
felodipine, 1 µg/mL HPMC, S 10seeded and unseeded runs, 25 °Cgrowth 0.607 of the polymer-free rate; nucleation ratio 7.05 × 10⁻⁴alonzo2012 R5, R16, R17
posaconazole, 0.04–20 µg/mL of 160 nm seedsseeds added before supersaturation0.4 µg/mL seeds removed the induction periodduong2022b R13, M2
paclitaxel–HPMCAS 49/51, five seed types at 18 wt%16 h, UV and HPLCunseeded ≈31.6; seeded ≈7.9–25.3 µg/mL by growth areaque2018 R1, R2, R13, R14
delamanid–HPMCAS and –HPMCP, 10–25%rotary evaporation, PXRD, pH 6.5 releasecrystals from 15–20%; 25% released ≈2 and ≈20 µg/mL of 100duong2022a R8, R14, R15
INDester–PVPVA 10–25%compacts with 1000 µg/mL HPMC-606 in the medium; 15 °Cdrug release levelled off with surface crystals; congruent to 84–88% at 15 °Csaboo2020 R8, R9, R10, R22
Fig. 12 of que2018: residual paclitaxel concentration after 16 h by HPLC for each seed type
Fig. 12 · que2018residual paclitaxel concentration after 16 h by HPLC for each seed type

At equal seed mass the residual concentration falls from the unseeded level to about a quarter of it, in the order of the seeds' growth area rather than their mass que2018 R13, R14, R6.

Why

Alonzo and co-workers call the effect of HPMC on nucleation "much more pronounced" than on growth, so that preventing crystals altogether "would be the only effective method" alonzo2012 C46, C41, C44, C45. On seeds, a two-dimensional nucleus of critical radius 5–7 nm at S = 88 fits between adsorbed chains about 10.5–16.8 nm apart, so growth continues que2018 C13, C38, R12. HPMCAS in solution "cannot influence" matrix crystallization, so the inhibitor has to stay in contact with the drug during hydration xie2016a C31, C33, C54.

Limits and transfer

The contrast was shown at µg/mL polymer levels and in simple buffer alonzo2012 K6; with HPMCAS at 1 mg/mL growth inhibition can be strong moseson2021 R5. Measure nucleation and growth separately for each candidate polymer, at the supersaturation the dispersion will reach alonzo2012 P4, P5, P10, and check every dispersion for residual crystals by a sensitive method before release testing duong2022a R3, R2, C56.

How it was shown

Alonzo and co-workers (2010) followed slurries of amorphous felodipine and indomethacin by in situ Raman and polarized light, and Raina and co-workers (2014) and Xie and Taylor (2015) did so for nifedipine glass and dispersions and for neat amorphous celecoxib, with and without polymer dissolved in the buffer alonzo2010 P1, P2, P3, P5; raina2014b P6, P4; xie2015 P3, P7 (B F1); raina2014b P4, P6; xie2015 P7 (B F2). Alonzo and co-workers (2012) ran seeded and unseeded felodipine solutions at S 10 with 1 µg/mL HPMC and combined them into a relative nucleation rate J/J_0 alonzo2012 P4, P5, P10, E9, E10 (D F6). Trasi and co-workers (2015) fitted about 80 acetaminophen induction times per polymer with P(t) = 1 - \exp[-J V (t - t_g)], counted crystals in images and measured seeded growth trasi2015 P3, E5, P4, P5, P6 (D F27). Wegiel and co-workers (2015) and Xie and Taylor (2015, 2016) slurried dispersions with several polymers and dissolved PAA dispersions into buffer holding 5 µg/mL HPMCAS wegiel2015 P5, P7, A1, A2; xie2015 P3; xie2016a P6 (B F16), and Xie and Taylor compared seeded desupersaturation of celecoxib with unseeded induction times xie2016a P4, P11, P12 (B F5). Schram and co-workers (2016) grew felodipine seeds in four ways and measured their growth with 5 µg/mL HPMCAS schram2016 R2 (D F24). Que and co-workers (2018) dissolved a 49/51 paclitaxel–HPMCAS film into buffer or into suspensions of five seed types at 18 wt%, with UV for 16 h and HPLC of filtrates que2018 P6, P8, P9 (B F22). Elkhabaz and co-workers (2019) shifted posaconazole–HPMCAS dispersions from gastric to intestinal fluid at two doses and imaged crystals by SHG elkhabaz2019a P6, P4, P7, P8, P10 (B F26). Saboo and co-workers (2020) dissolved indomethacin methyl ester–PVPVA compacts with 1000 µg/mL HPMC-606 in the medium, examined the surfaces by XRD, polarized light, SEM and IR, and repeated the 25% compact at 15 °C saboo2020 P6, P8, P9, P13, P11, P7 (A F19). Duong and co-workers made delamanid dispersions by rotary evaporation and checked them by PXRD (2022), and Duong, Ni and Taylor (2022) added 0.04–20 µg/mL of 160 nm posaconazole crystals before creating supersaturation duong2022a P1, P2, P3, P4, P18, P8, P9 (B F23); duong2022b P9, M2 (D F20).

What the data show

Nucleation against growth in solution. For ritonavir at 5 µg/mL Pn-IPAAmd slowed seeded growth 3.25-fold but left the induction time at about 119 min, whereas CAB Adp 0.81 and CAP Adp 0.33, the best nucleation inhibitors, were only 2.7- and 1.6-fold growth inhibitors ilevbare2012c R9; ilevbare2013c R9 (D F6). Acetaminophen nucleation rates were 3820 (PAA), 1465 (none), 81.86 (HPMCAS) and 40.68 (HPMC) # m⁻³ s⁻¹, while seeded growth was slowed most by HPMC and PVP and not at all by PAA trasi2015 R1, R3, R11 (D F27). Growth inhibition also weakened as supersaturation rose, CAP Adp 0.85 from 6.4-fold at S 3.8 to 1.6-fold at S 15.3, the amorphous solubility ilevbare2012b R5 (D F9). Crystals already present. 0.4 µg/mL of 160 nm posaconazole crystals removed the induction period at the amorphous solubility, and with 2 and 20 µg/mL the concentration fell at once duong2022b R13, M2 (D F20). With paclitaxel the unseeded run still held ≈31.6 µg/mL at 16 h, while seeds left ≈25.3 (bulk API), ≈19.2 and ≈10.4 (long needles) and ≈9.0 and ≈7.9 µg/mL (sonicated needles), about 88 times the crystalline solubility at the start que2018 R1, R2, R13, R14 (B F22). Felodipine seeds crystallized from a dispersion with HPMCAS were slowed 12-fold by dissolved HPMCAS against 2.7-fold for buffer-grown seeds schram2016 R2 (D F24). Delamanid dispersions released ≈92–100 µg/mL of 100 at 10% drug but only ≈6 and ≈53 at 20% and ≈2 and ≈20 µg/mL at 25% (HPMCAS, HPMCP), where drug PXRD peaks appeared from 15–20% duong2022a R14, R15, R8 (B F23). With crystals present after the gastric stage, a posaconazole dispersion at ten times the amorphous solubility held ≈22–24 µg/mL to 120 min, a fifth of the dose lost it about an hour sooner, and the authors conclude that the onset of desupersaturation "does not represent the onset of crystallization" elkhabaz2019a R6, R12, R16, C49 (B F26). Crystals formed in the wetted solid. Neat felodipine at 37 °C was ≈54% crystalline at 1 min and dissolved no higher than the crystal alonzo2010 R2, R1 (B F1); with 5 µg/mL HPMC or HPMCAS wetted celecoxib formed no crystals in the liquid but crystallized on its particles within 5–20 min xie2015 R9, R10, R7 (B F2). Resveratrol dispersions needed 80% HPMC, 85% HPMCAS or 95% CMCAB to stop crystallization in the slurry wegiel2015 R9, R14 (B F16). INDester compacts released drug and polymer together at first and then drug release levelled off after 7.5–20 min, with Bragg peaks at 30 min, while at 15 °C the 25% compact released both to about 84–88% saboo2020 R8, R9, R10 (A F19).

chapter findingsystemmethod and conditionsresultids
D F6felodipine, 1 µg/mL HPMC, S 10seeded and unseeded runs, 25 °Cgrowth 0.607 of the polymer-free rate; nucleation ratio 7.05 × 10⁻⁴alonzo2012 R5, R16, R17
D F27acetaminophen, five polymers, S 1.5Poisson fit of induction times; seeded growthnucleation rate 3820 (PAA) to 40.68 (HPMC); PAA no growth effecttrasi2015 R1, R3, R11
B F5celecoxib, 5 µg/mL HPMCAS; paclitaxel, 20 µg/mL HPMCASseeded against unseededgrowth about 70-fold, nucleation about 4000-fold slower; unseeded paclitaxel more than 16 hxie2016a R12, R13; que2018 R3, R14
D F20felodipine with HPMC; posaconazoleseeded and unseeded; 0.04–20 µg/mL seedsseeded 5.1 → 2.2 µg/mL in 58 min; 0.4 µg/mL seeds removed the induction periodalonzo2012 R18; duong2022b R13, M2
B F22paclitaxel–HPMCAS 49/51, five seed types at 18 wt%16 h, UV and HPLCunseeded ≈31.6; seeded ≈7.9–25.3 µg/mL by growth areaque2018 R1, R2, R13, R14
D F24felodipine seeds made four waysgrowth with 5 µg/mL HPMCASeffectiveness about 2.7 (buffer seeds) to 12 (dispersion seeds)schram2016 R2
B F23delamanid–HPMCAS and –HPMCP, 10–25%rotary evaporation, PXRD, pH 6.5 releasecrystals from 15–20%; 25% released ≈2 and ≈20 µg/mL of 100duong2022a R8, R14, R15
B F26posaconazole–HPMCAS 10%, two dosesgastric then intestinal stage, SHGcrystals at transfer; lower dose lost the plateau about an hour soonerelkhabaz2019a R6, R12, R16
B F1neat amorphous felodipine, celecoxib, nifedipineslurry, in situ Raman, PLMcrystallized in the particles, dissolved no higher than the crystalalonzo2010 R2, R1; xie2015 R4, R8, R7; raina2014b R2, R6
B F2nifedipine, celecoxib with polymer in the mediumslurry with 1 mg/mL or 5 µg/mL polymeronset and route unchanged; celecoxib crystallized on its particlesraina2014b C11, R2; xie2015 R9, R10
B F16resveratrol, celecoxib–PAA, lopinavir dispersionsslurry Raman; dissolution with HPMCAS in the medium80–95% cellulosic needed; PAA released about half; crystals with CAP and EUDwegiel2015 R9, R14; xie2016a R9, R10; li2018 R7
A F19INDester–PVPVA 10–25%compacts with 1000 µg/mL HPMC-606 in the medium; 15 °Cdrug release levelled off with surface crystals; congruent to 84–88% at 15 °Csaboo2020 R8, R9, R10, R22

Figure

Fig. 12 of que2018: residual paclitaxel concentration after 16 h by HPLC for each seed type
Fig. 12 · que2018residual paclitaxel concentration after 16 h by HPLC for each seed type
At equal seed mass the residual concentration falls from the unseeded level to about a quarter of it, in the order of the seeds' growth area rather than their mass que2018 R13, R14, R6 (B F22).

Why

Alonzo and co-workers call the effect of HPMC on nucleation "much more pronounced" than on growth, and conclude that its ability to hold supersaturation by slowing growth is "still quite poor", so that preventing crystals altogether "would be the only effective method" alonzo2012 C46, C41 (D F6); alonzo2012 C44, C45 (D F20). Ilevbare and co-workers propose that nucleation inhibition needs a polymer with more affinity for the solute than for water or itself, whereas growth inhibition needs adsorption on a crystal face; neither was measured ilevbare2013c C4, C5, C40, X14 (D F6). On seeds, a two-dimensional nucleus of critical radius \rho_c = \gamma a/(kT\ln S), 5–7 nm at S = 88, fits between adsorbed chains about 10.5–16.8 nm apart, so growth continues que2018 C13, E2, C38, R12 (B F22). For the wetted solid, the hydrated felodipine at 37 °C is above its Tg and "presumably" crystallizes faster than it dissolves alonzo2010 C8, C33, C34 (B F1); matrix crystallization is something HPMCAS in solution "cannot influence", so the inhibitor has to stay in contact with the drug during hydration xie2016a C31, C33, C54 (B F16), and at a dissolving compact the polymer cannot prevent crystallization at the hydrated interface ("it is apparent") saboo2020 C37, C18 (A F19). For delamanid the residual crystals grow, in the hydrated matrix or after release ("Presumably"), and their growth competes with dissolution of the amorphous drug duong2022a C56, C57 (B F23). (synthesis: across the chapters a polymer acts on the step it was tested against: dissolved at µg/mL levels it raises the barrier to forming nuclei, but it slows growth on existing surfaces little at the supersaturation of an amorphous form; any route that supplies crystal surface, seeds, residual crystals or crystals formed in the solid before the polymer is in contact, bypasses the step the polymer controls.)

Conditions and limits

The contrast was shown at µg/mL polymer levels, 25–37 °C and in simple buffer with seeds grown without the polymer alonzo2012 K6; ilevbare2012b K6 (D F20). The celecoxib growth and nucleation ratios cannot be reproduced from the printed data and use an induction time capped at 960 min xie2016a K2, X8 (B F5). The paclitaxel seeds were one drug, one polymer and an 18 wt% seed load que2018 P8, P9, X7 (B F22). The slurries held 500–750 times less polymer per unit of solid than the dissolution tests alonzo2010 X5 (B F2), and crystallinity of the delamanid dispersions was not quantified duong2022a X10 (B F23).

Counterexamples and conflicts

At higher polymer levels growth inhibition can be strong (HPMCAS at 1 mg/mL: ratio 158) moseson2021 R5 (D F20), seeds that crystallized inside a felodipine–HPMCAS dispersion were slowed 12-fold, and monomeric STCDC kept telaprevir seeds from growing for 15 h schram2016 R2; lu2017a R10, R12 (D F20). The 2008 felodipine study read the polymer effect as growth inhibition, not nucleation konno2008a C28, C36, C25 (B F5). A dissolved polymer delayed crystallization of wetted amorphous felodipine (50% crystallinity after 13.5–20.5 min instead of within 1 min) alonzo2010 R6, R5 (B F2), and within dispersions the polymer kept the nifedipine matrix amorphous raina2014b R13, R15 (B F2). Some INDester still dissolved: 8.4–12.8% by 30 min at 15–25% loading against about 0.1–0.6% of indomethacin saboo2020 R6, R8 (A F19).

Transfer check

Measure nucleation (unseeded induction time) and growth (seeded slope) separately for each candidate polymer, at the supersaturation the dispersion will reach alonzo2012 P4, P5, P10 (D F6). Characterize residual crystals by habit and size as well as by weight percent, read the residual concentration by HPLC rather than UV, and do not assume a return to the crystalline solubility que2018 R6, C6, X4, C42 (B F22); check every dispersion for residual crystals by a sensitive method before release testing duong2022a R3, R2, C56 (B F23). Slurry the dispersion and look for crystals in the particles and on the dissolving surface; an inhibitor in the medium is no substitute for one in the solid xie2016a C31, C54 (B F16). If crystals are present at the start of an intestinal stage while the concentration still holds, do not read the time of the fall as an induction time elkhabaz2019a C49, R16 (B F26).

History

2008: Konno and co-workers read the plateau of felodipine with cellulosic polymers as inhibited growth konno2008a R16, C28 (B F5). 2010: Alonzo and co-workers separated crystallization in the wetted solid from crystallization in solution alonzo2010 R2, C32, C47 (B F1). 2012: Alonzo and co-workers separated growth from nucleation and found HPMC acting mainly on nucleation alonzo2012 R5, R17 (D F6), and Ilevbare and co-workers found growth on ritonavir seeds hard to stop at the amorphous solubility ilevbare2012b R5, R17 (D F20). 2013–2015: the nucleation and growth rankings of polymers diverged for ritonavir and acetaminophen ilevbare2013c R9; trasi2015 R3, R11 (D F6, D F27); Xie and Taylor found matrix crystallization in PAA dispersions that a dissolved inhibitor did not prevent xie2016a R9, R10, C31 (B F16). 2016: Schram and co-workers showed that the origin of seeds changes their response to HPMCAS schram2016 R2 (D F24). 2018: Que and co-workers showed that percent crystallinity "per se is not a predictive indicator" que2018 C54 (B F22). 2019: Elkhabaz and co-workers separated the onset of desupersaturation from the onset of crystallization elkhabaz2019a C49 (B F26). 2020: Saboo and co-workers found crystals ending congruent release on the dissolving surface saboo2020 R9, R22 (A F19). 2022: residual crystals in delamanid dispersions and 160 nm posaconazole seeds showed how little crystal is enough duong2022a C56; duong2022b R13 (B F23, D F20).

F5

Topic 2Loss of supersaturation by crystallization2 of 3

Drug-rich droplets hold free drug at the amorphous solubility, but crystallization came sooner with droplets present.

Ritonavir crystallized after about 284 min at 17 µg/mL, just below its LLPS concentration, and after 119.3 min at 20 µg/mL ilevbare2013d R16, R12, R10. Crossing the amorphous solubility of enzalutamide cut the induction time with 2.5 µg/mL HPMCAS from about 129 to 43 min wilson2021 R3. Small droplets alone did not delay crystallization: Tween 80 and several cellulose ethers kept ritonavir droplets at 178–395 nm yet cut the induction time to 23.6–59.5 min ilevbare2013d R12, R14.

strongStrong for faster crystallization above the amorphous solubility with enzalutamide, in triplicate with three polymers; weak to moderate for the ritonavir comparison, whose 17 µg/mL values carry no n or SD, and for the reservoir, which was not measured wilson2021 R3; ilevbare2013d K7, X18; elkhabaz2019a X8.

below the amorphous solubilityabove it, droplets presentHPMCAS43129P17773453Eudragit E PObelow: no crystals in 12 h910100200300400500enzalutamide induction time, min

For each polymer the induction time drops once the drug passes its amorphous solubility of 42 µg/mL, where droplets form. wilson2021 R3

additive at 5 µg/mLreference119.3HPMCAS, four cellulose estersdroplets about 200–350 nm146.0–242.8HPMCdroplets not kept small134.0Tween 80, cellulose ethersdroplets 178–395 nm23.6–59.5050100150200250ritonavir induction time at 20 µg/mL, min

Additives that kept droplets small both delayed and hastened crystallization; size stabilization and inhibition part. ilevbare2013d R12, R14

For your drug

  1. Measure the induction time with the intended polymer just below and just above the amorphous solubility; a large drop across it means that the droplets set the crystallization risk.
  2. Rank polymers by induction time with droplets present, not by droplet size, and set the in vitro dose relative to the amorphous solubility at the intestinal pH, with at least two doses.

wilson2021 P3, A1; ilevbare2013d P6, P3, C51; elkhabaz2019a P6, C50

How it works and key numbers
  1. If droplets and water are in equilibrium the supersaturation is the same in both, and by classical nucleation theory nucleation should then be favoured inside the droplets, where the drug is concentrated ("not unreasonable") ilevbare2013d C40, E1.
  2. Wilson and co-workers name the droplet–water interface as "likely" a highly favourable site for heterogeneous nucleation wilson2021 C3, C45, C46.
  3. Charged additives "in general" slowed coalescence, and every effective crystallization inhibitor except HPMC was also an effective size stabilizer, but not the reverse ilevbare2013d C37, C38, C51.
  4. The undissolved dispersion and the nanodroplets are proposed as a reservoir that replaces drug removed by crystal growth, used up sooner at the lower dose elkhabaz2019a C48.
  5. In the gel layer, PVP chains too short to entangle leave no "fishnet" to hold the droplets apart, and the low limit of the short grades "appears to be caused" by their agglomeration deac2024a C38, C26, C47.
To feel the numbers. Crossing the amorphous solubility shortened the enzalutamide induction time 129 ÷ 43 = 3 times with HPMCAS and 453 ÷ 73 ≈ 6 times with P177.
about 284 vs 119.3 minritonavir induction time at 17 and 20 µg/mL, just below and above the LLPS concentrationilevbare2013d R16, R12
129 → 43 minenzalutamide with HPMCAS across its amorphous solubilitywilson2021 R3
≈22–24 vs ≈8 µg/mLposaconazole at 120 min after the high and the low dose, crystals present in bothelkhabaz2019a R6, R12, R16
Evidence: data, conditions and papers

Finding F5. Above the amorphous solubility the drug-rich droplets act in two directions: they hold the free drug at the ceiling and can replace drug lost to crystals, but crystallization came sooner with them present, and keeping droplets small did not by itself delay crystallization

In short. Without polymer the drug-rich phase gave crystals within minutes for danazol (6–10 min) and telaprevir (about 15 min) jackson2014 R13, R17.a–c (D F4); mosqueragiraldo2015 R1; almeidaesousa2015 R1, R4 (C F3). Ritonavir crystallized after about 284 min at 17 µg/mL, just below its LLPS concentration, against 119.3 min at 20 µg/mL, and SDS and Tween 80 shortened the induction time only when droplets were present ilevbare2013d R16, R12, R10 (B F13); crossing enzalutamide's amorphous solubility cut the induction time with 2.5 µg/mL HPMCAS from about 129 to 43 min wilson2021 R3 (D F37). Droplet size and droplet life were set by the additive but were not the same property as inhibition: Tween 80 and several cellulose ethers kept ritonavir droplets at 178–395 nm yet cut the induction time to 23.6–59.5 min ilevbare2013d R12, R14 (B F12), and the polymer that loaded enzalutamide droplets most inhibited worst wilson2021 R7, R3 (D F37). With crystals present a posaconazole dispersion held its amorphous solubility only while undissolved dispersion and droplets remained, a reservoir the authors propose ("most likely") elkhabaz2019a R6, R12, C47, C48 (B F26). In the release chapter HPMCAS kept the droplets of elbasvir and loratadine small where PVPVA let them grow yang2021 R3, R6 (A F16), and with short PVP chains the droplets agglomerated in the gel layer and release failed deac2024a R7, R10 (A F29).

Type. cross-chapter synthesis of 11 chapter findings (solvent-shift solutions and dissolving dispersions and compacts; ritonavir, danazol, telaprevir, enzalutamide, posaconazole, ibuprofen, delamanid, elbasvir, loratadine, clotrimazole) Strength. for the faster crystallization above the amorphous solubility with enzalutamide, triplicate with three polymers (D F37); weak to moderate for the ritonavir comparison across the LLPS concentration, whose 17 µg/mL values carry no n or SD (B F13); weak to moderate for the reservoir, which was not measured (B F26).

How it was shown

Ilevbare and co-workers (2013) shifted ritonavir to 20 µg/mL, just above the LLPS concentration, with 15 additives at 5 µg/mL, read the induction time by extinction and droplet size by light scattering ilevbare2013d P6, P3, A7. Wilson and co-workers (2021) measured enzalutamide induction times below and above its amorphous solubility with three polymers wilson2021 P3, A1, P6, P7. Elkhabaz and co-workers (2019) dosed a posaconazole dispersion at ten times and at twice its amorphous solubility after a gastric stage elkhabaz2019a P6, P4.

What the data show

Needles appeared among the ritonavir droplets in SEM from about 90 min with PVP alone and from 30 min with Tween 80 ilevbare2013d R4, R7. Delamanid droplets stayed at ≈430–440 and ≈595–600 nm with HPMCP and HPMCAS for 3 h, but grew to ≈1050–6200 nm within 30–60 min with HPMC and Eudragit L100 as crystals formed duong2022a R7, R5.

systemmethod and conditionsresultids
enzalutamide with HPMCAS, P177, Eudragit E POinduction time below and above 42 µg/mL; NMR depletion129 → 43, 453 → 73 min; Eudragit 41 w/w% in droplets, worst inhibitorwilson2021 R3, R7
ritonavir, 15 additives at 20 µg/mLinduction time and droplet sizeHPMCAS and four cellulose esters: droplets about 200–350 nm, 119.3 → 146.0–242.8 min; PVP, PVPVA, PAA and SDS stabilized neitherilevbare2013d R12, R14
danazol with PVP, HPMC, HPMC-ASDLS, zeta potential, induction timedroplets 230–345 nm for 2–4 h with HPMC and HPMC-AS; induction 6–10 min → hoursjackson2014 R1, R22, R23, R17
telaprevir, six bile salts at δ 11.5 and 28.8induction timeat 28.8 buffer immediate, bile salts 30 to more than 960 min, order changedlu2017 R4, R3
posaconazole–HPMCAS 10%, two dosesgastric then intestinal stage, SHG, NTAhigh dose held ≈22–24 µg/mL to 120 min; lower dose fell to ≈8 µg/mLelkhabaz2019a R6, R12, R16
Fig. 3 of wilson2021: enzalutamide induction times with HPMCAS (a), Eudragit E PO (b) and P177 (c) at increasing drug concentration
Fig. 3 · wilson2021enzalutamide induction times with HPMCAS (a), Eudragit E PO (b) and P177 (c) at increasing drug concentration

For each polymer the induction time drops sharply once the drug concentration passes the amorphous solubility of 42 µg/mL, where droplets form wilson2021 R3.

Why

By classical nucleation theory nucleation should be favoured inside the droplets, where the drug is concentrated and the interfacial tension with an embryonic crystal is expected to be lower ("not unreasonable") ilevbare2013d C40, E1. Every effective crystallization inhibitor except HPMC was also an effective size stabilizer, but not the reverse ilevbare2013d C51. The reservoir is proposed to replace drug removed by crystal growth from undissolved dispersion and nanodroplets elkhabaz2019a C48.

Limits and transfer

The ritonavir phase lies inside the metastable zone with no crystals within 2 h at 34 µg/mL ilevbare2013a R8, R11, R12; for posaconazole no seeding test was run and the reservoir was not measured over time elkhabaz2019a X8, X3. Measure the induction time with the intended polymer just below and just above the amorphous solubility wilson2021 P3, A1, and rank polymers by induction time with droplets present ilevbare2013d P6, P3, C51.

How it was shown

Ilevbare and co-workers (2013) shifted ritonavir to 20 µg/mL, just above the LLPS concentration, with 15 additives at 5 µg/mL, read the induction time by extinction and droplet size by light scattering, repeated it at 17 µg/mL, and imaged dried samples of dissolving dispersions by SEM ilevbare2013d P6, P3, A7, P8 (B F12, B F13). Jackson and co-workers (2014, 2016) followed danazol droplets by UV extinction, pyrene, DLS, zeta potential and three induction-time read-outs with PVP, HPMC or HPMC-AS jackson2014 P1, P6, P7, P8, P9; jackson2016 P10, P11, P12 (D F15). Mosquera-Giraldo and Taylor (2015) watched the telaprevir drug-rich phase with and without polymer mosqueragiraldo2015 P12, R1 (C F3). Lu and co-workers (2017) compared six bile salts at an activity-based supersaturation of 11.5 and at 28.8, just above the amorphous solubility lu2017 R3, R4 (D F32). Elkhabaz and co-workers (2019) dosed a posaconazole dispersion at ten times and at twice its amorphous solubility after a gastric stage, sized nanodroplets by tracking and imaged crystals by SHG elkhabaz2019a P6, P4, P7, P8, P10 (B F26). Ueda and Taylor (2020) followed ibuprofen droplets with and without polymers for 3 h by DLS, NMR and photographs ueda2020b P6, P5, P7, P8 (C F22). Wilson and co-workers (2021) measured enzalutamide induction times below (30–40 µg/mL) and above (45–120 µg/mL) its amorphous solubility with three polymers and the polymer in the droplets by NMR depletion wilson2021 P3, A1, P6, P7, E3 (D F37); Duong and co-workers (2022) followed delamanid droplets with five polymers for 3 h duong2022a P7, A2 (B F12). In the release chapter droplets released by dissolving dispersions were sized by DLS for up to 4 h yang2021 P16, A6; correasoto2022a P6, P7; indulkar2022 P7, P8 (A F16), and Deac and co-workers (2024) imaged clotrimazole droplets in humid films and at the edge of dissolving compacts with six PVP grades deac2024a M1, P5, P6, P10, P8 (A F29).

What the data show

Lifetime of the drug-rich phase. The ritonavir phase forms inside the metastable zone, 37.2 against 2.4 µg/mL crystalline solubility in water, with no crystals within 2 h at 34 µg/mL, whereas telaprevir without polymer gave birefringent particles after about 15 min and griseofulvin crystallized outright ilevbare2013a R8, R11, R12; mosqueragiraldo2015 R1; almeidaesousa2015 R1, R4 (C F3). Ibuprofen droplets in buffer left the dispersion within 1–2 h by creaming, not by crystallization, crystals appearing only after 24 h ueda2020b R15, R8, C17, C27 (C F3). Droplets and crystallization. Needles appeared among the ritonavir droplets in SEM from about 90 min with PVP alone and from 30 min with Tween 80 ilevbare2013d R4, R7 (B F13). With enzalutamide the cellulose ester P177 went from about 453 to 73 min and 50 µg/mL Eudragit E PO from no crystallization in 12 h to about 91 min across the amorphous solubility wilson2021 R3 (D F37). At δ 28.8 buffer crystallized at once and 1.86 mM bile salts spread from about 30 min (SGC) to more than 960 min (SGDC), an order different from the one at δ 11.5 lu2017 R4, R3 (D F32). Droplet size against inhibition. HPMCAS and four cellulose esters kept ritonavir droplets at about 200–350 nm and lengthened the induction time from 119.3 to 146.0–242.8 min, PVP, PVPVA, PAA and SDS stabilized neither, and HPMC only delayed crystallization (134.0 min) ilevbare2013d R12, R14 (B F12). HPMC and HPMC-AS kept danazol droplets at about 230–345 nm for 2–4 h instead of about 9800 nm in 1 h, and HPMC-AS made them more negative (−8.1 to −13.7 mV) jackson2014 R1, R22, R23 (D F15). Delamanid droplets stayed at ≈430–440 and ≈595–600 nm with HPMCP and HPMCAS for 3 h, grew slowly to ≈900 nm with PVPVA and to ≈1050–6200 nm within 30–60 min with HPMC and Eudragit L100 as crystals formed duong2022a R7, R5 (B F12). Over 3 h of stirring the droplet-phase ibuprofen fell from about 300 to 0 µg/mL in buffer, to 67 µg/mL with PVP-VA and to 173–183 µg/mL with HPMC and EUD-E ueda2020b R15 (C F22). Eudragit E PO made up about 41 w/w% of enzalutamide droplets against 13–25 w/w% for HPMCAS, yet only HPMCAS held 120 µg/mL enzalutamide for about 7–9 h wilson2021 R7, R8, R3.k, R3.l (D F37). Reservoir. After the gastric stage the 200 µg/mL dose of posaconazole dispersion held ≈22–24 µg/mL to 120 min, the 40 µg/mL dose reached ≈21 µg/mL but fell to ≈8 µg/mL by 120 min, and crystals were present in both from the acid stage elkhabaz2019a R6, R12, R16 (B F26). Droplets from dissolving compacts. Elbasvir droplets from PVPVA grew from about 670 to 1190 nm in 60 min and crystallized, those from HPMCAS stayed at about 280–390 nm, and danazol droplets grew to about 2780 nm even with dissolved HPMCAS yang2021 R3, R4, R5 (A F16). With PVP K12 clotrimazole droplets clustered into strands near the gel–solution boundary within 2 min and stayed in the gel, those of K29/32 stayed apart, and the limits of congruency were below 5% and about 33% deac2024a R7, R10, R1, R12 (A F29).

chapter findingsystemmethod and conditionsresultids
C F3ritonavir; telaprevir; griseofulvin; ibuprofenphase diagram; lifetimes with and without polymerno crystals in 2 h at 34 µg/mL; telaprevir crystals after about 15 min; ibuprofen droplets creamed in 1–2 hilevbare2013a R8, R11, R12; mosqueragiraldo2015 R1; ueda2020b R15, R8
D F4danazol, no polymerUV, pyrene, SHGdrug-rich phase, crystals within 6–10 minjackson2014 R13, R17.a–c
B F13ritonavir 17 and 20 µg/mL, with SDS or Tween 80solvent shift, extinction, 37 °Cabout 284 against 119.3 min; surfactants act only at 20 µg/mLilevbare2013d R16, R12, R10
D F37enzalutamide with HPMCAS, P177, Eudragit E POinduction time below and above 42 µg/mL; NMR depletion129 → 43, 453 → 73 min; Eudragit 41 w/w% in droplets, worst inhibitorwilson2021 R3, R7
B F12ritonavir, 15 additives; delamanid, 5 polymersinduction time and droplet sizesmall droplets with Tween 80 and ethers but 23.6–59.5 min; HPMCP and HPMCAS droplets stable for 3 hilevbare2013d R12, R14; duong2022a R7, R5
D F15danazol with PVP, HPMC, HPMC-ASDLS, zeta potential, induction timedroplets 230–345 nm for 2–4 h with HPMC and HPMC-AS; induction 6–10 min → hoursjackson2014 R1, R22, R23, R17
C F22ibuprofen with HPMC, PVP-VA, EUD-E3 h stirring, DLS, NMRdroplet-phase drug 300 → 0 in buffer, → 67 (PVP-VA), → 173–183 µg/mL (HPMC, EUD-E)ueda2020b R15, R5, R6
D F32telaprevir, six bile salts at δ 11.5 and 28.8induction timeat 28.8 buffer immediate, bile salts 30 to more than 960 min, order changedlu2017 R4, R3
B F26posaconazole–HPMCAS 10%, two dosesgastric then intestinal stage, SHG, NTAhigh dose held ≈22–24 µg/mL to 120 min; lower dose fell to ≈8 µg/mLelkhabaz2019a R6, R12, R16
A F16elbasvir, loratadine, danazol dispersionsDLS during releaseHPMCAS droplets about 250–570 nm; PVPVA 1190–2120 nm; danazol about 2780 nmyang2021 R3, R6, R4, R5
A F29clotrimazole in PVP K12 and K29/32humid films, edge of dissolving compactsK12 droplets in strands in the gel; limits below 5% and about 33%deac2024a R7, R10, R1, R12

Figure

Fig. 3 of wilson2021: enzalutamide induction times with HPMCAS (a), Eudragit E PO (b) and P177 (c) at increasing drug concentration
Fig. 3 · wilson2021enzalutamide induction times with HPMCAS (a), Eudragit E PO (b) and P177 (c) at increasing drug concentration
For each polymer the induction time drops sharply once the drug concentration passes the amorphous solubility of 42 µg/mL, where droplets form wilson2021 R3 (D F37).

Why

If droplets and water are in equilibrium the supersaturation is the same in both, and by classical nucleation theory nucleation should then be favoured inside the droplets, where the drug is concentrated and the interfacial tension with an embryonic crystal is expected to be lower ("not unreasonable") ilevbare2013d C40, E1 (B F13); Wilson and co-workers name the droplet–water interface as "likely" a highly favourable site for heterogeneous nucleation wilson2021 C3, C45, C46 (D F37). Charged additives "in general" slowed coalescence, "likely" by charge repulsion between polymers adsorbed at the interface, and every effective crystallization inhibitor except HPMC was also an effective size stabilizer, but not the reverse ilevbare2013d C37, C38, C51 (B F12). For danazol all three polymers interact with the droplet surface yet inhibit very differently, the difference "most likely" lying in interactions with danazol nuclei jackson2016 C37, C48, C49 (D F15); for enzalutamide droplet association "does not solely predict" inhibition, and an effective polymer is proposed to adopt an extended conformation at the interface wilson2021 C42, C38, C58, C55 (D F37). The reservoir is proposed to replace drug removed by crystal growth from undissolved dispersion and nanodroplets, used up sooner at the lower dose elkhabaz2019a C48 (B F26). In the gel, chains too short to entangle leave no "fishnet" to hold droplets apart, and the low limit of the short grades "appears to be caused" by their agglomeration deac2024a C38, C26, C47 (A F29). (synthesis: the droplets carry drug at the activity of the amorphous solubility, so as a reservoir they can only hold the ceiling, not raise it; at the same time they add a concentrated phase and an interface at which crystals start, so an inhibitor has to act at that interface, which droplet size alone does not show.)

Conditions and limits

The 17 µg/mL ritonavir values are single reported values without n or SD, and the bulk supersaturation also rose from about 13 to about 15 across the comparison ilevbare2013d K7, X18, M1 (B F13). The enzalutamide comparison of polymer loading was made at different drug totals and a colorimetric check did not reproduce the ranking wilson2021 X4, X5 (D F37). No seeding test was run for posaconazole, the reservoir was not measured over time, and micro-centrifuged supernatants may contain nanodroplets elkhabaz2019a X8, X3 (B F26). Agglomeration was imaged for K12 only, at a loading other than the one released deac2024a X7, X11 (A F29).

Counterexamples and conflicts

The ritonavir phase lies inside the metastable zone with no crystals within 2 h at 34 µg/mL, so there the drug-rich phase lasted hours ilevbare2013a R8, R11, R12 (C F3); ibuprofen droplets were lost by creaming rather than by crystallization ueda2020b R15, C17 (C F3). Ritonavir–lopinavir drug-rich phases holding both drugs did not crystallize within 5 h, whereas lopinavir alone crystallized between 1 and 2 h trasi2015b R15, C33, C34 (B F11). For posaconazole the HPMCAS grade that entered the droplets most delayed nucleation longest, the opposite of enzalutamide with Eudragit E PO shah2025 R17, R3 (D F37).

Transfer check

Measure the induction time with the intended polymer just below and just above the amorphous solubility; a large drop across it means the droplets set the crystallization risk wilson2021 P3, A1 (D F37). Measure droplet size over the expected residence time with each candidate polymer, but rank polymers by induction time with droplets present, since size stabilization and inhibition can part ilevbare2013d P6, P3, C51 (B F12). Set the in vitro dose relative to the amorphous solubility at the intestinal pH and run at least two doses elkhabaz2019a P6, C50 (B F26).

History

2013: Ilevbare and Taylor placed the ritonavir drug-rich phase inside the metastable zone ilevbare2013a R8, R11 (C F3), and Ilevbare and co-workers found that ritonavir crystallization "appears" to start in the drug-rich phase and that additives decide droplet size and life separately ilevbare2013d C39, C41, R12, R14 (B F13, B F12). 2014–2016: Jackson and co-workers found polymers keeping danazol droplets small and delaying crystallization jackson2014 R22, R23, R17; jackson2016 C48 (D F15). 2017: bile salts were ranked with a drug-rich phase present lu2017 R4 (D F32). 2019: Elkhabaz and co-workers proposed the reservoir of undissolved dispersion and droplets elkhabaz2019a C48 (B F26). 2020: Ueda and Taylor followed droplet coarsening and creaming by NMR ueda2020b R15 (C F22). 2021: Wilson and co-workers measured the drop in induction time across the amorphous solubility with three polymers wilson2021 R3 (D F37), and Yang and co-workers sized droplets from dissolving dispersions yang2021 R3, R6 (A F16). 2022: delamanid droplets were followed with five polymers duong2022a R7, R5 (B F12). 2024: Deac and co-workers saw droplets agglomerating in the gel of short-chain PVP compacts deac2024a R7, R10 (A F29).

F6

Topic 2Loss of supersaturation by crystallization3 of 3

Surfactants built into a dispersion raise the limit of congruency, yet speed nucleation or growth of the released drug.

Below their CMC, Tween 80 and TPGS made ritonavir crystals grow about twice as fast, and 0.1% SDS shortened the induction time of seven of nine drugs ilevbare2012a R17, R1.g, M17; chen2015 R3, C13, C17, C18. Built into the dispersion, 5 parts SDS per 100 raised the limit of congruency of ledipasvir–PVPVA from 5 to 30% que2019 R7, R8, R9, C12. In 30% ritonavir–PVPVA with 10 parts SDS release stopped near 70%, with needle crystals on the surface yang2023 R21, R13, R2, R16, R17.

strongStrong for each effect in its own test; the conflict is a synthesis of different tests, seen in one test only for ritonavir with SDS, and weak for every mechanism ilevbare2012a K6; saboo2021 K6; correasoto2022b K5.

drug and polymer onlysurfactant built inledipasvir + SDS530felodipine + TPGS1545clopidogrel + SDS4050atazanavir + Span 805150102030405060limit of congruency in PVPVA, % drug

Built into the dispersion the surfactant raised the limit; TPGS in the medium left a 30% felodipine dispersion at about 0.4% release. que2019 R7, R8; saboo2021 R12, R15; correasoto2022a R17, R18; correasoto2022b R2, R4

Celecoxib at S = 5: induction time, min (log scale)polysorbate 807Poloxamer 18812SDS41no surfactant88Triton X100273STC 0.75%more than 960

Three surfactants shortened the induction time; the bile salt STC lengthened it. chen2015a R12, C6

For your drug

  1. Before building a surfactant into a dispersion, measure induction time and seeded growth of the drug with the surfactant at the concentration the release will produce, below the CMC as well as above it.
  2. Screen the surfactant inside the dispersion across a loading series with drug and polymer assayed; after a gain in release, image the dissolving surface for crystals and follow the released concentration for at least 1–2 h.

ilevbare2012a P8, R17; indulkar2019b P4; saboo2021 R15, C35; yang2023 R16, C24

How it works and key numbers
  1. Below the CMC micellar solubilization is excluded, so TPGS and Tween 80 "appear" to act at the crystal–solution interface, where lowering of interfacial tension can outweigh the blocking of kink sites ilevbare2012a C51, C52, C53, C54.
  2. For atazanavir, SDS monomers are read as adsorbing on nuclei as hemimicelles that lower the crystal–water interfacial energy, a "supposition" supported by pyrene indulkar2019b C19, C32, C33, C35.
  3. In the release studies micellar solubilization is ruled out, because the medium stayed below the CMC and TPGS in the medium had no effect que2019 C51; saboo2021 C33, C18, C35.
  4. The authors offer that SDS "possibly" reduces the rate or tendency of phase separation, and for ritonavir they propose that preventing or disrupting a continuous drug-rich layer is the most critical surfactant effect que2019 C53; yang2023 C37, C9, C42.
  5. (synthesis: both effects act through the drug's interfaces at concentrations far below the CMC, so the same additive can open release and shorten the time the released supersaturation lasts yang2023 R16; ilevbare2012a R17.)
about 2×faster ritonavir crystal growth with 5 µg/mL Tween 80 or TPGS, below the CMCilevbare2012a R17, R1.g
5 → 30%ledipasvir–PVPVA limit of congruency with 5 parts SDS per 100que2019 R7, R8
about 70%release plateau of 30% ritonavir–PVPVA with 10 parts SDS, needle crystals on the surfaceyang2023 R2, R16, R17
Evidence: data, conditions and papers

Finding F6. The surfactants that raise the limit of congruency also promote crystallization: below their CMC SDS, polysorbate 80 and TPGS sped nucleation or growth, yet a few percent inside a PVPVA dispersion kept release congruent, and SDS at the dissolving surface brought crystals; sodium taurocholate slowed nucleation instead

In short. At 5 µg/mL, about a fifth of its CMC, Tween 80 and TPGS made ritonavir crystals grow about twice as fast and cancelled the inhibition by two cellulose esters ilevbare2012a R17, R1.g, M17 (D F18); 0.1% SDS shortened the induction time of seven of nine drugs while 0.1% sodium taurocholate (STC) lengthened it for all 11 tested chen2015 R3, C13, C17, C18 (D F28), and SDS acted on atazanavir from about a seventh of its CMC indulkar2019b R3, R1, R2, M2 (D F38). In dissolution tests SDS and polysorbate 80 brought crystals into celecoxib–HPMCAS suspensions at 0.5 and 1 h and cut the ritonavir induction time with droplets to 34.7 and 23.6 min chen2015a R14, R12; ilevbare2013d R12 (B F14). Inside the dispersion the same surfactants helped release: 5 parts SDS per 100 raised the ledipasvir–PVPVA limit of congruency from 5 to 30% que2019 R7, R8, R9, C12 (A F13), and TPGS, SDS and Span 80 raised the limits of felodipine (15 → 45%), clopidogrel (40 → 50%) and atazanavir (5 → 15%) saboo2021 R12; correasoto2022a R17, R18; correasoto2022b R2, R4 (A F21). In 30% ritonavir–PVPVA 10 parts SDS kept the gel in one phase but release stopped near 70% with needle crystals on the surface yang2023 R21, R13, R2, R16, R17 (A F31, A F19).

Type. cross-chapter synthesis of 10 chapter findings (seeded growth and induction times in solution, dispersion suspensions and droplets, compacts with built-in surfactant; ritonavir, celecoxib, atazanavir, felodipine, ledipasvir, clopidogrel and seven further drugs) Strength. for each effect in its own test (D F18, A F13, A F21); the conflict is a synthesis of different tests, and it was seen in one test only for ritonavir with SDS (A F31); weak for every mechanism (D F18, A F21).

How it was shown

Ilevbare and co-workers (2012) measured seeded growth of ritonavir with 5 µg/mL TPGS or Tween 80, below the critical micelle concentration ilevbare2012a P8, R17. Indulkar and co-workers (2019) dosed atazanavir at its amorphous solubility in 13 SDS levels indulkar2019b P1, P2, M2. The release chapter built surfactants into dispersions and dissolved compacts with drug and polymer assayed que2019 P1, P3, P9; saboo2021 P4, P6; yang2023 P1, P4.

What the data show

For atazanavir the induction time stayed at about 199–216 min up to 0.05 mg/mL SDS, fell to about 56 min by 0.3 mg/mL and stayed at about 52–68 min from the CMC to 3.6 mg/mL indulkar2019b R3, R4. In ritonavir–PVPVA SDS raised the water at which 30% films separated from 14.0 to 24.5%, but the SDS dispersions plateaued after about 30 min, with needles on the 30% surface yang2023 R21, R2, R16, R17.

systemmethod and conditionsresultids
ritonavir, 5 µg/mL TPGS or Tween 80, cellulose estersseeded growth, S 7.6, below the CMCgrowth about twice as fast; esters 1.64 and 2.97 → 0.70 and 0.83 with Tween 80ilevbare2012a R17, R1.g, M17
11 drugs, 0.1% STC or SDSmatched C/Ceq, induction timeSTC longer for all 11; SDS shorter for 7 of 9chen2015 R3, C13, C17, C18
celecoxib, S = 5, eight mediainduction time7–41 min with polysorbate 80, Poloxamer 188, SDS against 88; STC more than 960chen2015a R12, C6
ledipasvir–PVPVA with five surfactants, 5 per 100compacts, drug and polymer assayedSDS limit 5 → 30%; poloxamer 407 to 7.5%; Span 85, Tween 80, TPGS no gainque2019 R7, R8, R9, R3, C12
felodipine with TPGS; clopidogrel with SDS; atazanavir with eight additivescompacts; TPGS in the medium as controllimits 15 → 45%, 40 → 50%, 5 → 15%; TPGS in the medium no effectsaboo2021 R12, R15; correasoto2022a R17, R18; correasoto2022b R2, R4
Fig. 8 of ilevbare2012a: growth-inhibition ratio with surfactants, polymers and surfactant–polymer pairs
Fig. 8 · ilevbare2012agrowth-inhibition ratio with surfactants, polymers and surfactant–polymer pairs

The bars for TPGS and Tween 80 lie below 1, faster growth than without additive, and the bars of the esters fall when Tween 80 is added ilevbare2012a R17.

Why

Below the CMC micellar solubilization is excluded, so TPGS and Tween 80 "appear" to act at the crystal–solution interface ilevbare2012a C51, C52. For atazanavir, SDS monomers are read as adsorbing on nuclei as hemimicelles that lower the crystal–water interfacial energy, a "supposition" supported by pyrene indulkar2019b C19, C32, C33, C35. For ritonavir in PVPVA, preventing or disrupting a continuous drug-rich layer is proposed as the most critical surfactant effect yang2023 C37, C9, C42.

Limits and transfer

Crystallization of the released drug was not followed in most surfactant release studies (synthesis). Before building a surfactant into a dispersion, measure induction time and seeded growth with the surfactant at the concentration the release will produce, below the CMC as well as above it ilevbare2012a P8, R17; indulkar2019b P4; after a release gain, image the dissolving surface for crystals yang2023 R16, C24.

How it was shown

Ilevbare and co-workers (2012) used seeded growth of ritonavir at S 7.6 with 5 µg/mL TPGS, Tween 80, two cellulose esters or Tween 80–ester pairs, all below the critical micelle concentration ilevbare2012a P8, R17, M16, M17, X16 (D F18). Ilevbare and co-workers (2013) added 5 µg/mL Tween 80 or SDS to ritonavir solutions with droplets and 10% Tween 80 to a dispersion ilevbare2013d P6, P1 (B F14). Chen and co-workers (2015) set 11 drugs at a fixed ratio of concentration to the crystalline solubility in buffer, 0.1% STC or 0.1% SDS and read induction times chen2015 P1, P2, M5–M15 (D F28); in a companion paper they measured celecoxib induction times at S = 5 in eight media and watched suspensions of HPMCAS spray-dried particles in pH 3 acid for 48 h, assaying drug and dissolved HPMCAS chen2015a P2, X2, P9, P10, P11, P12 (B F14, B F15). Que and co-workers (2019) built five surfactants into ledipasvir–PVPVA dispersions at 5 parts per 100 and dissolved compacts with drug and polymer assayed que2019 P1, C60, A2, A3, P3, P9 (A F13). Indulkar and co-workers (2019) dosed atazanavir at its amorphous solubility in 13 SDS levels at an equal flux-based supersaturation and tested 1 mg/mL polymers with and without 0.1 mg/mL SDS indulkar2019b P1, P2, M2, E3, R2, P4, P5 (D F38). Saboo and co-workers (2021) and Correa Soto and co-workers (2022) built TPGS, SDS, Tween 80, CTAB, Spans and other additives into felodipine, clopidogrel and atazanavir dispersions, and ran a binary dispersion in medium holding TPGS saboo2021 P4, P6, P8; correasoto2022a P10, P11; correasoto2022b P3, A1 (A F21). Yang and co-workers (2023) made 30–50% ritonavir–PVPVA dispersions with 10 parts of SDS, Tween 80, Span 20 or Span 85, imaged surfaces and cross-sections, and found the humidity at which films separated yang2023 P1, P4, P5, P6, P7, P8, P12 (A F31).

What the data show

Surfactants in solution. TPGS and Tween 80 gave growth-inhibition ratios of about 0.49 and 0.53, CAP Adp 0.33 and 0.85 alone about 1.64 and 2.97, and with Tween 80 present the esters fell to about 0.70 and 0.83 ilevbare2012a R17 (D F18). SDS shortened the celecoxib induction time from about 87 to 5 min and lengthened it only for griseofulvin and nevirapine, while with STC four drugs did not crystallize within the run chen2015 R3, C13, C17, C18 (D F28). For atazanavir the induction time stayed at about 199–216 min up to 0.05 mg/mL SDS, fell to about 56 min by 0.3 mg/mL and stayed at about 52–68 min from the CMC to 3.6 mg/mL, and with 0.1 mg/mL SDS 1 mg/mL PVPVA held off crystallization for about 350 instead of more than 1000 min while HPMC-606 and HPMCAS-MF kept theirs indulkar2019b R3, R4 (D F38). Surfactants with dispersions in the medium. At S = 5 the celecoxib induction time was 7 (polysorbate 80), 12 (Poloxamer 188) and 41 min (SDS) against 88 min without surfactant, and 273 (Triton X100) and more than 960 min (STC 0.75%); SDS below its CMC still gave 29 min chen2015a R12, C6 (B F14). After 24 h at pH 3 the suspension liquid held about 860 µg/mL HPMCAS with SDS against about 3.5 without surfactant, and with SDS the celecoxib supersaturation peaked within 10 min and fell to ≈3.2 by 1 h as crystals formed chen2015a R18, R17, X4 (B F15). Surfactants in the dispersion. With SDS ledipasvir release stayed congruent at 10, 20 and 30% (≈97% of both at 90 min at 30%) and failed at 40%, poloxamer 407 helped at 7.5% only, and Span 85, Tween 80 and TPGS left release at ≤ ≈4% que2019 R8, R9, R7, R6, R3 (A F13). TPGS replacing 2, 5 or 10% of the polymer gave felodipine limits of 25, 35 and 45% against 15%, whereas 35 µg/mL TPGS in the medium left a 30% binary dispersion at about 0.4% release; in atazanavir–PVPVA all eight additives raised release at 10% from about 2.4% to 11–106% saboo2021 R12, R15; correasoto2022b R2, R4 (A F21). In ritonavir–PVPVA at 30% the four surfactants gave about 50–97% release; at 40% the Spans gave about 1–8% and Tween 80 and SDS about 57% and 48–54%; SDS raised the water at which 30% films separated from 14.0 to 24.5% yang2023 R2, R21 (A F31); the SDS dispersions plateaued after about 30 min at about 70, 48–54 and 33–39% for 30, 40 and 50% loading, with needles on the 30% surface and SDS covering about 98 wt% of the 40% surface yang2023 R2, R16, R17 (A F19).

chapter findingsystemmethod and conditionsresultids
D F18ritonavir, 5 µg/mL TPGS or Tween 80, cellulose estersseeded growth, S 7.6, below the CMCgrowth about twice as fast; esters 1.64 and 2.97 → 0.70 and 0.83 with Tween 80ilevbare2012a R17, R1.g, M17
D F2811 drugs, 0.1% STC or SDSmatched C/Ceq, induction timeSTC longer for all 11; SDS shorter for 7 of 9chen2015 R3, C13, C17, C18
D F38atazanavir, 13 SDS levels; PVPVA, HPMC-606, HPMCAS-MFequal flux-based supersaturation of about 65shortened from about 0.075 mg/mL to the CMC; PVPVA delay >1000 → about 350 minindulkar2019b R3, R4, M2
B F14celecoxib, S = 5, eight media; ritonavir dropletsinduction time; pH 3 suspensions of HPMCAS particles7–41 min with polysorbate 80, Poloxamer 188, SDS against 88; STC more than 960; ritonavir 23.6 and 34.7 minchen2015a R12, R14, C6; ilevbare2013d R12
B F15celecoxib–HPMCAS particles at pH 3dissolved polymer and drug, 24–48 habout 860 against 3.5 µg/mL HPMCAS with SDS; supersaturation peak then crystals by 1 hchen2015a R18, R17
A F13ledipasvir–PVPVA with five surfactants, 5 per 100compacts, drug and polymer assayedSDS limit 5 → 30%; poloxamer 407 to 7.5%; Span 85, Tween 80, TPGS no gainque2019 R7, R8, R9, R3, C12
A F21felodipine with TPGS; clopidogrel with SDS; atazanavir with eight additivescompacts; TPGS in the medium as controllimits 15 → 45%, 40 → 50%, 5 → 15%; TPGS in the medium no effectsaboo2021 R12, R15; correasoto2022a R17, R18; correasoto2022b R2, R4
A F31ritonavir–PVPVA 30–50% with SDS, Tween 80, Span 20, Span 85compacts, imaging, film separation by humidity50–97% at 30%; SDS film separation 14.0 → 24.5% wateryang2023 R2, R21, R13
A F19ritonavir–PVPVA with 10 parts SDSrelease and surface imagingplateau at about 30 min near 70% (30% loading); needle crystals on the surfaceyang2023 R2, R16, R17

Figure

Fig. 8 of ilevbare2012a: growth-inhibition ratio with surfactants, polymers and surfactant–polymer pairs
Fig. 8 · ilevbare2012agrowth-inhibition ratio with surfactants, polymers and surfactant–polymer pairs
The bars for TPGS and Tween 80 lie below 1, faster growth than without additive, and the bars of the esters fall when Tween 80 is added ilevbare2012a R17 (D F18).

Why

Below the CMC micellar solubilization is excluded, so TPGS and Tween 80 "appear" to act at the crystal–solution interface, where lowering of interfacial tension can outweigh the blocking of kink sites; the loss of the esters' effect is attributed "most likely" to polymer–surfactant aggregates ilevbare2012a C51, C52, C53, C54 (D F18). For atazanavir, SDS monomers are read as adsorbing on nuclei as hemimicelles that lower the crystal–water interfacial energy, a "supposition" supported by pyrene indulkar2019b C19, C32, C33, C35 (D F38). Chen and co-workers find it "conceivable" that flexible linear tails align with nucleating celecoxib while bulky groups do not chen2015a C20, C21 (B F14), and propose that leaching is set by how much the surfactant dissolves HPMCAS ("It is likely") chen2015a C31, C32 (B F15). In the release chapter micellar solubilization is ruled out because the medium stayed below the CMC and TPGS in the medium did nothing que2019 C51; saboo2021 C33, C18, C35 (A F13, A F21); the authors offer that SDS "possibly" reduces the rate or tendency of phase separation que2019 C53 (A F13), and for ritonavir that preventing or disrupting a continuous drug-rich layer is the most critical surfactant effect ("propose") yang2023 C37, C9, C42 (A F31). (synthesis: the two chapters measure different steps, the surfactant acting on the phase behaviour of the hydrating gel in one and on nucleation and growth at a drug–water interface in the other; both act through the drug's interfaces at concentrations far below the CMC, so the same additive can open release and shorten the time the released supersaturation lasts, which the ritonavir–SDS compacts showed in one test.)

Conditions and limits

The growth effect is one drug, two surfactants and two esters at one level ilevbare2012a K6 (D F18). At matched C/Ceq the SDS runs held up to 36 times more drug than buffer runs, and all values are bar-chart readings without statistics chen2015 X4, X5, X6, X7 (D F28). The celecoxib suspension tests have no stated replicates and the tail-shape explanation rests on five surfactants without interfacial measurements chen2015a K3, X21 (B F14). The release gains were measured as release; their mechanisms were not measured in a dissolving compact saboo2021 K6; correasoto2022b K5 (A F21). Crystallization of the released drug was not followed in most surfactant release studies, so the cost of a gain in release on the duration of supersaturation is known for ritonavir with SDS only (synthesis).

Counterexamples and conflicts

Not every surfactant promoted crystallization: STC held celecoxib beyond 960 min and Triton X100 slowed it chen2015a R12 (B F14); SDS lengthened the induction time of griseofulvin and nevirapine chen2015 C17, C18 (D F28); and HPMC-606 and HPMCAS-MF kept their effect on atazanavir with SDS indulkar2019b R4 (D F38). Not every surfactant helped release: TPGS raised the felodipine limit but not that of ledipasvir and slowed clopidogrel, and CTAB let dissolved clopidogrel fall que2019 R6; correasoto2022a C56, R15 (A F21). Built-in Tween 80 and TPGS let ritonavir droplets grow to about 4–10 µm while the Spans kept them near 1 µm indulkar2022 R11, R13 (A F16). A micellar solubilizer in solution raised both ritonavir solubilities so that the supersaturation ratio did not rise ilevbare2013a R16, C54 (C F12).

Transfer check

Before building a surfactant into a dispersion, measure induction time and seeded growth of the drug with the surfactant at the concentration the release will produce, below the CMC as well as above it ilevbare2012a P8, R17; indulkar2019b P4 (D F18, D F38). Screen the surfactant inside the dispersion, not in the medium, across a loading series with drug and polymer assayed, since the effective surfactant differed between drugs saboo2021 R15, C35; correasoto2022b X16 (A F21). After a release gain, image the dissolving surface for crystals and follow the released concentration for at least 1–2 h yang2023 R16, C24 (A F31). If the medium contains bile salts, compare sodium taurocholate with SDS chen2015 C20, C25 (D F28).

History

2012: Ilevbare and co-workers found that surfactants below their CMC doubled ritonavir growth and cancelled the esters ilevbare2012a R17 (D F18). 2013: SDS and Tween 80 promoted crystallization of ritonavir droplets ilevbare2013d R12 (B F14). 2015: Chen and co-workers found SDS hastening and STC slowing nucleation across drugs and SDS dissolving HPMCAS from suspended particles chen2015 R3 (D F28); chen2015a R12 (B F14); chen2015a R18 (B F15). 2019: Que and co-workers raised the ledipasvir limit with built-in SDS que2019 R7, R8 (A F13), and Indulkar and co-workers placed the SDS effect on nucleation between a seventh of the CMC and the CMC indulkar2019b R3 (D F38). 2021–2022: TPGS, SDS and Span 80 raised the limits of felodipine, clopidogrel and atazanavir saboo2021 R12; correasoto2022a R17; correasoto2022b R4 (A F21). 2023: Yang and co-workers showed SDS keeping the ritonavir gel in one phase and bringing surface crystals yang2023 R21, R16 (A F31).

Topic 3 of 5 · 3 findings · F7–F9

Release regime and limit of congruency

F7

Topic 3Release regime and limit of congruency1 of 3

One loading step switches a dispersion from release with the polymer to a drug-rich layer and little release.

Ritonavir–PVPVA tablets released ≈97% of their drug in 60 min at 25% loading, ≈29% at 30% and at most ≈2% at 35–50% indulkar2019a R11, C2, C31. Below the limit drug and polymer left together, passed the amorphous solubility within 5–10 min and formed 218 ± 15 nm droplets indulkar2019a R9, R20. Above it the surface turned drug-rich within minutes, for ledipasvir from 17 to 54 wt% drug in 10 min que2019 R15.

strongStrong for the existence and size of the switch, measured with both components in triplicate in several papers; moderate for its link to the supersaturation outcome and for the gel picture, imaged in three drugs indulkar2019a R11; saboo2019 R5, R6; alonzo2011 K5; yang2022a R6.

Ritonavir–PVPVA tablets: drug released in 60 min, %10–25% drug≈97–100%30% drug≈29%35–50% drugat most ≈2%

Neat amorphous ritonavir released essentially nothing in 120 min. indulkar2019a R11, R3, R1

ledipasvir5–7.5nilvadipine10–15cilnidipine, felodipine15–20itraconazoleextruded / spray-dried10–2020–25ritonavir25–3005101520253035drug loading in PVPVA, % (last congruent to first failed)

Each bracket is one tested loading step; the switch lies inside it, and its position depends on the drug. que2019 C10; saboo2019 R7; saboo2020a R15; bhardwaj2018 X6; indulkar2019a X7

For your drug

  1. Dissolve a loading series of the dispersion as constant-area compacts with drug and polymer assayed, and rerun the lowest and the target loading in medium presaturated with the drug.
  2. Compare the drug rate at the target loading with a compact of the neat amorphous drug: within about one order of magnitude, with the polymer several times faster, the dispersion is drug-controlled; choose a loading at least one tested step below the switch.

saboo2019 P10, P20, R5, X9; indulkar2019a R12, C43; purohit2017b C50; yang2022a P5, P6

How it works and key numbers
  1. At low loading there is too little drug to form an intact surface layer, so the dissolving polymer brings the drug into solution ("is thought to occur") indulkar2019a C25.
  2. Above the limit the polymer leaves faster, so the interface "must" become drug-rich saboo2019 C38, C21.
  3. The authors attribute the drop to water-induced phase separation outpacing dissolution at high loading, a hydrophobic drug and a hydrophilic polymer giving "a classic case of solvent-induced immiscibility" indulkar2019a C52, C33; purohit2017b E4, C43, C44.
  4. Discrete drug-rich domains in the dissolving polymer-rich phase are carried out as nanodroplets, whereas a continuous drug-rich layer "acts as an insoluble barrier" yang2022a C41, C44, C47, C55; deac2023a C47, C56.
  5. By the lever rule the drug-rich phase turns from minority to majority near the critical point, which "appears to underpin" the fall-off deac2024b C47, C65.
To feel the numbers. From 25 to 30% ritonavir the released drug fell 97 ÷ 29 ≈ 3.3-fold, and from 25% to 35–50% about 97 ÷ 2 ≈ 50-fold.
≈97 → ≈29 → ≈2%ritonavir released in 60 min at 25, 30 and 35–50% loadingindulkar2019a R11
about 60- and 360-foldfall in drug release rate over one 5% step, nilvadipine and cilnidipinesaboo2019 R5, R6, X8
0.15 → 0.82drug-rich fraction of MePHPH between 27 and 39.5% loading along a hydration pathdeac2024b R35
Evidence: data, conditions and papers

Finding F7. Drug loading switches a dispersion between two outcomes of the same dissolution test: below the limit of congruency the drug leaves with the polymer, passes the amorphous solubility and forms nanodroplets; one loading step above it the polymer leaves first, a drug-rich layer remains and the drug stays at or below the ceiling

In short. Ritonavir–PVPVA tablets released ≈97% of their drug in 60 min at 25% loading, ≈29% at 30% and at most ≈2% at 35–50% ("falling off a cliff"), and one 5% step past the limit cut the drug rate about 60-fold for nilvadipine and about 360-fold for cilnidipine indulkar2019a R11, C2, C31; saboo2019 R5, R6, X8 (A F6). Below the limit drug and polymer left at one normalized rate, far faster than the neat amorphous drug (nilvadipine 2.13–2.53 against 0.002 mg/min/cm²) saboo2019 R5, R6, R8 (A F2), passed the amorphous solubility within 5–10 min and formed 218 ± 15 nm droplets indulkar2019a R9, R20 (A F4); above it the surface turned drug-rich within minutes (ledipasvir 17 → 54 wt% in 10 min) and the drug dissolved near the neat amorphous rate que2019 R15; saboo2019 R18 (A F7); bhardwaj2018 R4, R11 (A F3). The supersaturation chapter had seen the same split as release speed: 90:10 HPMC–felodipine particles dissipated within 5 min and overshot into a colloid, while 50:50 particles kept their shape for at least 30 min and rose slowly to ≈8.9 µg/mL, and 50:50 HPMCAS danazol levelled at ≈6 µg/mL without a drug-rich phase alonzo2011 R4, R2, R1; jackson2015 C36, R2, R9 (B F10). Imaging of dissolving compacts placed the switch in the gel: discrete drug-rich droplets up to about 2 µm left with the polymer at 10–20% ritonavir, a continuous drug-rich layer stayed from 30% yang2022a R6, R10, R11, R12, R13 (A F25), and measured phase diagrams put the critical point near the limit deac2024b R35, R37 (A F30).

Type. cross-chapter synthesis of 12 chapter findings (constant-area compacts with both components assayed, dissolving particles and films, imaging of the gel layer, phase diagrams; ritonavir, nilvadipine, cilnidipine, ledipasvir, felodipine, itraconazole, danazol, celecoxib, indomethacin and phenolphthalein analogues) Strength. for the existence and size of the switch, measured with both components in triplicate in several papers (A F6, A F2); moderate for the link from the switch to the supersaturation outcome, which rests on co-occurrence and on release speed read from concentration curves (A F4, B F10); moderate for the gel picture, imaged in three drugs (A F25).

How it was shown

From 2018 the release chapter dissolved loading series as constant-area compacts, ritonavir–PVPVA at 10–50% among them indulkar2019a A1; que2019 A1; saboo2019 A2; bhardwaj2018 A1. Hydrated films were imaged by confocal microscopy indulkar2019a P9, P10; que2019 P6, and Yang and co-workers (2022) imaged dye-labelled dissolving compacts yang2022a P1, P2, P5, P6, P7.

What the data show

Ritonavir–PVPVA at 10–25% released ≈97–100% of the drug by 60 min, while at 40 and 50% it released ≈3% and ≈0.65% of its drug and ≈13% and ≈6% of its polymer in 180 min indulkar2019a R11, R3, R7. Ritonavir films stayed uniform after a dip in water at 20% and showed drug-rich domains at 30 and 40% indulkar2019a R18, C2.

systemmethod and conditionsresultids
six drugs in PVPVA, felodipine in PVP and HPMCloading series in 5% stepsritonavir 97 → 29 → ≤2%; 60- to 360-fold drops; brackets 5–30%indulkar2019a R11, C2, C31; saboo2019 R5, R6, X8; saboo2020a R14
ritonavir tablets, nilvadipine and cilnidipinereleased amount against amorphous solubility; DLS, NTA10–25% passed it in 5–10 min; droplets only at congruent loadingsindulkar2019a R9, R20; saboo2019 R10, R11, R12
nifedipine–HPMC-E5 or PVPVA 10–20%dissolution into deuterated-saturated water at 5 °Clabel diluted close to full mixingindulkar2017b R11, P8, X2
ledipasvir, nilvadipine, cilnidipine compactsXPS, micro-CT, SEM after 0–15 minsurface drug 17 → 54, 2 → 32, 20 → 60%; porous layerque2019 R15; saboo2019 R18, R13, R14, R16
ritonavir–PVPVA 10–50%real-time and cross-section confocaldroplets 0.5–2 µm at 10–20%; continuous layer from 30%; release 100, 35, ≤3%yang2022a R6, R10, R11, R12, R13, R2
felodipine–HPMC 90:10 against 50:50DLS of the medium≈185 nm particles from 90:10, none from 50:50alonzo2011 R8, R7
Fig. 8 of indulkar2019a: percent of ritonavir and PVPVA released at 60 min against drug loading
Fig. 8 · indulkar2019apercent of ritonavir and PVPVA released at 60 min against drug loading

Drug and polymer release lie together near complete up to 25% loading; at 30% the drug drops to about a third and beyond it to a few percent while the polymer still dissolves in part indulkar2019a R11, R3.

Why

At low loading there is too little drug to form an intact surface layer, so the dissolving polymer brings the drug into solution ("is thought to occur") indulkar2019a C25; above it the polymer leaves faster, so the interface "must" become drug-rich saboo2019 C38, C21. The authors attribute the drop to water-induced phase separation outpacing dissolution at high loading ("can be attributed") indulkar2019a C52, C33. Discrete drug-rich domains in the dissolving polymer-rich phase are carried out as nanodroplets, and a continuous drug-rich layer "acts as an insoluble barrier" yang2022a C41, C44, C47, C55.

Limits and transfer

Every limit is the last congruent loading tested, so the switch lies inside the next step, usually 5% indulkar2019a X7; saboo2020a X11, and no rate of separation or dissolution was measured saboo2019 C42, X10; indulkar2019a X6. Dissolve a loading series as constant-area compacts with drug and polymer assayed saboo2019 P10, P20, and choose a loading at least one tested step below the switch yang2022a P5, P6.

How it was shown

Alonzo and co-workers (2011) watched 90:10 and 50:50 HPMC–felodipine particles under crossed polars and dissolved them under non-sink conditions alonzo2011 P1, P6, P2 (B F10). Jackson and co-workers (2015) dissolved danazol films at three polymer:drug ratios, and Xie and co-workers (2016, 2017) celecoxib dispersions at 10–60% and indomethacin–HPMC dispersions at 10–50% drug jackson2015 P1, P2; xie2016a P5; xie2017 P7 (B F10). Indulkar and co-workers (2017) dissolved nifedipine dispersions into water saturated with deuterated nifedipine at 5 °C to see whether the nanodroplets came from dissolved drug indulkar2017b R11, P8, X2 (A F5). From 2018 the release chapter dissolved loading series as constant-area compacts, ritonavir–PVPVA at 10–50%, ledipasvir at 2–20%, nilvadipine and cilnidipine in 5% steps, felodipine with three polymers and itraconazole at 10–50% indulkar2019a A1; que2019 A1; saboo2019 A2; saboo2020a A2; bhardwaj2018 A1 (A F6), and compared the surfaces of ejected compacts with the dry compact by ATR-IR, XPS, micro-CT and SEM indulkar2019a P7, P8; que2019 P7, P5; saboo2019 P14, P15, P16, P17 (A F7). Films were dipped in water or held at 97–100% RH and imaged by confocal microscopy purohit2017b P8, P13; indulkar2019a P9, P10; que2019 P6; saboo2020a P10 (A F8). Yang and co-workers (2022) and Deac and co-workers (2023) imaged dye-labelled compacts in cross-section and in real time during dissolution yang2022a P1, P2, P5, P6, P7; deac2023a P3, P4, P7, P8 (A F25), and Deac and co-workers (2024) measured drug–PVPVA–water diagrams and applied the lever rule along a hydration path deac2024b P4, P7, P3, P19, P20, E12 (A F30).

What the data show

Below the switch. Ritonavir–PVPVA at 10–25% released both components together, ≈97–100% of the drug by 60 min, while neat amorphous ritonavir released essentially nothing in 120 min indulkar2019a R11, R3, R1 (A F2); 10% itraconazole–PVPVA released 199 µg/min/cm², about 4 times amorphous ITZ and 71 times the crystal bhardwaj2018 R4, R6 (A F2). Released drug passed the amorphous solubility and formed droplets: nilvadipine and cilnidipine gave 237–366 nm droplets only at the congruent loadings saboo2019 R10, R11, R12 (A F4), and a deuterium label in the medium was diluted to ≈69–79, ≈45–56, ≈24–30 and ≈11–18% at 36–770 µg/mL added drug, close to full mixing, so the droplets formed from dissolved drug indulkar2017b R11 (A F5). In the supersaturation chapter 80–100% of the drug of a 90:10 felodipine particle appeared within about 10 min, and 10% celecoxib–HPMCAS released completely within 4 h against 16 h at 50% alonzo2011 R4, R2; xie2016a R4, R17 (B F10). At the switch. The brackets in PVPVA were 5–7.5% for ledipasvir, 10–15% for nilvadipine, 15–20% for cilnidipine and felodipine, 20–25% (spray-dried) and 10–20% (extruded) itraconazole and 25–30% for ritonavir que2019 C10; saboo2019 R7; saboo2020a R15; bhardwaj2018 X6; indulkar2019a X7 (A F6). Above the switch. Ritonavir–PVPVA at 40 and 50% released ≈3% and ≈0.65% of its drug and ≈13% and ≈6% of its polymer in 180 min, and itraconazole at 25–50% released 47–64 µg/min/cm² against 51 for amorphous ITZ, with the polymer 3.5–4 times ahead indulkar2019a R3, R7; bhardwaj2018 R4, R11 (A F3). Nilvadipine 15:85 and cilnidipine 20:80 surfaces went from 2 to 32% and from 20 to 60% drug in 10 min, and micro-CT and SEM showed a porous layer with pits up to about 20 µm saboo2019 R18, R13, R14, R16 (A F7). Indomethacin–HPMC dispersions reached ≈39.5, ≈24.5 and ≈18.5 µg/mL at 60 min at 10, 30 and 50% drug, only the 10% one approaching the amorphous solubility and forming droplets xie2017 R10, R13, R14 (B F10). In the gel. Ritonavir films stayed uniform after a dip in water at 20% and showed drug-rich domains at 30 and 40% indulkar2019a R18, C2 (A F8); in dissolving compacts the 30% layer was continuous but porous and the 40% layer rigid, and release was about 100, 35 and at most 3% at 20, 30 and 40–50% yang2022a R6, R10, R11, R12, R13, R2 (A F25). Along a hydration path the drug-rich fraction of the methyl ether of phenolphthalein jumped from about 0.15 at 27% to about 0.82 at 39.5% loading, and films switched from droplets to a continuous drug-rich phase near 40% deac2024b R35, R18, R19 (A F30).

chapter findingsystemmethod and conditionsresultids
A F2ritonavir, nilvadipine, cilnidipine, itraconazole in PVPVA, low loadingconstant-area compacts, both componentsone normalized rate at about the polymer's pace; nilvadipine 2.13–2.53 against 0.002 mg/min/cm²indulkar2019a R11, R3, R1; saboo2019 R5, R6, R8; bhardwaj2018 R4, R6
A F6six drugs in PVPVA, felodipine in PVP and HPMCloading series in 5% stepsritonavir 97 → 29 → ≤2%; 60- to 360-fold drops; brackets 5–30%indulkar2019a R11, C2, C31; saboo2019 R5, R6, X8; saboo2020a R14
A F3ritonavir 40–50%, itraconazole 25–50%compacts; saturated mediumdrug ≈0.65–3% in 180 min; ITZ near amorphous ITZ; no release into saturated mediumindulkar2019a R3, R7, R12; bhardwaj2018 R4, R11
A F4ritonavir tablets, nilvadipine and cilnidipinereleased amount against amorphous solubility; probe, DLS, NTA10–25% passed it in 5–10 min, 218 ± 15 nm; droplets only at congruent loadingsindulkar2019a R9, R20; saboo2019 R10, R11, R12
A F5nifedipine–HPMC-E5 or PVPVA 10–20%dissolution into deuterated-saturated water at 5 °Clabel diluted close to full mixingindulkar2017b R11, P8, X2
A F7ledipasvir, nilvadipine, cilnidipine compactsXPS, micro-CT, SEM after 0–15 minsurface drug 17 → 54, 2 → 32, 20 → 60%; porous layerque2019 R15; saboo2019 R18, R13, R14, R16
A F8ritonavir, ledipasvir, felodipine filmsdip in water or 97–100% RH, confocalseparated above the limit, uniform belowindulkar2019a R18; que2019 R14; saboo2020a R23
A F25ritonavir–PVPVA 10–50%real-time and cross-section confocaldroplets 0.5–2 µm at 10–20%; continuous layer from 30%; release 100, 35, ≤3%yang2022a R6, R10, R11, R12, R13, R2
A F30MePHPH and PHPH in PVPVAmeasured and PC-SAFT diagrams, lever ruledrug-rich fraction 0.15 → 0.82 between 27 and 39.5%deac2024b R35, R18, R19
B F10felodipine–HPMC 90:10 and 50:50; danazol; celecoxib; indomethacinparticle imaging; non-sink dissolution10% released in minutes into a colloid; 50% slow, below or at the ceilingalonzo2011 R4, R2, R1; jackson2015 C36, R2, R9; xie2016a R4, R17; xie2017 R10, R13, R14
B F9felodipine–HPMC 90:10 against 50:50DLS of the medium≈185 nm particles from 90:10, none from 50:50alonzo2011 R8, R7

Figure

Fig. 8 of indulkar2019a: percent of ritonavir and PVPVA released at 60 min against drug loading
Fig. 8 · indulkar2019apercent of ritonavir and PVPVA released at 60 min against drug loading
Drug and polymer release lie together near complete up to 25% loading; at 30% the drug drops to about a third and beyond it to a few percent while the polymer still dissolves in part indulkar2019a R11, R3 (A F6).

Why

Following cited work, Alonzo and co-workers distinguish two regimes: at high polymer loading the drug dissolves at a fraction of the polymer rate, giving "very high local supersaturations", while at moderate to high drug loading the polymer leaves first and a drug-rich interface regulates dissolution alonzo2011 C37, C38, C39, E4 (B F10). At low loading there is too little drug to form an intact surface layer, so the dissolving polymer brings the drug into solution ("is thought to occur") indulkar2019a C25 (A F2); above it the polymer leaves faster, so the interface "must" become drug-rich saboo2019 C38, C21 (A F7). The authors attribute the drop to water-induced phase separation outpacing dissolution at high loading ("can be attributed"), a hydrophobic drug and a hydrophilic polymer giving "a classic case of solvent-induced immiscibility" indulkar2019a C52, C33 (A F6); purohit2017b E4, C43, C44 (A F8). The imaging papers place the separation where the gel holds most water: discrete drug-rich domains in the dissolving polymer-rich phase are carried out as nanodroplets ("it can be inferred"), and a continuous drug-rich layer "acts as an insoluble barrier" yang2022a C41, C44, C47, C55; deac2023a C47, C56 (A F25). By the lever rule the drug-rich phase turns from minority to majority near the critical point, which "appears to underpin" the fall-off deac2024b C47, C65 (A F30). A polymer-controlled release continues past the amorphous solubility and drug-controlled release slows toward zero at it indulkar2019a C49, C48; purohit2017b C50 (A F4). (synthesis: the switch sets which end of the chain of F1 a dispersion reaches: fast release to the ceiling, with the excess as droplets whose crystallization risk is F5, or slow release that never reaches it; a supersaturation measured from a dispersion therefore depends first on which side of its limit the loading lies.)

Conditions and limits

Every limit is the last congruent loading tested, so the switch lies inside the next step, usually 5% indulkar2019a X7; saboo2020a X11 (A F6). The race between separation and dissolution was proposed in each paper, but no rate of either was measured purohit2017b C5; saboo2019 C42, X10; indulkar2019a X6 (A F8). Images and release came from separate set-ups, and transport through the network was not measured deac2023a X10; yang2022a C31 (A F25). In the supersaturation chapter the release regimes are read from concentration curves, the drug-rich surface was not measured, and the 50:50 danazol films were about 10% crystalline before dissolution alonzo2011 K5; jackson2015 K4, K6, X10 (B F10). The cliff is a PVPVA, PVP and HPMC result; HPMCAS behaved differently (F9).

Counterexamples and conflicts

At 1 h the 10% nilvadipine compact had released about 59 µg/mL against about 1.5 µg/mL from 15%, so the link of droplets to congruent release also follows from how much drug was released saboo2019 C30, X14 (A F4). Low-Tg loratadine and clopidogrel passed the amorphous solubility although the polymer ran ahead yang2021 R19, R16, C14, C15 (A F4). In dissolving compacts water-induced separation appeared below the limit as well, as droplets, and in 2023–2024 MePHPH–PVPVA films separated at every loading of 10–50% yang2022a R4, R6; deac2024b R1, R2 (A F8), so the limit follows the shape of the separated phase rather than whether separation occurs. A 10% atazanavir film stayed uniform for 3 h although that loading failed, and the high-Tg lumefantrine sulfate did not separate yet released only at 2% correasoto2022b R9, R1; hiew2022b R19, R20 (A F8). Near the switch the manufacturing route and the particle surface decided the regime: 20% itraconazole–PVPVA released 113 µg/min/cm² spray-dried against 48.8 melt-extruded bhardwaj2018 R4 (A F14), and at 75% grazoprevir in HPMCAS particles with 10–34% surface drug released 47–72% against 8–17% for binary particles with 53–84% hiew2023 R14, R10 (A F28), while among already diluted surfaces wettability separated good from poor release hiew2025 R15, R17 (A F35).

Transfer check

Dissolve a loading series of the dispersion as constant-area compacts with drug and polymer assayed, and rerun the lowest and the target loading in medium presaturated with the drug saboo2019 P10, P20; indulkar2019a R12, C43 (A F1). Compare the drug rate at the target loading with a compact of the neat amorphous drug: within about one order of magnitude, with the polymer several times faster, the dispersion is drug-controlled and will not exceed its amorphous solubility saboo2019 R5, X9; purohit2017b C50 (A F3). Choose a loading at least one tested step below the switch, and image a hydrated film or a dissolving compact for discrete against continuous drug-rich domains yang2022a P5, P6 (A F25).

History

2011: Alonzo and co-workers described fast, colloid-forming release at 10% drug and slow release at 50% from felodipine–HPMC particles alonzo2011 R4, R8, C37, C38 (B F10, B F9). 2015–2017: danazol, celecoxib and indomethacin loading series showed the same fall in release with loading jackson2015 C36, R2; xie2016a R4, R17; xie2017 R10, R13, R14 (B F10); Purohit and Taylor found nanodroplets only from films whose free drug reached the amorphous solubility, and Indulkar and co-workers traced the droplets to dissolved drug purohit2017b R10, R11; indulkar2017b R11 (A F4, A F5). 2018–2020: the release chapter measured both components and named the limit of congruency, a narrow switch of one to three orders of magnitude bhardwaj2018 R4; indulkar2019a R11, C2, C31; saboo2019 R5, R7 (A F6), with a drug-rich, porous surface above it que2019 R15; saboo2019 R18 (A F7). 2022–2023: imaging of dissolving compacts placed the switch in the shape of the drug-rich phase in the gel yang2022a R6, R10; deac2023a R6, R7 (A F25). 2024: measured phase diagrams put the critical point near the limit deac2024b R35, R37 (A F30).

F8

Topic 3Release regime and limit of congruency2 of 3

A high wet Tg went with failed release at low loading; a low one with fast crystallization of the wetted solid.

Cooling below the wet Tg of the drug-rich surface lowered the limit of congruency of loratadine–PVPVA from 30 to 2%, and heating a 10% atazanavir dispersion from 37 to 55 °C raised its release from about 3 to 64% yang2021 R22, M1; correasoto2022b R6, R5, M1. Amorphous salts that raised the Tg of lumefantrine lowered its highest loading with good release hiew2022b R2, R20. For delamanid, a poor glass former whose free-base dispersions held crystals, salts with a higher Tg raised release duong2022a M1, R3, R8, R20, R26.

moderateModerate: the temperature and salt effects are large and repeated, but no paper measured mobility or the wet Tg of the dissolving surface, Tg goes with hydrogen-bond donors and counterion class, and the two sides were never tested on one drug saboo2020 X9; hiew2022b X10, X6; duong2022a X10.

Lumefantrine in PVPVA: highest loading with good release, %free baseTg 19.7 °C35carboxylate saltsTg about 28–42 °C20–25HCl saltTg about 96 °C15sulfonate saltsTg 70–85 °C10sulfate saltTg 101 °C2

Raising the Tg of the drug form lowered the loading that still released well. hiew2022b R2, R20, R10

Delamanid dispersions at 25% drug, pH 6.5: released, µg/mL of 100free base, HPMCASdrug PXRD peaks≈2free base, HPMCPdrug PXRD peaks≈20four sulfonate saltsTg 83.7–117.8 °C≈95–97

For a drug that crystallizes within minutes, the salt that raised Tg restored release. duong2022a R8, R15, R20, R26

For your drug

  1. Estimate the wet Tg of the drug and of a water-saturated drug-rich mixture of about 70% drug and compare it with 37 °C; if it lies well above, expect a low limit of congruency and test a plasticizer at 5–10 g per 100 g in the dispersion.
  2. If it lies below and the drug crystallizes within minutes at its amorphous solubility, check every dispersion for residual crystals and consider a salt, and measure the release of a salt over a loading series in the intended polymer.

saboo2020 E6, C53; yang2021 E3; correasoto2023 R1, R11; duong2022a R2, C56, C67; hiew2022b C54

How it works and key numbers
  1. Absorbed water plasticizes the amorphous drug, so the drug-rich phase is a supercooled liquid when its wet Tg lies below the test temperature and a glass when above ("consistent with") ilevbare2013a C23; indulkar2015 C39, C38; mosqueragiraldo2015 C13.
  2. Saboo and co-workers link the temperature effect "plausibly" to the wet Tg of the drug-enriched surface and propose that lower temperature impedes chain mobility and disentanglement saboo2020 C52, C53, C55.
  3. A glassy matrix takes up water slowly and needs more water before its chains disentangle correasoto2022b C34, C36.
  4. On the other side, the hydrated felodipine solid at 37 °C is above its Tg and "presumably" crystallizes faster than it dissolves alonzo2010 C8, C33, C34.
  5. For delamanid, rotary evaporation was "not fast enough" to trap a Class I glass former, and drug–counterion interactions "likely" raise Tg and lower mobility duong2022a C10, C44, C45, C5, C50.
30 → 2%loratadine–PVPVA limit of congruency at 37 °C against 5 °Cyang2021 R22, M1
35 → 2%highest loading with good release, lumefantrine free base (Tg 19.7 °C) against sulfate (101 °C)hiew2022b R2, R20
≈20 → ≈95–97 µg/mLdelamanid release at 25% drug, free base against sulfonate saltsduong2022a R8, R26
Evidence: data, conditions and papers

Finding F8. The glass transition of the wetted drug bears on two opposite failures: well above the test temperature it went with release failing at low loading, as cooling, high-Tg drugs and amorphous salts showed and plasticizers reversed; below it the wetted solid crystallized faster, and for fast-crystallizing delamanid a salt that raised the Tg restored release

In short. The water-plasticized Tg of the drug-rich phase decides whether it is a supercooled liquid or a glass at the test temperature (ritonavir 0.4 °C, atazanavir about 51 °C, telaprevir 52 °C), though in solution tests glassy phases behaved much like liquid ones ilevbare2013a R5, C23; indulkar2015 R22, M1, M2; mosqueragiraldo2015 R2, M1 (C F2). In release it moved the limit of congruency: cooling below the wet Tg of the drug-rich surface lowered the limit of indomethacin–PVPVA from 10% to below 5% and of loratadine–PVPVA from 30 to 2%, heating a 10% atazanavir dispersion from 37 to 55 °C raised its release from about 3 to 64%, and low-wet-Tg drugs reached 25–40% in PVPVA where high-Tg drugs failed at 5–10% saboo2020 R29, R30, C53; yang2021 R22, M1; correasoto2022b R6, R5, M1 (A F18). Amorphous salts that raised the Tg of lumefantrine from 19.7 °C to as much as 101 °C lowered its highest loading with good release from 35% to 2–15% hiew2022b R2, R20 (A F22), and lipophilic plasticizers raised the limit of atazanavir from 5 to 25% but that of ritonavir only from 25 to 30% correasoto2023 R1, R16 (A F26). The supersaturation chapter shows the other side: hydrated felodipine above its Tg at 37 °C crystallized faster than it dissolved alonzo2010 R2, C33, C34 (B F1), and for delamanid, a poor glass former with a Tg of 43.3 °C whose rotary-evaporated free-base dispersions held crystals, sulfonate salts with Tg 83.7–117.8 °C raised release at 25% drug from ≈20 to ≈95–97 µg/mL duong2022a M1, R3, R8, R20, R26 (B F23).

Type. cross-chapter synthesis of 9 chapter findings (drug-rich phases in solution, compacts at several temperatures, drugs of different Tg, nine lumefantrine forms, plasticized dispersions, slurries and salt dispersions) Strength. : the temperature and salt effects are large and repeated in several papers (A F18, A F22), but no paper measured mobility or the wet Tg of the dissolving surface, Tg goes with hydrogen-bond donors and counterion class across drugs, and the two sides of the conflict were never tested on one drug (A F18, B F23).

How it was shown

In 2020–2022 compacts were dissolved above and below the wet Tg of the drug, estimated as T_{g,\mathrm{wet}} \approx T_{g,\mathrm{dry}} - 10\,w saboo2020 P7, E6; yang2021 A1, P12, P15, E3. Hiew and Taylor (2022) made eight amorphous lumefantrine salts and dissolved PVPVA compacts at 2–35% hiew2022b P1, P2, P8, and Duong and co-workers (2022) made free-base and sulfonate-salt dispersions of delamanid duong2022a P1, P2, P5, P6.

What the data show

The IND–PVPVA limit stayed at 10% from 25 to 57 °C and fell below 5% at 10 °C saboo2020 R29, R30, C53. PVPVA powders failed at 25 and 40% for low-Tg loratadine and miconazole but at 5–10% for danazol, elbasvir, paclitaxel and ivacaftor yang2021 R7, R12, M1, C8.

systemmethod and conditionsresultids
drug-rich phases of ritonavir, clotrimazole, atazanavir, telaprevirisolated phase, DSC; wet Tg0.4, about 14, about 51, 52 °C; glassy phases behave much like liquid onesilevbare2013a R5; indulkar2015 R22, M1, M2; mosqueragiraldo2015 R2, M1
loratadine in PVPVA and HPMCAScompacts at 37 and 5 °Climits 30% and 20% at 37 °C, 2 and 5% at 5 °Cyang2021 R22, M1
lumefantrine free base and eight salts in PVPVATg; compacts at 37 °CTg 19.7 → up to 101 °C; good release 35% → 2–15%hiew2022b R2, R20
atazanavir, ledipasvir, ritonavir with nine plasticizerscompacts, 5 or 10 g per 100 glimits 5 → 25%, 5 → 15–20%, 25 → 30%correasoto2023 R1, R11, R14, R16
neat amorphous felodipine at 25 and 37 °Cslurry, in situ Raman≈54% crystalline at 1 min at 37 °C; 50% after about 8 min at 25 °Calonzo2010 R2, R1
delamanid free base and four sulfonate saltsrotary evaporation; PXRD; pH 6.5 releasefree base crystals from 15–20%, ≈20 µg/mL at 25%; salts Tg 83.7–117.8 °C, ≈95–97 µg/mLduong2022a R8, R15, R20, R26
Fig. 13 of hiew2022b: highest loading with good release against the onset Tg of the neat drug form
Fig. 13 · hiew2022bhighest loading with good release against the onset Tg of the neat drug form

The highest loading with good release falls as the onset Tg of the lumefantrine form rises, from 35% for the free base to 2% for the sulfate hiew2022b R2, R20.

Why

Absorbed water plasticizes the amorphous drug, so the phase is a supercooled liquid when its wet Tg lies below the test temperature and a glass when above ("consistent with") ilevbare2013a C23; indulkar2015 C39, C38. The hydrated felodipine solid at 37 °C is above its Tg and "presumably" crystallizes faster, and for delamanid drug–counterion interactions "likely" raise Tg and lower mobility alonzo2010 C8, C33, C34; duong2022a C5, C50. (synthesis: raising the Tg helped where residual crystals were the failure, delamanid, and harmed where a slow drug-rich surface was the failure, lumefantrine in PVPVA.)

Limits and transfer

Tg goes with hydrogen-bond donors across drugs yang2021 C25; hiew2022b X10. Spray-drying the delamanid free base at 25% also gave a dispersion releasing more than 80% nguyen2023c R5, R6. If the wet Tg lies well above 37 °C, test a plasticizer at 5–10 g per 100 g correasoto2023 R1, R11; if it lies below and the drug crystallizes within minutes, check for residual crystals and consider a salt duong2022a R2, C56, C67.

How it was shown

Alonzo and co-workers (2010) followed slurries of amorphous felodipine at 25 and 37 °C by in situ Raman alonzo2010 P1, P2, P3, P5 (B F1). In 2013–2015 the LLPS chapter dried the isolated drug-rich phases for their water content and Tg, and estimated wet Tg from sorption isotherms ilevbare2013a P7, P8, P9, P15; almeidaesousa2015 P7, P8, P9, R8, R9 (C F2). Que and co-workers (2019) set ledipasvir (Tg 160.9 °C) against ritonavir (wet Tg about 0 °C) que2019 M1, R27, R28 (A F9). In 2020–2022 compacts were dissolved above and below the wet Tg of the drug: indomethacin–PVPVA at 10–57 °C, loratadine at 37 and 5 °C and atazanavir at 37 and 55 °C, and PVPVA powders of six drugs were grouped by wet Tg, estimated as T_{g,\mathrm{wet}} \approx T_{g,\mathrm{dry}} - 10\,w saboo2020 P7, E6; yang2021 A1, P12, P15, E3; correasoto2022b A3, P5 (A F18). Duong and co-workers (2022) measured the glass-forming ability and induction time of delamanid, made free-base and in situ sulfonate-salt dispersions with HPMCAS and HPMCP and checked them by PXRD and DSC duong2022a P1, P2, P3, P4, P5, P6, P18 (B F23). Hiew and Taylor (2022) made eight amorphous lumefantrine salts, measured onset Tg, stored salts and dispersions at 40 °C/75% RH and dissolved PVPVA compacts at 2–35% hiew2022b P1, P2, P5, P7, P8 (A F22). Correa Soto and co-workers (2023) added 5 or 10 g of nine plasticizers per 100 g to PVPVA dispersions of atazanavir, ledipasvir and ritonavir correasoto2023 P1, P2, M1, M2, M3, P3, P4 (A F26).

What the data show

Drug-rich phase in solution. The ritonavir phase held about 95% drug and had Tg 0.4 °C (dry 50.4 °C), whereas the clotrimazole, atazanavir and telaprevir phases had about 14, about 51 and 52 °C (dry 28, 104 and 103 °C); the glassy phases still formed at a reproducible concentration, took up probes, and the telaprevir phase redissolved within about 2 min on dilution ilevbare2013a R5, C23; indulkar2015 R22, M1, M2; mosqueragiraldo2015 R2, M1, C30, R8 (C F2). Release and temperature. The IND–PVPVA limit stayed at 10% at 25, 37 and 57 °C, fell to 5% at 17 °C and below 5% at 10 °C, where a water-saturated 70% dispersion standing in for the drug-rich surface has a wet Tg onset of 18 °C saboo2020 R29, R30, C53 (A F18). Loratadine (wet Tg 13.8 °C) had compact limits of 30% (PVPVA) and 20% (HPMCAS) at 37 °C and 2 and 5% at 5 °C, and two lumefantrine salt dispersions that released well at 37 °C released almost nothing at 10 °C yang2021 R22, M1; hiew2022b R16 (A F18). Release and drug Tg. PVPVA powders failed at 25 and 40% for loratadine and miconazole (wet Tg 13.8 and −4.7 °C) but at 5–10% for danazol, elbasvir, paclitaxel and ivacaftor, all with high Tg and hydrogen-bond donors yang2021 R7, R8, R9, R10, R11, R12, M1, M2, M3, M4, C8, C25 (A F18). The onset Tg of lumefantrine rose to about 28–42 °C with carboxylates, 70–85 °C with sulfonates, about 96 °C (HCl) and 101 °C (sulfate), and good release reached 35% for the free base, 20–25% for the carboxylate salts, 10% for the sulfonates, 15% for HCl and 2% for the sulfate hiew2022b R2, R20, R10 (A F22). With 5 g plasticizer per 100 g atazanavir released congruently to 25% with glycerol tributyrate or citrate esters, ledipasvir needed 10 g for 15–20%, and drug-free PVPVA with 10% GTB or TBC dissolved at about 4.8 and 6.1 against 2.7 mg/min/cm² correasoto2023 R1, R11, R14, R13 (A F26). Clopidogrel, Tg −9 °C, made PVPVA dissolve at about 5.2–6.7 against 2.6–2.7 mg/min/cm² for the neat compact correasoto2022a R18, M1, C30, C48 (A F15). Crystallization and Tg. Neat amorphous felodipine was ≈54% crystalline at 1 min at 37 °C but took about 8 min to reach 50% at 25 °C alonzo2010 R2, R1 (B F1). Delamanid could not be vitrified at 50 °C/min and crystallized within 2.4–10.7 min at its amorphous solubility; its rotary-evaporated free-base dispersions showed drug PXRD peaks from 15% (HPMCAS) and 20% (HPMCP) and the 25% ones released ≈2 and ≈20 µg/mL of 100, whereas four salt dispersions at 25% released ≈95–97 µg/mL duong2022a M1, R2, R3, R8, R15, R26 (B F23). The neat HCl and sulfate salts of lumefantrine did not crystallize in 16 weeks at 40 °C/75% RH, and the carboxylate-salt dispersions crystallized within a week hiew2022b R7, R8 (A F22).

chapter findingsystemmethod and conditionsresultids
C F2drug-rich phases of ritonavir, clotrimazole, atazanavir, telaprevirisolated phase, DSC; wet Tg0.4, about 14, about 51, 52 °C; glassy phases behave much like liquid onesilevbare2013a R5; indulkar2015 R22, M1, M2; mosqueragiraldo2015 R2, M1
A F9ledipasvir against ritonavir in PVPVAcompactslimits 5–7.5% against 25%; ledipasvir a glass, ritonavir a supercooled liquid in the testque2019 M1, R27, R28, C48, C49
A F18IND, loratadine, atazanavir, lumefantrine salts; six drugs in PVPVA powderscompacts at 5–57 °C; drugs grouped by wet TgIND 10 → <5% at 10 °C; loratadine 30 → 2%; ATZ 3 → 64% at 55 °C; high-Tg drugs fail at 5–10%saboo2020 R29, R30; yang2021 R22, M1, R7, R12; correasoto2022b R6, R5; hiew2022b R16
A F22lumefantrine free base and eight salts in PVPVATg; storage 40 °C/75% RH; compacts at 37 °CTg 19.7 → up to 101 °C; good release 35% → 2–15%; HCl and sulfate stable 16 weekshiew2022b R2, R20, R7, R8
A F26atazanavir, ledipasvir, ritonavir with nine plasticizerscompacts, 5 or 10 g per 100 glimits 5 → 25%, 5 → 15–20%, 25 → 30%correasoto2023 R1, R11, R14, R16
A F15clopidogrel (Tg −9 °C) in PVPVApolymer rate in congruent compactsabout 5.2–6.7 against 2.6–2.7 mg/min/cm² neatcorreasoto2022a R18, M1
B F1neat amorphous felodipine at 25 and 37 °Cslurry, in situ Raman≈54% crystalline at 1 min at 37 °C; 50% after about 8 min at 25 °Calonzo2010 R2, R1
B F23delamanid free base and four sulfonate saltsrotary evaporation; PXRD; pH 6.5 releasefree base crystals from 15–20%, ≈20 µg/mL at 25%; salts Tg 83.7–117.8 °C, ≈95–97 µg/mLduong2022a R8, R15, R20, R26
A F19INDester–PVPVA 25% at 37 and 15 °Ccompacts, XRDsurface crystals at 37 °C; at 15 °C congruent to about 84–88%saboo2020 R9, R10

Figure

Fig. 13 of hiew2022b: highest loading with good release against the onset Tg of the neat drug form
Fig. 13 · hiew2022bhighest loading with good release against the onset Tg of the neat drug form
The highest loading with good release falls as the onset Tg of the lumefantrine form rises, from 35% for the free base to 2% for the sulfate hiew2022b R2, R20 (A F22).

Why

Absorbed water plasticizes the amorphous drug, so the phase is a supercooled liquid when its wet Tg lies below the test temperature and a glass when above ("consistent with") ilevbare2013a C23; indulkar2015 C39, C38; mosqueragiraldo2015 C13 (C F2). Saboo and co-workers link the temperature effect "plausibly" to the wet Tg of the drug-enriched surface and propose that lower temperature impedes chain mobility and disentanglement saboo2020 C52, C53, C55 (A F18); Correa Soto and co-workers argue that a glassy matrix takes up water slowly and needs more water before its chains disentangle correasoto2022b C34, C36 (A F18). For lumefantrine a high-Tg salt is plasticized much less than the hydrated polymer, and the Tg asymmetry can arrest separation, a "potential explanation" hiew2022b C47, C48 (A F22). Plasticizers are read through the free volume of the gel, m_{p,\infty} = A_d\, \exp\left(-\frac{B_d}{f_g}\right), a mechanism the authors find "reasonable to suggest", and ritonavir's small gain "confirming" that mobility limits release more for high-Tg drugs correasoto2023 C40, E2, C41, C39, C19, C20 (A F26). On the crystallization side the hydrated felodipine solid at 37 °C is above its Tg and "presumably" crystallizes faster alonzo2010 C8, C33, C34 (B F1), and for delamanid rotary evaporation was "not fast enough" to trap a Class I glass former, while drug–counterion interactions "likely" raise Tg and lower mobility duong2022a C10, C44, C45, C5, C50 (B F23). (synthesis: the two chapters ask different questions of the same property; mobility of the wetted drug is needed for the drug-rich phase to leave with the polymer and is a risk where the drug crystallizes quickly, so raising the Tg helped where residual crystals were the failure, delamanid, and harmed where a slow drug-rich surface was the failure, lumefantrine in PVPVA; which failure dominates is a property of the drug, and the class of F4 and the induction time decide it.)

Conditions and limits

The limits are in 5% steps without rates at the other temperatures, temperature also changes the polymer (neat PVPVA slowed from about 3.45 to 1.68 mg/min/cm² on cooling), and Tg goes with hydrogen-bond donors across drugs saboo2020 X9; yang2021 X16, C25, R21; hiew2022b X10 (A F18). The lumefantrine limits are last-good points of a coarse grid read from drug release only, Tg goes with counterion class, and "good release" has no stated criterion hiew2022b X7, X6, X9 (A F22). The plasticizer comparators are cited and stability was not tested correasoto2023 X7, X21 (A F26). Crystallinity of the delamanid dispersions was not quantified and no PXRD of any salt dispersion appears in the main text duong2022a X10, X8 (B F23). For griseofulvin and sorafenib the "relaxed" glassy phase is inferred from a free-energy match almeidaesousa2015 C38 (C F2).

Counterexamples and conflicts

The two salt studies point in opposite directions: lumefantrine salts lowered the loading with good release hiew2022b R20, C53 (A F22), delamanid salts raised release at 25% duong2022a R26, C67 (B F23); the polymers differ (PVPVA against HPMCP), and spray-drying the delamanid free base at 25% also gave an amorphous dispersion releasing more than 80% nguyen2023c R5, R6 (B F23), so part of the delamanid gain is the removal of residual crystals rather than the Tg itself. At 55 °C atazanavir released well until it crystallized correasoto2022b R6 (A F18), and suppressing crystallization by cooling to 15 °C kept indomethacin methyl ester release congruent saboo2020 R10 (A F19): temperature moves both failures. The Tg drops of the plasticized glasses (30–53 °C) did not rank the gains correasoto2023 R17, C34, X14 (A F26).

Transfer check

Estimate the wet Tg of the drug and of a water-saturated drug-rich mixture of about 70% drug, and compare it with 37 °C saboo2020 E6, C53; yang2021 E3 (A F18). If the wet Tg lies well above 37 °C, expect a low limit of congruency and test a plasticizer at 5–10 g per 100 g in the dispersion correasoto2023 R1, R11 (A F26); if it lies below and the drug crystallizes within minutes at its amorphous solubility, check every dispersion for residual crystals and consider a salt duong2022a R2, C56, C67 (B F23). For a salt, measure the release over a loading series in the intended polymer before relying on the higher Tg for stability hiew2022b C54 (A F22).

History

2010: Alonzo and co-workers explained the faster crystallization of wetted felodipine at 37 °C by the glass transition alonzo2010 C33, C34 (B F1). 2013–2015: the LLPS chapter classed drug-rich phases as liquid or glassy by their wet Tg ilevbare2013a R5, C23; mosqueragiraldo2015 R2 (C F2). 2019: Que and co-workers noted that ritonavir is a supercooled liquid and ledipasvir a glass under the test conditions que2019 C49 (A F9). 2020–2022: temperature and Tg series moved the limit in four papers saboo2020 R29; yang2021 R22; correasoto2022b R6; hiew2022b R16 (A F18); Duong and co-workers formed delamanid salts in the dispersion and restored release duong2022a R20, R26 (B F23); Hiew and Taylor found the opposite for lumefantrine salts in PVPVA and called it a trade-off hiew2022b R20, C53 (A F22). 2023: plasticizers raised the limits of high-Tg drugs correasoto2023 R1, C20 (A F26).

F9

Topic 3Release regime and limit of congruency3 of 3

The polymer that releases fastest is not the one that holds supersaturation longest, and inhibitor rankings did not transfer.

At 10% felodipine, PVP and PVPVA released ≈3.8 and ≈2.4 mg/min/cm² against ≈0.82 for HPMCAS, but lost congruent release above 10 and 15%, while HPMCAS stayed congruent to 50% saboo2020a R15, R14, C55. Danazol dispersions crystallized after ≈56–70, ≈188–200 and ≈284–319 min with PVP, HPMC and HPMCAS jackson2015 R5. The best polymer changed with the drug: PVPVA held delamanid as long as HPMCAS and HPMCP, while HPMC did not duong2022a R4, R2.

strongStrong for the two release patterns and for the drug dependence of the best inhibitor, each replicated within its chapter; moderate for the trade-off across chapters, which was measured for one drug with the same polymers in one design only for posaconazole and celecoxib saboo2020a K5; ilevbare2013b R9; xie2015 R6.

Felodipine 10% compacts: drug release rate, mg/min/cm²PVPcongruent only to 10%≈3.8PVPVAcongruent only to 15%≈2.4HPMCAScongruent to 50%≈0.82

At 20–30% drug HPMCAS released about 100–225 times faster than PVPVA; the authors call the choice a trade-off. saboo2020a R15, R14, C55

Danazol dispersions: time until crystallization, minPVP≈56–70HPMC≈188–200HPMCAS≈284–319

The polymer that releases slowest held the supersaturation longest. jackson2015 R5

For your drug

  1. Screen polymers for the drug itself, by induction time at its amorphous solubility and by release over a loading series; use a solution screen as a rank order only, and compare inhibitors only as ratios to a control run in the same protocol.
  2. If a hydrophilic polymer is chosen for fast release, keep the loading below its limit and test a minor cellulosic inhibitor in the dispersion, checking that the two polymers mix; dissolve the dispersion after 97% RH storage as well.

ilevbare2013c P9; polyzois2024 P3; xie2015 C48; mosqueragiraldo2018a R1.b; enright2020 R2; xie2016a C69; purohit2017b P7, P14

How it works and key numbers
  1. The release patterns "appear to depend" on polymer hydrophobicity: water-induced phase separation "is likely the cause" of the limit with the three hydrophilic polymers, and the lower water uptake of HPMCAS and EUDS "conceivably" stays below what is needed to induce it saboo2020a C49, C43, C44, C54.
  2. At low loading the polymer sets the pace, so the fastest-dissolving polymers give the fastest release saboo2020a C55.
  3. For inhibition, hydrophobicity "is likely" to set adsorption: a very hydrophilic polymer stays in solution, semirigid cellulose backbones lie flat, and ionized carboxyls make the polymers amphiphilic ilevbare2012c C35, C36, C39, C40.
  4. Contact with the emerging nucleus is "clearly a prerequisite", made through acetyl or ethyl groups by chains that ionized carboxylates keep extended mosqueragiraldo2018a C44, C50, C35.
  5. (synthesis: hydrophobicity relative to water works in opposite directions: a hydrophilic polymer dissolves fast but separates from a hydrophobic drug on wetting and does not adsorb at its nuclei, while a moderately hydrophobic, ionizable cellulosic dissolves slowly but stays mixed with the drug saboo2020a C55; ilevbare2012c C35.)
≈71, ≈47 and ≈10 wt%water taken up at 95% RH by neat PVP, PVPVA and HPMCASsaboo2020a R3, R4
2- to 6-foldlongest gain in induction time from the best polymer for ritonavir, efavirenz and celecoxib at their amorphous solubilityilevbare2013c R9, R12
83 vs 37 and 15.5 mintwo polymers that held racemic praziquantel beyond 83 min held the R-enantiomer only 37 and 15.5 minpolyzois2024 R2, R3, R4
Evidence: data, conditions and papers

Finding F9. The polymer that releases the drug fastest is not the one that holds its supersaturation longest, and no inhibitor ranking carried over between drugs, tests or enantiomers: hydrophilic PVP and PVPVA released fastest at low loading but fell off a cliff and inhibited poorly, HPMCAS released more slowly but congruently to higher loading and inhibited best for most drugs

In short. At 10% felodipine PVP and PVPVA released ≈3.8 and ≈2.4 mg/min/cm² against ≈0.82 for HPMCAS, but lost congruent release above 10 and 15% while HPMCAS stayed congruent to 50% and at 20–30% released about 100–225 times faster than PVPVA; the authors call the choice a "trade-off" saboo2020a R15, R14, C55 (A F11). In the supersaturation chapter the cellulosic polymers held felodipine, danazol, celecoxib and praziquantel far longer than PVP or PVPVA (danazol dispersions crystallized after ≈56–70, ≈188–200 and ≈284–319 min with PVP, HPMC and HPMCAS) konno2008a R7; jackson2015 R5; xie2015 R1; polyzois2024 R3 (B F4), and in solution the best growth and nucleation inhibitors were cellulose derivatives of moderate hydrophobicity with ionized carboxyls, flexible synthetic chains mostly failing ilevbare2012c R10, R11; ilevbare2013b R9 (D F8). But the best polymer changed with the drug: PVPVA held delamanid as long as HPMCAS and HPMCP while HPMC did not duong2022a R4, R2 (B F4), the two polymers that held racemic praziquantel beyond 83 min held the R-enantiomer only 37 and 15.5 min polyzois2024 R2, R3, R4 (B F29), and a solution screen ranked dispersion dissolution only in order jackson2015 R5, X8; xie2015 C48 (B F6). A fast polymer with a fifth of a cellulosic inhibitor held released celecoxib for 16 h at some cost in rate xie2015 R6 (B F20).

Type. cross-chapter synthesis of 15 chapter findings (release of felodipine and six further drugs with five polymers; dispersion dissolution and solution screens of nine drugs; growth and induction-time screens of 16–34 polymers on up to nine drugs; ternary dispersions; humid storage) Strength. for the two release patterns and for the drug dependence of the best inhibitor, each replicated within its chapter (A F11, B F4, D F7); moderate for the cross-chapter trade-off, which no paper measured as release and inhibition of one drug with the same polymers in one design except posaconazole and celecoxib (B F20, F10).

How it was shown

Saboo and co-workers (2020) ranked neat polymers by water sorption and dissolved felodipine dispersions with five polymers, and Yang and co-workers (2021) compared PVPVA and HPMCAS for six drugs saboo2020a P3, P4, A2, M6. Ilevbare and co-workers (2012–2013) ranked 16–34 polymers by seeded growth and by induction time at the amorphous solubility ilevbare2012c R9; ilevbare2013c P9, P10, R6, and Konno and co-workers (2008) dissolved felodipine dispersions with PVP, HPMC and HPMCAS konno2008a P1, P3.

What the data show

Neat PVP took up ≈71 wt% water at 95% RH, PVPVA ≈47, HPMC ≈28, EUDS ≈13 and HPMCAS ≈10 saboo2020a R3, R4. Felodipine dispersions with 75% polymer reached 14.1 (HPMCAS), 4.9 (HPMC) and 2.3 µg/mL (PVP) konno2008a R7. The best growth inhibitor was CA 320S Sub 0.90 for ritonavir, HPMC for celecoxib and PVPVA or CA 320S Sub 0.90 for efavirenz ilevbare2013b R9.

systemmethod and conditionsresultids
felodipine with PVP, PVPVA, HPMC, HPMCAS, EUDScompacts, 5–50%; water uptakecliff at 10–15% for the hydrophilic three; HPMCAS and EUDS congruent to 50%, slower at 10%saboo2020a R3, R14, R15, C55
loratadine, miconazole, danazol in PVPVA and HPMCASpowders and compactsgradual decline with HPMCAS; loratadine about 86 against 4 µg/mL at 40%yang2021 R7, R8, R9, R10, C2
ritonavir films with PVP, PVPVA, HPMCAS after 97% RHfree drug, NTAnanodroplets lost with PVP and PVPVA, kept with HPMCASpurohit2017b R12, R13, R14, R7
ritonavir, efavirenz, celecoxib, 21 polymersinduction time at the amorphous solubilitybest only 2- to 6-foldilevbare2013c R9, R12
racemic and R-praziquantel, HPMCAS-MF and HPMC E5 LVinduction time at each amorphous solubilityracemate beyond 83 min; R-form 37 and 15.5 minpolyzois2024 R2, R3, R4
celecoxib 50% with PVP or PAA plus a fifth HPMCAS or HPMC16 h non-sink dissolutionsupersaturation held, release slowerxie2015 R6; xie2016a R14, R17
Fig. 14 of saboo2020a: normalized felodipine release rate against loading for PVPVA, HPMCAS and EUDS
Fig. 14 · saboo2020anormalized felodipine release rate against loading for PVPVA, HPMCAS and EUDS

PVPVA starts highest and drops by orders of magnitude after 15%, while HPMCAS and EUDS start lower and stay flat to 50% saboo2020a R14.

Why

The release patterns "appear to depend" on polymer hydrophobicity: water-induced phase separation "is likely the cause" of the limit with the three hydrophilic polymers, and the lower water uptake of HPMCAS and EUDS "conceivably" stays below what is needed to induce it saboo2020a C49, C43, C44, C54, C55. For inhibition, hydrophobicity "is likely" to set adsorption, and ionized carboxyls make the polymers amphiphilic ilevbare2012c C35, C36, C39, C40. (synthesis: the same property, hydrophobicity relative to water, works in opposite directions in release and in inhibition.)

Limits and transfer

The release patterns rest on felodipine with five polymers and four further drugs with two saboo2020a K5, X7, and loratadine compacts had a lower limit with HPMCAS (20%) than with PVPVA (30%) yang2021 R22, C2. Screen candidate polymers for the drug itself, by induction time at its amorphous solubility and by release over a loading series ilevbare2013c P9; polyzois2024 P3.

How it was shown

Konno and co-workers (2008) dissolved felodipine dispersions with PVP, HPMC and HPMCAS at 10–75% polymer under non-sink conditions konno2008a P1, P3 (B F4). Ilevbare and co-workers (2012–2013) ranked 16–34 polymers at 5 µg/mL by seeded growth and by induction time at the calculated amorphous solubility, and set the Fedors solubility parameter of each polymer against the drug's ilevbare2012c R9, E1, E2, E3; ilevbare2013c P9, P10, R6 (D F8, D F13). Jackson and co-workers (2015) timed crystallization from dissolving danazol films jackson2015 P1, P3 (B F4) against antisolvent solutions jackson2015 P7 (B F6), and Xie and Taylor (2015–2016) compared induction times with 50% celecoxib dispersions and made ternaries in which a fifth of the PVP or PAA was replaced by HPMCAS or HPMC xie2015 P4, P5, P1, A5; xie2016a P5, P10 (B F6, B F20). Mosquera-Giraldo and co-workers tested 26 polymers on telaprevir nucleation (2016) and pairs of carboxylated cellulose derivatives on nine drugs with simulations next to drug clusters (2018) mosqueragiraldo2016 P7; mosqueragiraldo2018a P3, P4, P6, P9, P11 (D F25, D F36). Purohit and Taylor (2017) stored ritonavir films at 97% RH before dissolution purohit2017b P7, P14, P12 (A F12). Saboo and co-workers (2020) ranked neat polymers by water sorption and contact angle and dissolved felodipine dispersions with five polymers, and Yang and co-workers (2021) compared PVPVA and HPMCAS for six drugs saboo2020a P3, P4, A2, M6 (A F11). Duong and co-workers (2022) and Polyzois and co-workers (2024) screened five and seven polymers in solution at the amorphous solubility of delamanid and of racemic and R-praziquantel and released the chosen dispersions duong2022a P4; polyzois2024 P2, P3, P8 (B F4, B F29).

What the data show

Release. Neat PVP took up ≈71 wt% water at 95% RH, PVPVA ≈47, HPMC ≈28, EUDS ≈13 and HPMCAS ≈10 saboo2020a R3, R4 (A F11). Ritonavir films showed the same split: HPMCAS films formed nanodroplets at every loading to 50%, PVP only to 20% and PVPVA only at 10% purohit2017b R11, R10 (A F11), and after storage at 97% RH PVP and PVPVA films no longer formed nanodroplets while HPMCAS films still spiked (≈131, ≈124 and ≈90 µg/mL at 10, 20 and 30%) purohit2017b R12, R13, R14, R7 (A F12). For loratadine, miconazole and danazol HPMCAS powders declined gradually where PVPVA fell off a cliff, loratadine releasing about 86 against 4 µg/mL at 40% yang2021 R7, R8, R9, R10, C2 (A F11); praziquantel–HPMCAS showed no release cliff up to 40% drug polyzois2024 R8, R9, C17 (B F10). Holding supersaturation. Felodipine dispersions with 75% polymer reached 14.1 (HPMCAS), 4.9 (HPMC) and 2.3 µg/mL (PVP); at 22 µg/mL celecoxib crystallized within 5 min with PAA, after about 1–2 h with PVP and not within 8–16 h with HPMCAS or HPMC konno2008a R7; xie2015 R1; xie2016a R3 (B F4). Among 14 cellulose esters those with a solubility parameter of 20.56–23.28 MPa^1/2 slowed ritonavir growth 1.64- to 2.98-fold and those of 19.62–20.41 gave 0.83–1.01 ilevbare2012c R10 (D F8); the best polymer lengthened the induction time only 2- to 6-fold for ritonavir, efavirenz and celecoxib at their amorphous solubility ilevbare2013c R9, R12 (D F13). For telaprevir HPMC gave about 243 min and HPMCAS about 175 against 14–15 min, and every effective new polymer carried a carboxylate mosqueragiraldo2016 R4, R5, R6 (D F25); across nine drugs the short-tether ester A5a beat its long-tether twin for every drug (atazanavir 40 → more than 300 against 65 min) mosqueragiraldo2018a R1, C8 (D F36). Drug dependence. The best growth inhibitor was CA 320S Sub 0.90 for ritonavir (12.6), HPMC for celecoxib (10.2) and PVPVA or CA 320S Sub 0.90 for efavirenz (about 4.9) ilevbare2013b R9 (D F7); 250 µg/mL PVP held amorphous indomethacin at 25 °C for 4 h, and for delamanid PVPVA, HPMCP and HPMCAS held more than 1000 min while HPMC gave about 50 min alonzo2010 R14; duong2022a R4, R2 (B F4). Without additives the induction time of one drug near its amorphous solubility differed up to about sixfold between protocols of the same group (atazanavir about 40 to 253 min) mosqueragiraldo2018a R1.b; enright2020 R2 (D F35). Combining. Replacing a fifth of PVP by HPMCAS or HPMC removed the desupersaturation of 50% celecoxib dispersions over 16 h (≈16.7–21.9 against ≈6.5 µg/mL) but slowed release (≈6.7–12.4 against ≈16.1 µg/mL at 2 h) xie2015 R6 (B F20).

chapter findingsystemmethod and conditionsresultids
A F11felodipine with PVP, PVPVA, HPMC, HPMCAS, EUDScompacts, 5–50%; water uptakecliff at 10–15% for the hydrophilic three; HPMCAS and EUDS congruent to 50%, slower at 10%saboo2020a R3, R14, R15, C55
A F11loratadine, miconazole, danazol in PVPVA and HPMCASpowders and compactsgradual decline with HPMCAS; loratadine about 86 against 4 µg/mL at 40%yang2021 R7, R8, R9, R10, C2
A F12ritonavir films with PVP, PVPVA, HPMCAS after 97% RHfree drug, NTAnanodroplets lost with PVP and PVPVA, kept with HPMCASpurohit2017b R12, R13, R14, R7
B F4felodipine, danazol, celecoxib, praziquantel, delamanid dispersions or solutionsnon-sink dissolution; solvent shift with polymercellulosics longest for four drugs; PVPVA as good as HPMCAS for delamanidkonno2008a R7; jackson2015 R5; xie2015 R1; polyzois2024 R3; duong2022a R4
D F7ritonavir, celecoxib, efavirenz, 16 polymersseeded growth, 5 µg/mLbest 12.6, 10.2 and about 4.9 with different polymersilevbare2013b R9
D F8ritonavir, 14 cellulose estersseeded growth against solubility parameterSP 20.56–23.28: 1.64–2.98-fold; SP 19.62–20.41: 0.83–1.01ilevbare2012c R10, R11
D F13ritonavir, efavirenz, celecoxib, 21 polymersinduction time at the amorphous solubilitybest only 2- to 6-foldilevbare2013c R9, R12
D F25telaprevir, 26 polymersinduction time, 150 µg/mLHPMC 243, HPMCAS 175 against 14–15 min; carboxylate neededmosqueragiraldo2016 R4, R5, R6
D F36nine drugs, short- against long-tether estersinduction time, 5 µg/mLshort tether better for all ninemosqueragiraldo2018a R1, C8
D F35atazanavir, posaconazole, ritonavir controlspolymer-free runs of several papersup to about sixfold between protocolsmosqueragiraldo2018a R1.b; enright2020 R2
B F6felodipine, danazol, celecoxib, praziquantel, delamanidsolution test against dispersion dissolutionrank order agreed in four of five systems, absolute times differedkonno2008a C31, C32; jackson2015 R5, X8; xie2015 C48
B F29racemic and R-praziquantel, HPMCAS-MF and HPMC E5 LVinduction time at each amorphous solubilityracemate beyond 83 min; R-form 37 and 15.5 minpolyzois2024 R2, R3, R4
B F20celecoxib 50% with PVP or PAA plus a fifth HPMCAS or HPMC16 h non-sink dissolutionsupersaturation held, release slowerxie2015 R6; xie2016a R14, R17

Figure

Fig. 14 of saboo2020a: normalized felodipine release rate against loading for PVPVA, HPMCAS and EUDS
Fig. 14 · saboo2020anormalized felodipine release rate against loading for PVPVA, HPMCAS and EUDS
PVPVA starts highest and drops by orders of magnitude after 15%, while HPMCAS and EUDS start lower and stay flat to 50% saboo2020a R14 (A F11).

Why

The release patterns "appear to depend" on polymer hydrophobicity: water-induced phase separation "is likely the cause" of the limit with the three hydrophilic polymers, and the lower water uptake of HPMCAS and EUDS "conceivably" stays below what is needed to induce it; at low loading the polymer sets the pace, so the fastest-dissolving polymers give the fastest release saboo2020a C49, C43, C44, C54, C55 (A F11). For inhibition, hydrophobicity "is likely" to set adsorption: a very hydrophilic polymer stays in solution, semirigid cellulose backbones lie flat, and ionized carboxyls make the polymers amphiphilic ilevbare2012c C35, C36, C39, C40 (D F8); for ritonavir the more hydrophobic, negatively charged cellulose polymers were effective and the hydrophilic uncharged ones not ilevbare2013d C30 (B F4). Contact with the emerging nucleus is "clearly a prerequisite", made through acetyl or ethyl groups by chains that ionized carboxylates keep extended mosqueragiraldo2018a C44, C50, C35 (D F36). A solution test misranks a polymer that also acts on the solid route and cannot see crystallization inside the particles alonzo2010 C45; xie2016a C31 (B F6). For R-praziquantel the authors give hedged reasons (different hydrate and conformation; chiral polymers binding one enantiomer) polyzois2024 C26, C28 (B F29). In the ternaries the fast polymer releases the drug and about 5 µg/mL of cellulosic blocks nucleation in solution xie2016a C24; xie2015 C53, C42 (B F20). (synthesis: the same property, hydrophobicity relative to water, works in opposite directions in the two chapters; a hydrophilic polymer dissolves fast and carries the drug out but separates from a hydrophobic drug on wetting and does not adsorb at its nuclei, while a moderately hydrophobic, ionizable cellulosic dissolves slowly but stays mixed with the drug and acts at its interfaces.)

Conditions and limits

The release patterns rest on felodipine with five polymers and four further drugs with two, and water uptake as the cause is weak to moderate saboo2020a K5, X7 (A F11). The solubility-parameter window rests on three drugs, adsorption was never measured, and hydrophobicity and carboxyl content of the new esters co-vary ilevbare2012c X10, X11; ilevbare2013c X1, X3 (D F8, D F13). The danazol solution comparator comes from a thesis and the celecoxib comparisons use different polymer levels in the two tests jackson2015 X16; xie2015 X8 (B F6). The R-praziquantel times have n = 2 and no statistical test polyzois2024 X12, X13 (B F29). Release of the inhibitor from the ternaries was not measured xie2015 C50 (B F20).

Counterexamples and conflicts

HPMCAS is not always the slower-releasing or the better polymer: elbasvir behaved alike with both polymers and loratadine compacts had a lower limit with HPMCAS (20%) than with PVPVA (30%) yang2021 R22, C2 (A F11); lipophilic weak bases that complex HPMCAS released poorly from it even at 5–10% (F10); PVPVA held delamanid as long as HPMCAS but its droplets grew duong2022a R4, R5 (B F6). For celecoxib HPMC matched HPMCAS in solution (≈6.35 µg/mL each at 240 min with felodipine) yet its 75% felodipine dispersions reached 4.9 against 14.1 µg/mL, reasons "not clear" konno2008a C31, C32, R12, R7 (B F6). The calculated solubility parameter did not predict the telaprevir order across chemistries, and a carboxylated ethyl cellulose ether with a solubility parameter far below celecoxib's worked well mosqueragiraldo2016 C25, R6; mosqueragiraldo2018a R2, R6 (D F25, D F13). Polymer pairs slowed ritonavir growth more than either polymer alone, but mostly at twice the total polymer ilevbare2012a R11, R12 (D F17).

Transfer check

Screen candidate polymers for the drug itself, by induction time at its amorphous solubility and by release over a loading series, since neither ranking transferred between drugs ilevbare2013c P9; polyzois2024 P3 (D F13, B F29); use a solution screen as a rank order only and confirm with the dispersion xie2015 C48; jackson2015 R5 (B F6), and compare inhibitors only as ratios to a control run in the same protocol mosqueragiraldo2018a R1.b; enright2020 R2 (D F35). If a hydrophilic polymer is chosen for fast release, keep the loading below its limit and test a minor cellulosic inhibitor in the dispersion, checking that the two polymers mix xie2016a C69 (B F20). For a dispersion that may meet humidity before use, dissolve it after 97% RH storage as well purohit2017b P7, P14 (A F12).

History

2008: Konno and co-workers ranked HPMCAS > HPMC > PVP for felodipine dispersions konno2008a R7 (B F4). 2012–2013: Ilevbare and co-workers screened 16–34 polymers on three drugs and found a hydrophobicity window with drug-dependent best polymers ilevbare2012c R10; ilevbare2013b R9; ilevbare2013c R9, R13 (D F8, D F7, D F13). 2015–2016: solution screens were tested against dispersion dissolution and ternary dispersions combined a fast polymer with a cellulosic inhibitor jackson2015 R5; xie2015 R6, C48; xie2016a R14 (B F6, B F20); telaprevir showed the need for ionized carboxylates mosqueragiraldo2016 R5, R6 (D F25). 2017: humid storage removed nanodroplets from PVP and PVPVA films but not from HPMCAS films purohit2017b R12, R14 (A F12). 2018: nine drugs confirmed the short-tether advantage mosqueragiraldo2018a R1 (D F36). 2020–2021: Saboo and co-workers and Yang and co-workers named the release trade-off between hydrophilic and hydrophobic polymers saboo2020a C55; yang2021 C2 (A F11). 2022–2024: PVPVA matched the enteric polymers for delamanid, and an inhibitor ranking failed to carry from racemic to R-praziquantel duong2022a R4; polyzois2024 R3, R4 (B F4, B F29).

Topic 4 of 5 · 2 findings · F10–F11

Enteric polymers and pH shifts

F10

Topic 4Enteric polymers and pH shifts1 of 2

The more an HPMCAS grade ionizes, the faster it releases the drug and the shorter the nucleation delay it gives.

For posaconazole at pH 6.5, nucleation came after 29 ± 5 min without polymer, 50 ± 4 min with HPMCAS-LF, 208 ± 13 min with HPMCAS-MF and not within 240 min with HPMCAS-HF shah2025 R3. From dispersions the HF grade released only about 22–31 µg/mL at pH 6.5 shah2025 R4, R5. Neat LF, MF and HF dissolved at about 1.50, 0.90 and 0.45 mg/min/cm², in the order of their acid groups per gram bapat2025a R1, R2, M3, M4, M5.

strongStrong for the grade order of release and of inhibition, each measured directly in triplicate, and for the effect of buffer capacity; moderate for complexation as the cause of poor release, a correlation across drugs measured in a solution test shah2025 R3; bapat2025a R2; bapat2023 R5; bapat2024 X10.

Posaconazole, 10 µg/mL at pH 6.5: nucleation delay, minno polymer29 ± 5HPMCAS-LF1.52 mmol/g acid groups50 ± 4HPMCAS-MF1.19 mmol/g acid groups208 ± 13HPMCAS-HF0.76 mmol/g acid groupsnone within 240

The grade with the fewest acid groups delayed nucleation longest. shah2025 R3; bapat2025a M3, M4, M5

Neat HPMCAS in pH 6.8 phosphate: dissolution rate, mg/min/cm²HPMCAS-LFabout 1.50HPMCAS-MFabout 0.90HPMCAS-HFabout 0.45

Release runs the other way: 25% loratadine left LF about 25 times faster than HF. bapat2025a R1, R2

For your drug

  1. For an HPMCAS dispersion, measure nucleation delay and release with each candidate grade at two or three pH values between 5.5 and 7.5, and run release in buffers of the capacity expected in vivo as well as in 50 mM phosphate.
  2. For a weak base with a pKa above the gel pH of about 6, spike drug and polymer into pH 6.0 buffer and measure the polymer left; a large loss predicts poor release, for which the grade with the most acid groups or a polymer salt are the levers tested.

shah2025 P4, P5, P6; bapat2023 R5, R7; bapat2024 P9, R12; bapat2025a R2; qi2022 R14

How it works and key numbers
  1. A carboxylic polymer must ionize before its chains dissolve; ionization releases protons at the surface, so the surface pH lies below the bulk and buffer species and capacity set the rate qi2022 C11, C24, C23; bapat2023 C33, C36, C38.
  2. A pre-ionized polymer salt generates no protons at its surface ("is attributed to") qi2022 C42, C31.
  3. The affinity of HPMCAS for posaconazole rises with the acetyl-to-succinoyl ratio and with lower pH, while its affinity for water does the opposite shah2025 C48, C16, C17.
  4. A lipophilic drug cation pairs with the carboxylate as an insoluble hydrophobic ion pair, which "likely largely accounts" for poor release bapat2024 C33, C34, C35, C32.
  5. (synthesis: the hydrophobic, un-ionized part of HPMCAS is what the inhibition studies credit and the ionized part is what the release studies credit, so a grade or pH that favours one costs the other shah2025 C48; bapat2025a C26, C25.)
0.6–1.2 pH unitsgel of dissolving HPMCAS-MF more acidic than the pH 6.8 mediumbapat2023 R15, R16
8.6 → 84–90%release of 20% miconazole when HP-50 was pre-ionized as a saltqi2022 R14, R15
70–96%HPMCAS taken out of solution by lipophilic weak bases ionized at the gel pHbapat2024 R12; kaur2025 R5
Evidence: data, conditions and papers

Finding F10. The ionization of an enteric polymer sets its release and its inhibition in opposite directions: more acid groups and a more ionized gel dissolve HPMCAS faster and release more drug, while more acetyl and less ionization delay nucleation longer; lipophilic weak bases that pair with the ionized polymer release poorly

In short. For posaconazole, 10 µg/mL at pH 6.5 nucleated after 29 ± 5 min without polymer, 50 ± 4 min with HPMCAS-LF, 208 ± 13 min with HPMCAS-MF and not within 240 min with HPMCAS-HF, every grade weakening as pH rose to 7.5, yet from dispersions the HF grade released only about 22–31 µg/mL at pH 6.5 and the LF grade released at every pH but lost the drug within 3 h shah2025 R3, R4, R5 (D F44). In the release chapter neat LF, MF and HF dissolved at about 1.50, 0.90 and 0.45 mg/min/cm² in pH 6.8 phosphate, and 25% loratadine left LF about 25 times faster than HF, in the order of acid groups per gram (1.52, 1.19, 0.76 mmol/g) bapat2025a R1, R2, M3, M4, M5 (A F33); HPMCAS-MF dissolved about six times faster in strong than in weak pH 6.8 phosphate, its gel being 0.6–1.2 pH units more acidic than the medium bapat2023 R5, R15, R16 (A F23), and pre-ionizing HP-50 as a salt raised 20% miconazole release from about 8.6 to 84–90% qi2022 R14, R15 (A F24). Lipophilic weak bases ionized at the gel pH took 70–96% of HPMCAS out of solution and released poorly even at 5–10% loading bapat2024 R12; kaur2025 R5, R13, R14 (A F32). In solution, carboxylated cellulose esters lost most of their growth inhibition at pH 3.8 although more polymer adsorbed ilevbare2012b R7, R9 (D F11), and HPMCAS on felodipine changed from an even layer at pH 6.8 to separate globules at pH 3 schram2015 R4, R7, R10 (D F23).

Type. cross-chapter synthesis of 11 chapter findings (HPMCAS grades and HP-50 with posaconazole, loratadine, cinnarizine, bedaquiline, miconazole, indomethacin; carboxylated esters with ritonavir, celecoxib, telaprevir; adsorbed HPMCAS imaged on felodipine; acidified suspensions of lopinavir and celecoxib dispersions) Strength. for the grade order of release and of inhibition, each measured directly in triplicate (D F44, A F33); strong for the buffer-capacity dependence (A F23); moderate for complexation as the cause of poor release, a correlation across drugs (A F32); weak to moderate for the conformational explanation of inhibition (D F11, D F23).

How it was shown

Ilevbare and co-workers (2012) compared seeded growth with carboxylated cellulose esters at pH 6.8 and 3.8 ilevbare2012b P7, P8, P9. Bapat and co-workers dissolved HPMCAS-MF in phosphate of 3–51 mM/ΔpH (2023) and measured the polymer left in solution with eight drugs at pH 6.0 (2024) bapat2023 A3, P14; bapat2024 P3, P7, P9. Shah and Taylor (2025) measured posaconazole induction times and release with three HPMCAS grades at pH 5.5–7.5 shah2025 P4, P5, P6.

What the data show

CAP Adp 0.85 fell from a growth ratio of 2.98 at pH 6.8 to 1.12 at pH 3.8 ilevbare2012b R7, R9. At one drug per succinoyl group the polymer lost from solution at pH 6.0 was 5% (indomethacin), 15% (ritonavir), 17% (cilnidipine), 70% (loratadine) and 90% (cinnarizine) bapat2024 R12, R5, X2.

systemmethod and conditionsresultids
felodipine with HPMCAS-LFrotating disc; in-liquid AFM2.29 at pH 6.8, 1.28 at pH 3; globules at pH 3, thin layer at pH 6.8schram2015 R4, R7, R10, R12
posaconazole with HPMCAS LF, MF, HFinduction time; 3 h release of 10 and 25 wt% dispersions at pH 5.5–7.550, 208, >240 min; HF about 5 µg/mL at pH 5.5; LF released but crashedshah2025 R3, R4, R5
HP-50, HPMCAS-MF, 10% indomethacinbuffers of 3–51 mM/ΔpH; gel pH dyesabout sixfold faster in strong buffer; gel 0.6–1.2 pH units below the mediumqi2022 R12, R2; bapat2023 R5, R15, R16
HP-50 and nine salts; 20% miconazolecompacts, pH 6.8salts 2.35–3.09 against 0.92 mg/min/cm²; release 84–90 against 8.6%qi2022 R3, R10, R14, R15
loratadine, cinnarizine in LF, MF, HFcompacts at pH 6.8 and 7.5; titrationrelease LF > MF > HF; acid groups 1.52, 1.19, 0.76 mmol/gbapat2025a R1, R2, R3, M3, M4, M5
Fig. 9 of shah2025: HPMCAS left in solution after removing the posaconazole droplets
Fig. 9 · shah2025HPMCAS left in solution after removing the posaconazole droplets

The high-acetyl grade loses most polymer into the droplets and is the grade that delays nucleation longest and releases least at low pH shah2025 R17, R3.

Why

Shah and Taylor reason that the affinity of HPMCAS for posaconazole rises with the acetyl-to-succinoyl ratio and with lower pH, and its affinity for water does the opposite shah2025 C48, C16, C17. For release a carboxylic polymer must ionize before its chains dissolve, and the surface pH lies below the bulk, so buffer species and capacity set the rate qi2022 C11, C24, C23; bapat2023 C33, C36, C38. A lipophilic drug cation pairs with the carboxylate as an insoluble hydrophobic ion pair, which "likely largely accounts" for poor release bapat2024 C33, C34, C35, C32.

Limits and transfer

The posaconazole trade-off is one drug, three grades and three pH values in a buffer without bile salt shah2025 M2, P1. Measure nucleation delay and release with each candidate grade at two or three pH values between 5.5 and 7.5 shah2025 P4, P5, P6; for a weak base, spike drug and polymer into pH 6.0 buffer and measure the polymer left bapat2024 P9, R12.

How it was shown

Ilevbare and co-workers (2012–2013) compared seeded growth ratios with carboxylated cellulose esters at pH 6.8 and 3.8, with HPMC as non-ionizable control, and measured adsorption by depletion ilevbare2012b P7, P8, P9; ilevbare2013b P12, P13 (D F11). Schram, Beaudoin and Taylor (2015) measured felodipine growth on a rotating disc with 5 µg/mL HPMCAS-LF at pH 3 or 6.8 and imaged the adsorbed polymer by in-liquid AFM schram2015 P2, E4, P3, P4 (D F23). Chen and co-workers (2015) and Li and co-workers (2016) suspended HPMCAS and HPMCP dispersions in pH 3 or 5 buffer with and without surfactant and assayed drug and dissolved polymer chen2015a P10, P11, P12; li2016b P1, P4, P7 (B F15). Qi and Taylor (2022) dissolved HP-50 and nine of its salts in pH 6.8 buffers of different species and capacity and released 20% miconazole dispersions qi2022 P10, A2, A4, P1, M2, P2, P11, P12, A6 (A F23, A F24). Bapat and co-workers (2023) dissolved neat HPMCAS-MF and its indomethacin dispersions in phosphate of 3–51 mM/ΔpH, read the gel pH with dyes bapat2023 A3, P14, P10, A4 (A F23) and made the triethylamine salt bapat2023 P4 (A F24). Bapat and co-workers (2024) released HPMCAS-MF dispersions of eight drugs and spiked drug and polymer from THF into pH 6.0 buffer to measure the polymer left in solution, and Kaur and co-workers (2025) did so for bedaquiline bapat2024 P3, P7, P9, E2; kaur2025 P7, P11 (A F32). Bapat and Taylor (2025) released 25% loratadine and cinnarizine dispersions in three HPMCAS grades and titrated the grades bapat2025a M1, M2, P5, P6, P8, P9 (A F33). Shah and Taylor (2025) measured posaconazole induction times with three grades at pH 5.5–7.5 and released 10 and 25 wt% dispersions for 3 h shah2025 P4, P5, P6 (D F44).

What the data show

Inhibition and ionization. CAP Adp 0.85 fell from a growth ratio of 2.98 at pH 6.8 to 1.12 at pH 3.8 while its adsorption plateau rose from about 27 to 41 mg/m², and HPMC stayed at about 2.2–2.3 ilevbare2012b R7, R9 (D F11); at pH 3.0 two carboxylated cellulose esters fell from about 68 and 105 min to about 9 and 8 min against telaprevir nucleation mosqueragiraldo2016 R7 (D F25). HPMCAS-LF slowed felodipine growth 2.29-fold at pH 6.8 and 1.28-fold at pH 3, where it sat as globules of 15.4 nm radius about 44 nm apart schram2015 R4, R10, R12, R13 (D F23). Above the polymer pKa the direction reversed: between pH 5.5 and 7.5 more ionization shortened the posaconazole delay for every grade (MF: more than 240, 208 ± 13 and 136 ± 14 min) shah2025 R3 (D F44); the higher-acetyl grades gave smaller, less charged droplets that held more polymer (about 0.05, 0.14 and 0.31 weight fraction for L, M and H) shah2025 R11, R15, R17 (D F44). Release and ionization. Neat HPMCAS-MF released about 0.16, 0.26, 0.59, 0.89 and 1.01 mg/min/cm² at 3–51 mM/ΔpH and nothing at pH 5.0, and 10% indomethacin left at the polymer's pace, so drug release rose about sevenfold to eightfold over the buffer series bapat2023 R5, R7, R8, R9, R10, R13 (A F23). Nine HP-50 salts dissolved at about 2.35–3.09 against 0.92 mg/min/cm², and the sodium salt kept about 2.45 in 5 mM phosphate where HP-50 fell to 0.14 qi2022 R3, R10, R12 (A F24). At 25% and pH 6.8 loratadine released at about 0.25, 0.10 and 0.01 mg/min/cm² from LF, MF and HF, and cinnarizine at about 0.13 (LF), 0.014 (MF) and too slowly to measure from HF; at pH 7.5 the gap fell below twofold bapat2025a R2, R3 (A F33). In posaconazole release the HF grade held about 92–98 µg/mL at pH 7.5 but released only about 5 µg/mL at pH 5.5, and MF held about 92 µg/mL for 3 h at pH 6.5 (10 wt%) but released 15–25 µg/mL at pH 5.5 shah2025 R4, R5 (D F44). Weak bases. At one drug per succinoyl group the polymer lost from solution at pH 6.0 was 5% (indomethacin), 15% (ritonavir), 17% (cilnidipine), 70% (loratadine) and 90% (cinnarizine), and at 25% loading the polymer left the cinnarizine dispersion about 30 times more slowly than neat HPMCAS bapat2024 R12, R5, X2 (A F32). Acid. At pH 3 the suspension liquid of celecoxib–HPMCAS particles held about 3.5 µg/mL HPMCAS without surfactant, and at pH 5 with SDS HPMCAS-LF dissolved from lopinavir dispersions to about 290–330 µg/mL chen2015a R18; li2016b R13, R16 (B F15).

chapter findingsystemmethod and conditionsresultids
D F11ritonavir, celecoxib with carboxylated esters; posaconazole with HPMCASseeded growth at pH 6.8 and 3.8; induction time at pH 5.5–7.5CAP Adp 0.85 2.98 → 1.12; more ionization above the pKa shortened the posaconazole delayilevbare2012b R7, R9; ilevbare2013b R13; shah2025 R3
D F23felodipine with HPMCAS-LFrotating disc; in-liquid AFM2.29 at pH 6.8, 1.28 at pH 3; globules at pH 3, thin layer at pH 6.8schram2015 R4, R7, R10, R12
D F25telaprevir with carboxylated estersinduction time at pH 6.8 and 3.0about 68 and 105 → 9 and 8 minmosqueragiraldo2016 R7
D F44posaconazole with HPMCAS LF, MF, HFinduction time; 3 h release of 10 and 25 wt% dispersions at pH 5.5–7.550, 208, >240 min; HF about 5 µg/mL at pH 5.5; LF released but crashedshah2025 R3, R4, R5
A F23HP-50, HPMCAS-MF, 10% indomethacinbuffers of 3–51 mM/ΔpH; gel pH dyesabout sixfold faster in strong buffer; gel 0.6–1.2 pH units below the mediumqi2022 R12, R2; bapat2023 R5, R15, R16
A F24HP-50 and nine salts; 20% miconazolecompacts, pH 6.8salts 2.35–3.09 against 0.92 mg/min/cm²; release 84–90 against 8.6%qi2022 R3, R10, R14, R15
A F32eight drugs in HPMCAS-MF; bedaquiline in LF and MFpH 6.0 spike test; compactsweak bases 70–96% of polymer complexed; 5–10% bedaquiline released 17–30%bapat2024 R12, R5; kaur2025 R5, R13, R14
A F33loratadine, cinnarizine in LF, MF, HFcompacts at pH 6.8 and 7.5; titrationrelease LF > MF > HF; acid groups 1.52, 1.19, 0.76 mmol/gbapat2025a R1, R2, R3, M3, M4, M5
B F15celecoxib–HPMCAS at pH 3; lopinavir with HPMCAS grades at pH 5suspensions, dissolved polymerabout 3.5 µg/mL polymer without surfactant; LF 290–330 µg/mL with SDS at pH 5chen2015a R18; li2016b R13, R16

Figure

Fig. 9 of shah2025: HPMCAS left in solution after removing the posaconazole droplets
Fig. 9 · shah2025HPMCAS left in solution after removing the posaconazole droplets
The high-acetyl grade loses most polymer into the droplets and is the grade that delays nucleation longest and releases least at low pH shah2025 R17, R3 (D F44).

Why

In solution, ionized chains are proposed to lie extended on the crystal while less ionized ones are condensed ("most likely"), since more polymer adsorbed at pH 3.8 ilevbare2012b C26, C29, C30, C31 (D F11); at pH 3 the gaps between globules "leave a large number of felodipine growth sites open" schram2015 C24, C17 (D F23). Above the pKa Shah and Taylor reason from amphiphilicity: the affinity of HPMCAS for posaconazole rises with the acetyl-to-succinoyl ratio and with lower pH, its affinity for water does the opposite, and incomplete release at lower pH "could be attributed" to the lower solubility of the more hydrophobic grades shah2025 C48, C16, C17 (D F44). For release both enteric-polymer papers take a framework in which a carboxylic polymer must ionize before its chains dissolve, ionization releases protons at the surface, and the surface pH lies below the bulk, so buffer species and capacity set the rate qi2022 C11, C24, C23; bapat2023 C33, C36, C38 (A F23); a pre-ionized polymer generates no protons at its surface ("is attributed to") qi2022 C42, C31 (A F24). A lipophilic drug cation pairs with the carboxylate as an insoluble hydrophobic ion pair, which "likely largely accounts" for poor release bapat2024 C33, C34, C35, C32 (A F32), and LF keeps "spare" carboxylates free to hydrate bapat2025a C26, C25 (A F33). (synthesis: the hydrophobic, un-ionized part of HPMCAS is what the inhibition chapters credit and the ionized part is what the release chapters credit; a grade or a pH that shifts the balance toward one costs the other, and a weakly basic drug that neutralizes carboxylates moves a dispersion toward the poorly releasing side.)

Conditions and limits

The posaconazole trade-off is one drug, three grades and three pH values in a buffer without bile salt shah2025 M2, P1 (D F44). The gel pH is an average from dyes and the interfacial pH and solubility were not measured bapat2023 X5 (A F23). The polymer salt was tested at one loading of one drug qi2022 C39, C41 (A F24). Complexation was measured in a solution test, not in the dissolving gel, and at a different pH from release bapat2024 X10; kaur2025 X14 (A F32); MF data of the grade study are cited bapat2025a X7 (A F33). The conformational reading of inhibition rests on images at one polymer concentration and two pH values schram2015 X7 (D F23).

Counterexamples and conflicts

HPMC, which does not ionize, held its growth inhibition at pH 3.8 and in salt ilevbare2012b R9; ilevbare2013b R10, R12 (D F11). The weak bases complexed HPMCAS to very different extents: ritonavir and cilnidipine took only 15–17% of the polymer, and ritonavir slowed it only 1.6-fold bapat2024 R12, R5 (A F32). Posaconazole, a weak base, inhibited best with the grade it loaded most, while its release suffered at low pH, not from complexation shah2025 R17, R3, R4 (D F44). FaSSIF left neat HPMCAS-MF at its blank-buffer rate bapat2023 R5, R7 (A F23), but broke the bedaquiline–HPMCAS complex and raised its release about fivefold (F12).

Transfer check

For an HPMCAS dispersion, measure nucleation delay and release with each candidate grade at two or three pH values between 5.5 and 7.5 shah2025 P4, P5, P6 (D F44), and run release in buffers of the capacity expected in vivo as well as in 50 mM phosphate bapat2023 R5, R7 (A F23). For a weak base with a pKa above the gel pH of about 6, spike drug and polymer into pH 6.0 buffer and measure the polymer left: a large loss predicts poor release, for which the grade with the most acid groups or a polymer salt are the levers tested bapat2024 P9, R12; bapat2025a R2; qi2022 R14 (A F32, A F33, A F24).

History

2012–2013: Ilevbare and co-workers found carboxylated esters losing growth inhibition at low pH although more polymer adsorbed ilevbare2012b R7, R9; ilevbare2013b R13 (D F11). 2015: Schram and co-workers imaged HPMCAS as globules at pH 3 and an even layer at pH 6.8 schram2015 R7, R10 (D F23); Chen and co-workers measured how little HPMCAS dissolves in acid chen2015a R18 (B F15). 2016: telaprevir confirmed the loss at pH 3.0 mosqueragiraldo2016 R7 (D F25), and Li and co-workers found HPMCAS-LF dissolving at pH 5 with SDS li2016b R13, R16 (B F15). 2022–2023: Qi and Taylor and Bapat and co-workers tied enteric-polymer release to buffer capacity and an acidic gel and showed polymer salts escaping it qi2022 R12, R14; bapat2023 R15, R16 (A F23, A F24). 2024–2025: weak bases were found to complex HPMCAS and release poorly, LF releasing them best bapat2024 R12; bapat2025a R2; kaur2025 R5 (A F32, A F33), and Shah and Taylor set the grade order of inhibition against that of release shah2025 R3, R4 (D F44).

F11

Topic 4Enteric polymers and pH shifts2 of 2

Whether the drug forms amorphous or crystalline material before the pH rise decides release after it.

After a pH rise ten weak bases precipitated either as crystals that ended supersaturation within 3.1–14.7 min or as amorphous solids that held 7.2–20.7 times the crystalline solubility hsieh2012 R1, R5, R10. Indomethacin nanodroplets formed at pH 2.2 redissolved within about 2 min after a shift to pH 5, whereas small α crystals formed in acid recovered only to 32.1 of 40 µg/mL xie2017 R10, R20, R19, R23. Posaconazole and delamanid dispersions crystallized in acid, where the enteric polymer stays undissolved, and an enteric coat kept release at ≈76–86 µg/mL of 100 after any gastric stage elkhabaz2019a R10, R16; nguyen2023c R19, R20; nguyen2023b R10, R2.

moderateModerate: crystals in acid were seen directly by SHG, PLM and SEM and release after the gastric stage was measured for every combination, but the step from these crystals to lower release is inferred without a seeding test, and each pazopanib condition is a single trace elkhabaz2019a X6; nguyen2023c R11, X10; sugihara2018 X15.

below Sa: only crystallization possibleabove Sa: non-crystalline colloids≈0.5×: could only crystallize≈5.4×: held 22–30 µg/mL≈54×: held ≈17 µg/mL110100pazopanib dose over amorphous solubility, pH 6.5 (log)

Pazopanib HCl shifted from simulated gastric fluid to pH 6.5; the amorphous solubility there is 19.8 µg/mL. sugihara2018 R8, R11, R12, R15, R20

Delamanid salt dispersion, HPMCP-55: final release after transfer, %after gastric pH 1.6≈94.5after gastric pH 3.0≈80.5after gastric pH 5.0≈12.5

A single stage at pH 6.5 does not show this spread; coated HPMCP-50 tablets gave ≈76–86 µg/mL of 100 after any gastric stage. nguyen2023c R11; nguyen2023b R10, R2

For your drug

  1. Place the intestinal dose on the pH-solubility diagram of the crystalline and the amorphous form at the intestinal pH before choosing the test.
  2. For a weak base with an enteric polymer, suspend the dispersion in gastric medium at two or more pH values and look for crystals by SHG, PLM or SEM; run the two-stage test at pH 1.6, 3.0 and 5.0, and if crystals form in acid test an enteric coat, checking its integrity at pH 4.5–5.0.

sugihara2018 C45, R20; elkhabaz2019a P10; nguyen2023c R15, C46, C5; nguyen2023b R7, C2

How it works and key numbers
  1. Below the crystalline solubility the solution is subsaturated; between the two solubilities crystallization is the only possible change; above the amorphous solubility the drug separates as amorphous colloids and the solution stays at the amorphous solubility until crystallization depletes it sugihara2018 C33, C34, C36.
  2. The indomethacin droplets disappeared on the pH rise, "consistent with" the higher amorphous solubility of the ionized drug, and the in situ crystals dissolved faster "likely" because of their very small size xie2017 C40, C42, C47, C48.
  3. With crystal-free dispersions and a subsaturated gastric solution "Solution-phase crystallization cannot occur", so the crystals formed in the undissolved, water-plasticized matrix and were carried into the intestinal stage elkhabaz2019a C34, C35, C56.
  4. For delamanid the small crystal mass is still "potentially catastrophic" because the crystals "can act as seeds" nguyen2023c C43, C46, C44.
  5. At gastric pH HPMCP is unionized and insoluble and inhibits crystallization poorly; the coat keeps the medium away during the gastric stage nguyen2023b C35, C37, C43, C46.
3.1–14.7 min vs 7.2–20.7×crystalline precipitates ended supersaturation; amorphous ones held this multiple of the crystalline solubilityhsieh2012 R1, R5, R10
about 68%crystallized share of the undissolved drug of a 50% posaconazole–HPMCAS dispersion in gastric fluidelkhabaz2019a R10, R16, R20
≈94.5, ≈80.5, ≈12.5%final release of the delamanid HPMCP-55 dispersion after gastric pH 1.6, 3.0 and 5.0nguyen2023c R11
Evidence: data, conditions and papers

Finding F11. In a gastric-to-intestinal sequence what forms before the pH rise decides the outcome: amorphous precipitates and droplets redissolved or held the intestinal amorphous solubility, whereas crystals formed in acid, in solution or in an undissolved enteric matrix, cut release after transfer; an enteric coat prevented this, and a single stage at pH 6.5 missed it

In short. After a pH rise ten weak bases precipitated either as crystals that ended supersaturation within 3.1–14.7 min or as amorphous solids (Tg 28–56 °C) that held 7.2–20.7 times the crystalline solubility, in all ten cases matching the solid left behind hsieh2012 R1, R5, R10 (D F1). For pazopanib HCl shifted from simulated gastric fluid to pH 6.5 the dose relative to the amorphous solubility at the intestinal pH decided: at about 54 and 5.4 times it formed non-crystalline colloids and held about 17 and 22–30 µg/mL (amorphous solubility 19.8 µg/mL), at about 0.5 times it could only crystallize sugihara2018 R8, R11, R12, R15, R20 (C F23). Indomethacin nanodroplets formed at pH 2.2 redissolved within about 2 min after a shift to pH 5 and reached 39.1 of 40 µg/mL, whereas small α crystals formed in acid recovered only to 32.1 µg/mL xie2017 R10, R20, R19, R23 (B F21). In acid, where the enteric polymer stays undissolved, posaconazole–HPMCAS and delamanid dispersions crystallized while the medium was subsaturated or only modestly supersaturated, about 68% of the undissolved drug at 50% posaconazole elkhabaz2019a R10, R1, R16, R20; nguyen2023c R19, R20 (B F24), and after transfer delamanid salt dispersions ended anywhere from about 0 to 101% depending on gastric pH and grade, which pH 6.5 alone did not show nguyen2023c R11 (B F25). An enteric coat kept release after any gastric stage at ≈76–86 µg/mL of 100 nguyen2023b R10, R2 (B F27).

Type. cross-chapter synthesis of 10 chapter findings (pH-shift precipitation of weak bases and weak acids, a weak-base salt, two-stage dissolution of dispersions with EPO, HPMC, HPMCAS and HPMCP, coated tablets; pazopanib, indomethacin, posaconazole, delamanid, praziquantel and 14 drugs in pH-shift tests) Strength. : crystals in acid are seen directly by SHG, PLM and SEM (B F24) and release after the gastric stage is measured for every combination (B F25), but the step from these crystals to lower release is inferred without a seeding test, and each pH-shift condition of pazopanib and indomethacin is a single trace or of unstated replicates (C F23, B F21).

How it was shown

Elkhabaz and co-workers (2019) held crystal-free posaconazole–HPMCAS-MF dispersions in FaSSGF before a shift to FaSSIF elkhabaz2019a P1, P6, P10, P11. Xie and co-workers (2017) dissolved indomethacin dispersions at pH 2.2, raised the pH to 5 or 6.8 and identified the precipitate xie2017 P7, P8, P13. Nguyen and co-workers (2023) released delamanid salt dispersions at pH 6.5 alone or after 60 min at pH 1.6, 3.0 or 5.0, and coated HPMCP tablets nguyen2023c P5, P6, P7, P8; nguyen2023b P1, P2, P3.

What the data show

Posaconazole–HPMCAS dispersions released only 7.5–11.5% of the dose in FaSSGF, below the crystalline solubility of 115.1 µg/mL, yet SHG found crystals in every system after 30 min elkhabaz2019a R10, R1, R16, R20. After pH 1.6, 3.0 or 5.0 the HPMCP-55 delamanid dispersion ended at ≈94.5, ≈80.5 and ≈12.5% nguyen2023c R11.

systemmethod and conditionsresultids
clotrimazole, atazanavir, nicardipineLLPS across pHtotal 30- to 65-fold higher at low pH; un-ionized part constantindulkar2015 R18, R5, R6, R7, R9, F2
glyburide, warfarin, papaverine, dipyridamole with nine polymerspH shift, WAXS to 6 hacids amorphous with most polymers; bases crystalline with allhsieh2014 R4, R12
indomethacin with EPO and HPMCpH 2.2 then pH 5 or 6.8droplets redissolved in about 2 min; in situ α crystals to 32.1 of 40 µg/mL; pH 6.8 hid the differencexie2017 R10, R20, R19, R23, R22
delamanid salt dispersions, five grades; praziquantelgastric pH 1.6, 3.0, 5.0 then pH 6.5final release about 0–101%; praziquantel 92–103% after pH 1.6, 62–77% after 3.0 or 5.0nguyen2023c R11, R13; alvarenga2025 R4, R7, R10, R13
delamanid–HPMCP-50 tablets, coated and uncoatedtwo-stage tests; coat integritycoated ≈76–86 µg/mL after any gastric stage; uncoated ≈0.3–93nguyen2023b R10, R2, R1, R7
Fig. 9 of sugihara2018: pH-solubility diagram of pazopanib with the three doses
Fig. 9 · sugihara2018pH-solubility diagram of pazopanib with the three doses

The three doses at pH 6.5 fall above the amorphous curve, between the curves and below the amorphous curve, the three outcomes of the test sugihara2018 C45, R20.

Why

Above the amorphous solubility the drug separates as amorphous colloids, and between the boundaries crystallization is the only possible change sugihara2018 C33, C34, C36. With crystal-free dispersions and a subsaturated gastric solution "Solution-phase crystallization cannot occur", so the crystals formed in the undissolved, water-plasticized matrix elkhabaz2019a C34, C35, C56. At gastric pH HPMCP is unionized and insoluble and inhibits crystallization poorly; the coat keeps the medium away during the gastric stage nguyen2023b C35, C37, C43, C46.

Limits and transfer

For praziquantel and most delamanid dispersions a gastric pH of 3.0 or 5.0 gave lower final release than pH 1.6 alvarenga2025 R4, R7; nguyen2023c R11. Suspend the dispersion in the gastric medium at two or more pH values and look for crystals by SHG, PLM or SEM, since PXRD missed crystal levels that still harmed release elkhabaz2019a P10; nguyen2023c R15, C46; if crystals form in acid, test an enteric coat nguyen2023b R7, C2.

How it was shown

Hsieh and co-workers (2012) precipitated ten weak bases by a pH rise in a potentiometric titration at 37 °C and characterized the precipitates hsieh2012 R1, R5 (D F1); in 2014 they shifted four ionizable drugs with nine polymers at 1 mg/mL and followed the solid by polarized light and synchrotron WAXS for 6 h hsieh2014 P2, P3, P4, P6, P7 (D F16). Indulkar and co-workers (2015) measured the LLPS concentration of three weak bases across pH indulkar2015 R18, F2 (C F10). Xie and co-workers (2017) dissolved indomethacin dispersions at pH 2.2 for 1 h, raised the pH to 5 or 6.8, checked UV by HPLC and identified the precipitate by SHG, Raman, PXRD and SEM xie2017 P7, P8, P9, P12, P13, P14, P15 (B F21). Sugihara and Taylor (2018) dissolved pazopanib HCl at three fractions of the clinical dose in simulated gastric fluid with 0–150 µg/mL HPMC and transferred it to pH 6.5 buffer sugihara2018 P6 (C F23). Elkhabaz and co-workers (2019) held crystal-free 10, 25 and 50% posaconazole–HPMCAS-MF dispersions in FaSSGF for 60 min before a shift to FaSSIF and imaged them by SHG elkhabaz2019a P1, P6, P10, P11 (B F24). Nguyen and co-workers (2023) laid films of delamanid salt dispersions with five enteric grades on acid media at pH 1.6, 3.0 and 5.0, released tablets at pH 6.5 alone or after 60 min at each gastric pH, and coated HPMCP tablets with Acryl-EZE II nguyen2023c P13, P14, P5, P6, P7, P8; nguyen2023b P1, P2, P3, P10, P11, P12 (B F24, B F25, B F27). Alvarenga and co-workers (2025) started praziquantel dispersions for 1 h at pH 1.6, 3.0 or 5.0 before the intestinal stage alvarenga2025 P10, P11 (B F25).

What the data show

Before the pH rise. For weak bases the total LLPS concentration rose 30- to 65-fold as pH fell below the pKa while the un-ionized part stayed nearly constant (clotrimazole 7.7 µg/mL at pH 8 and 490.2 at pH 4) indulkar2015 R18, R5, R6, R7, R9, F2 (C F10), so a dose that dissolves in acid can lie far above the amorphous solubility at intestinal pH. Posaconazole–HPMCAS dispersions released only 7.5–11.5% of the dose in FaSSGF, below the crystalline solubility of 115.1 µg/mL, yet SHG found crystals in every system after 30 min (0.026–0.050% of the undissolved drug at 10–25%) elkhabaz2019a R10, R1, R16, R20 (B F24); delamanid films were covered with star- and needle-shaped crystals after 1 h at pH 3.0, more with HPMCAS grades, while PXRD of the powders detected none nguyen2023b R3, R4; nguyen2023c R19, R20, R15 (B F24). The delamanid gastric supersaturation ratio rose from ≈0.9–3.8 at pH 1.6 to ≈11–42 at pH 5.0 but did not predict final release nguyen2023c R13, C39 (B F25). After the pH rise. The pH-shift precipitates of glyburide and warfarin stayed amorphous for at least 6 h with eight and six of nine polymers, warfarin holding 103–224 µg/mL, but all papaverine and dipyridamole precipitates were birefringent hsieh2014 R4, R12 (D F16). HPMC at 50 µg/mL lengthened the time over which pazopanib supersaturation was maintained from 5 ± 2 to about 39 min sugihara2018 R22 (C F23). The indomethacin EPO dispersion precipitate, SHG-active α crystals mostly under 10 µm, rose from ≈21 to ≈32 µg/mL within 20–30 min, while sieved α crystals reached 17 µg/mL after 8 h and γ crystals ≈8 µg/mL; with a shift to pH 6.8 all three 30% dispersions reached 40 µg/mL within 10 min xie2017 R19, R23, R25, R17, R22 (B F21). At pH 6.5 alone 25% delamanid salt dispersions released ≈96% (HPMCP-50) to ≈0% (HPMCAS-HF); after pH 1.6, 3.0 or 5.0 the HPMCP-55 dispersion ended at ≈94.5, ≈80.5 and ≈12.5%, and praziquantel–HPMCAS reached ≈92–103% after a pH 1.6 start but ≈62–77% after pH 3.0 or 5.0 nguyen2023c R11; alvarenga2025 R4, R7, R10, R13 (B F25). With crystals present after the gastric stage, a posaconazole dispersion held its amorphous solubility only while undissolved dispersion and droplets remained elkhabaz2019a R6, R12, R16 (B F26). Coat. Coated delamanid tablets released less than 0.5% in every gastric stage and ≈76–86 µg/mL after transfer, a spread of about 4–8 µg/mL within a form against ≈52–86 µg/mL uncoated; the coat failed after about 130–150 min at pH 4.5–5.0 in buffer but lasted more than 17 h in a fed gastric medium nguyen2023b R10, R2, R7 (B F27).

chapter findingsystemmethod and conditionsresultids
D F1ten weak basespH rise, 37 °Ccrystalline group 1.4–26.7× for 3.1–14.7 min; amorphous group 7.2–20.7×hsieh2012 R1, R5, R10
D F16glyburide, warfarin, papaverine, dipyridamole with nine polymerspH shift, WAXS to 6 hacids amorphous with most polymers; bases crystalline with allhsieh2014 R4, R12
C F10clotrimazole, atazanavir, nicardipineLLPS across pHtotal 30- to 65-fold higher at low pH; un-ionized part constantindulkar2015 R18, R5, R6, R7, R9, F2
C F23pazopanib HCl, three doses, HPMCSGF then pH 6.5colloids and capped free drug above the amorphous solubility; crystals only below it; HPMC 5 → 39 minsugihara2018 R8, R12, R15, R20, R22
B F21indomethacin with EPO and HPMCpH 2.2 then pH 5 or 6.8droplets redissolved in about 2 min; in situ α crystals to 32.1 of 40 µg/mL; pH 6.8 hid the differencexie2017 R10, R20, R19, R23, R22
B F24posaconazole–HPMCAS 10–50%; delamanid with enteric gradesFaSSGF or acid films, SHG, PLM, SEMcrystals in every system; about 68% of undissolved drug at 50% posaconazoleelkhabaz2019a R10, R16, R20; nguyen2023c R19, R20
B F25delamanid salt dispersions, five grades; praziquantelgastric pH 1.6, 3.0, 5.0 then pH 6.5final release about 0–101%; praziquantel 92–103% after pH 1.6, 62–77% after 3.0 or 5.0nguyen2023c R11, R13; alvarenga2025 R4, R7, R10, R13
B F19posaconazole–HPMCAS; delamanid dispersionsgastric mediaposaconazole ≈28–45.5 against 115.1 µg/mL crystalline; delamanid ratio 0.9–3.8 at pH 1.6 to 11–42 at pH 5.0elkhabaz2019a R6, R7, R8, R1; nguyen2023c R13
B F26posaconazole–HPMCAS 10%, two dosesgastric then intestinal stageplateau held only while the reservoir remainedelkhabaz2019a R6, R12, R16
B F27delamanid–HPMCP-50 tablets, coated and uncoatedtwo-stage tests; coat integritycoated ≈76–86 µg/mL after any gastric stage; uncoated ≈0.3–93nguyen2023b R10, R2, R1, R7

Figure

Fig. 9 of sugihara2018: pH-solubility diagram of pazopanib with the three doses
Fig. 9 · sugihara2018pH-solubility diagram of pazopanib with the three doses
The crystalline and amorphous solubility curves divide the diagram into three regions, and the three doses at pH 6.5 fall above the amorphous curve, between the curves and below the amorphous curve, the three outcomes of the test sugihara2018 C45, R20 (C F23).

Why

Below the crystalline solubility the solution is subsaturated; between the boundaries crystallization is the only possible change; above the amorphous solubility the drug separates as amorphous colloids and the solution stays at the amorphous solubility until crystallization depletes it sugihara2018 C33, C34, C36 (C F23). The indomethacin droplets disappeared on the pH rise, "consistent with" the higher amorphous solubility of the ionized drug, and the faster dissolution of the in situ precipitate is attributed "likely" to its very small crystal size xie2017 C40, C42, C47, C48 (B F21). With crystal-free dispersions and a subsaturated gastric solution "Solution-phase crystallization cannot occur", so the crystals formed in the undissolved, water-plasticized matrix and "were transferred to the intestinal compartment and promoted further crystallization" elkhabaz2019a C34, C35, C56 (B F24); for delamanid the small crystal mass is still "potentially catastrophic" because the crystals "can act as seeds" nguyen2023c C43, C46, C44 (B F24). At gastric pH HPMCP is unionized and insoluble, inhibits crystallization poorly and leaves the drug at the surface most mobile; the coat keeps the medium away during the gastric stage nguyen2023b C35, C37, C43, C46 (B F27). For praziquantel the hold-back is put down to the "minimal ionization of succinoyl groups" of HPMCAS-MF below pH about 6 alvarenga2025 C9 (B F25). (synthesis: the four chapters supply the parts of one sequence; the pH-dependent amorphous solubility of C F10 sets how much drug is above the intestinal ceiling after the shift, the solid form of the precipitate decides whether it redissolves, and an enteric polymer that cannot dissolve in acid leaves the wetted drug to crystallize, which brings in the seeds of F4.)

Conditions and limits

Each pazopanib pH-shift condition is a single trace, and crystal identity and the glassy state are inferred sugihara2018 X15, X6, X5 (C F23). The indomethacin acid-stage UV values are apparent, there is no size-matched crystal control and replicate numbers are not stated xie2017 X7, X10, X6 (B F21). The SHG and TPE-UVF volume fractions are uncalibrated against each other, and the delamanid crystals were seen on films and powders rather than tablets and were not identified elkhabaz2019a X6; nguyen2023c X10, X11 (B F24). The pH 1.6–3.0–5.0 grid comes from one source per drug, and the polymer ranking reverses after pH 5.0 nguyen2023c K2, X3, X13 (B F25). The coat-integrity window was measured on edisylate tablets only with a visual end point nguyen2023b K4, X7 (B F27).

Counterexamples and conflicts

Gastric pH 1.6 was not always the worst start: for praziquantel and for most delamanid dispersions pH 3.0 or 5.0 gave lower final release than pH 1.6 alvarenga2025 R4, R7; nguyen2023c R11 (B F25), and the HPMCP-50 dispersion, whose polymer dissolves at pH 5.0, released most drug in the acid stage, which "presumably mitigates" surface crystallization nguyen2023c C54 (B F25). A higher gastric supersaturation did not mean better final release nguyen2023c R13, C39 (B F25). For acidic drugs polymers kept pH-shift precipitates amorphous, for the bases papaverine and dipyridamole none did hsieh2014 R4, R12 (D F16), so the outcome after a shift is drug-specific beyond its ionization. In FeSSIF-V1 at pH 5.0, where HPMCAS hardly dissolves, 20% bedaquiline dispersions released only about 22.5–25% although the crystalline solubility was 628 µg/mL kaur2025 R16, R2 (A F34).

Transfer check

Place the intestinal dose on the pH-solubility diagram of the crystalline and the amorphous form at the intestinal pH before choosing the test sugihara2018 C45, R20 (C F23). For a weak base with an enteric polymer, suspend the dispersion, and a film of it, in the gastric medium at two or more pH values for the expected residence time and look for crystals by SHG, PLM or SEM, since PXRD missed crystal levels that still harmed release elkhabaz2019a P10; nguyen2023c R15, C46 (B F24), and run the two-stage test at pH 1.6, 3.0 and 5.0, not only a single stage at pH 6.5 nguyen2023c C5 (B F25). After a shift, characterize whether a precipitate is amorphous or crystalline and its size, and use an intermediate final pH as well as 6.8 xie2017 C70, C66, C67 (B F21). If crystals form in acid, test an enteric coat on the tablet, checking its integrity at pH 4.5–5.0 nguyen2023b R7, C2 (B F27).

History

2012: Hsieh and co-workers sorted weak bases after a pH rise into crystalline and amorphous precipitates hsieh2012 R1, R5, R10 (D F1). 2014: polymers kept the pH-shift precipitates of two acids amorphous but not those of two bases hsieh2014 R4, R12 (D F16). 2015: Indulkar and co-workers showed the LLPS concentration of weak bases following ionization indulkar2015 R18, F2 (C F10). 2017: Xie and co-workers followed what separated in acid through the pH rise xie2017 R19, R20, R23 (B F21). 2018: Sugihara and Taylor explained a pH-shift outcome by the dose relative to the intestinal amorphous solubility sugihara2018 C45 (C F23). 2019: Elkhabaz and co-workers found matrix crystals in gastric fluid carried into the intestinal stage elkhabaz2019a R16, C56 (B F24). 2023: Nguyen and co-workers mapped release over gastric pH and grade and restored it with an enteric coat nguyen2023c R11; nguyen2023b R10, C43 (B F25, B F27). 2025: Alvarenga and co-workers found the same gastric-pH dependence for neutral praziquantel with HPMCAS alvarenga2025 R4, R7 (B F25).

Topic 5 of 5 · 1 finding · F12

Bile salts and biorelevant media

F12

Topic 5Bile salts and biorelevant media1 of 1

Bile salt monomers delay nucleation, micelles raise only total solubility, and lecithin shortens induction times.

At 0.1% and a matched concentration ratio, sodium taurocholate lengthened the induction time of all 11 drugs tested chen2015 R3, C13. Micelles of three dihydroxy bile salts doubled both solubilities of telaprevir without raising the activity at the amorphous solubility lu2017b R1, R2. Lecithin shortened the atazanavir induction time in 3 mM taurocholate from about 595 to 43 min indulkar2018 R16, R19.

moderateModerate to strong for monomeric bile salt inhibition at matched activity, where three methods agree; moderate for the lecithin and media rankings and for the release effects, with censored values, few statistics and single systems li2016a K2, X17; indulkar2018 X8; kaur2025 X13.

Telaprevir: induction time, min (log scale)bufferabout 30six bile salts, 1.86 mMmonomersbeyond 960STCDC, 12 mMmicellesabout 180STDC, 12 mMmicellesabout 140SGDC, 12 mMmicellesabout 125

Monomers held telaprevir for hours; micelles of the dihydroxy salts lost most of that effect. lu2017 R3

Posaconazole without polymer: induction time, minFaSSIF-V1about 3FaSSIF-V2about 4two blank buffersabout 5 and 8composite FaSSIFabout 9pooled human fluidabout 18

Human intestinal fluid held the drug longest and FaSSIF-V1 shortest. elkhabaz2021 R6, R7

For your drug

  1. Compare additives and media at equal activity-based supersaturation, measured by flux, before reading a change in induction time as inhibition.
  2. Measure the induction time in FaSSIF-V1, in FaSSIF-V2 or a bile-salt mix and, if available, in aspirated fluid, at each amorphous solubility, and treat a FaSSIF-V1 failure as conservative; for a weak base in HPMCAS compare complexation and release in the fluid and in its blank buffer.

li2016a R15; lu2017 R1, R5; elkhabaz2021 C53, C59, R28, C23; kaur2025 P7, P8, P9

How it works and key numbers
  1. An additive could lengthen induction times merely by lowering the driving force; matched ratios, unchanged flux and the activity calibration rule this out, so the delay comes from an effect on nucleation itself chen2015 C7; li2016a C47, C50, C51; lu2017 C25, C26.
  2. The monomer is "the effective crystallization inhibitory species", and the authors "speculate" that micelles of the dihydroxy salts offer interfaces as nucleation sites lu2017 C25, C33, C34, C35.
  3. For lecithin two routes are proposed, neither measured: taurocholate taken into mixed micelles no longer inhibits, and/or lecithin adsorbs on the nucleus ("possibly") indulkar2018 C40; enright2020 C22, C26.
  4. For human fluid the authors suggest that adsorbed molecules must desorb before a solute molecule can attach, lowering the pre-exponential factor A = fZn ("may explain") elkhabaz2021 C22, E3.
  5. In release, bedaquiline cations "clearly" interact with the mixed micelles, which "explains" the lower complexation with HPMCAS kaur2025 C38, C36, C39.
To feel the numbers. The six bile salts at 1.86 mM held telaprevir at least 960 ÷ 30 = 32 times longer than buffer; at 12 mM the dihydroxy micelles kept only 125 ÷ 30 ≈ 4 to 180 ÷ 30 = 6 times.
beyond 960 vs about 30 mintelaprevir with 1.86 mM bile salts against bufferlu2017 R3
about 595 → 43 minatazanavir in 3 mM taurocholate without and with lecithinindulkar2018 R16, R19
17–30% → 87.5–97%bedaquiline release from HPMCAS in buffer against FaSSIF-V1kaur2025 R13, R15
Evidence: data, conditions and papers

Finding F12. Intestinal media act at three points with different signs: bile salt monomers delayed nucleation beyond any solubilization effect, micelles raised the total solubility without raising the activity at the ceiling, and lecithin and its digestion products shortened induction times; human fluid held drugs longest and FaSSIF shortest, and release from HPMCAS changed only where micelles broke a drug–polymer complex

In short. At 0.1% and matched concentration ratio sodium taurocholate lengthened the induction time of all 11 drugs tested chen2015 R3, C13 (D F28), and at unchanged membrane flux and at equal activity-based supersaturation bile salts still raised induction times from minutes to hours li2016a R13, R15; lu2017 R1, R3 (D F31); at 1.86 mM all six bile salts held telaprevir beyond 960 min against about 30 min in buffer, and 12 mM micelles of three dihydroxy salts lost most of that effect lu2017 R3 (D F32). The same micellar dihydroxy salts doubled both solubilities of telaprevir at unchanged activity boundaries lu2017b R1, R2 (C F17), and in six media from buffer to pooled human fluid the flux-based maximum of atazanavir and posaconazole stayed nearly constant while the concentration-based value fell elkhabaz2019b R8, R9, C21 (C F16). Lecithin shortened the atazanavir induction time in 3 mM taurocholate from about 595 to 43 min, and its digests lyso-PC and oleate more so indulkar2018 R16, R19; enright2020 R6, R10 (D F39); a six-bile-salt medium held atazanavir, ritonavir, tacrolimus and telaprevir about two- to more than fortyfold longer than taurocholate-only FaSSIF indulkar2018 R20, R12; lu2018 R6 (D F40), and pooled human fluid longest of six media (atazanavir about 141 min, FaSSIF-V1 49 min) elkhabaz2021 R6, R7 (D F42). In release, FaSSIF left neat HPMCAS and an indomethacin dispersion at their blank-buffer rates bapat2023 R5, R7, R9 (A F23), raised bedaquiline release from about 17–30% to 87.5–97% by suppressing complexation kaur2025 R13, R15, R5, R6 (A F34), and fed fluid lowered praziquantel release to about 34–52% at 1.5 mg/mL by promoting crystallization alvarenga2025 R16, R18, C29 (B F28).

Type. cross-chapter synthesis of 15 chapter findings (13 bile salts, lecithin and its digests, simulated, composite and volunteer-based media, pooled aspirated human fluid; atazanavir, telaprevir, posaconazole, ritonavir, tacrolimus, celecoxib, nevirapine and further drugs; release of HPMCAS, HPMC and HPMCP dispersions) Strength. to strong for monomeric bile salt inhibition at matched activity, where three methods agree (D F31); moderate for the lecithin and media rankings, the same direction in four papers but with censored values and few statistics (D F39, D F40); moderate for the release effects, single-system observations whose mechanisms were not measured (A F34, B F28).

How it was shown

Chen and co-workers (2015) set 11 drugs at a fixed ratio of concentration to the crystalline solubility in buffer or 0.1% STC chen2015 P1, P2, and Lu and co-workers (2017) measured the solubilities and flux of telaprevir with six bile salts lu2017b P1, A1, A2, P2, P3, P4. Indulkar and co-workers (2018) varied lecithin and bile salts indulkar2018 P1, P2, P3, P7, and Elkhabaz and co-workers (2021) compared aspirated fasted fluid with five simulated media elkhabaz2021 P1, P2, P3.

What the data show

With 0.1% STC induction times rose from about 7–87 min in buffer to between about 15 and more than 1000 min, while STC raised the crystalline solubility only 1.1- to 3.5-fold chen2015 R3, R1. Micellar dihydroxy salts about doubled both telaprevir solubilities, while STCDC and SGCDC lowered the maximum flux lu2017b R1, R2, R12, R13.

systemmethod and conditionsresultids
telaprevir, six bile salts, 1.86 and 12 mMδ 11.5 and 28.8monomers beyond 960 min; micelles of three dihydroxy salts 125–180 minlu2017 R3, R4
telaprevir seeds, six bile saltsseeded desupersaturation, 15 h residualSTCDC stopped growth; others 1.0- to 4.6-foldlu2017a R7, R10, R12
atazanavir with lecithin, lyso-PC, oleate; telaprevir in FaSSIFinduction time595 → 43 min with 0.75 mM lecithin; lyso-PC shorter still; FaSSIF as fast as bufferindulkar2018 R16, R19; enright2020 R6, R10; lu2018 R6, R4
four drugs in Composite-SIF and FaSSIF-V1at each amorphous solubilityabout 2- to more than 40-fold longer with six bile salts; cilnidipine unchangedindulkar2018 R20, R12; lu2018 R6
atazanavir, posaconazole, pooled human fluidinduction time, SHGhuman fluid longest (141 and 18 min), FaSSIF-V1 earliestelkhabaz2021 R6, R7, R14, R15
bedaquiline–HPMCAS LF and MFrelease and spike test in fluids and blank buffers17–30% in buffer, 87.5–97% in FaSSIF-V1; complexation up to 90% → at most about 29%kaur2025 R13, R15, R5, R6, R8
Fig. 3 of elkhabaz2021: atazanavir induction times in six media without and with 10 µg/mL HPMC-AS
Fig. 3 · elkhabaz2021atazanavir induction times in six media without and with 10 µg/mL HPMC-AS

Without polymer FaSSIF-V1 crystallizes atazanavir first and human fluid last; with HPMC-AS every medium lasts longer but FaSSIF-V1 still falls short of the buffers elkhabaz2021 R6.

Why

The bile-salt papers reason that an additive could lengthen induction times merely by lowering the driving force, which matched ratios, unchanged flux and the activity calibration rule out chen2015 C7; li2016a C47, C50, C51; lu2017 C25, C26. The monomer is "the effective crystallization inhibitory species", and micelles of the dihydroxy salts may offer nucleation sites ("speculate") lu2017 C25, C33, C34, C35. For lecithin, taurocholate taken into mixed micelles no longer inhibits and/or lecithin adsorbs on the nucleus ("possibly") indulkar2018 C40; enright2020 C22, C26. Bedaquiline cations "clearly" interact with the mixed micelles, which lowers complexation kaur2025 C38, C36, C39.

Limits and transfer

One human fluid pool at pH 7.3 was set against simulated media at pH 6.5 elkhabaz2021 X12, X11. Compare media at equal activity-based supersaturation before reading a change in induction time as inhibition li2016a R15; lu2017 R1, R5, and treat a FaSSIF-V1 failure as conservative elkhabaz2021 C53, C59, R28, C23.

How it was shown

Chen and co-workers (2015) set 11 drugs at a fixed ratio of concentration to the crystalline solubility in buffer, 0.1% STC or 0.1% SDS chen2015 P1, P2, M5–M15 (D F28). Li and co-workers (2016) tested 13 bile salts at 0.1% with celecoxib, nevirapine and flibanserin, a blend of the six main human bile salts, membrane mass flow and molecular dynamics of nevirapine with four bile salts li2016a P4, P6, P5, A7, P9, P10 (D F29, D F30); li2016a P1, P8, E1, E2 (D F31). Lu and co-workers (2017) measured the solubilities, GLPS onset and flux of telaprevir with six bile salts at 1.86 and 12 mM lu2017b P1, A1, A2, P2, P3, P4 (C F17), set telaprevir to an activity-based supersaturation δ of 11.5 or 28.8 for induction times lu2017 E1, P1, P2, P3, P4 (D F32), and grew seeds in situ for growth ratios lu2017a P1, P2, P3, E2 (D F33). Indulkar and co-workers (2018) diluted FaSSIF-V1 to 0.01–0.75 mM lecithin and made a six-bile-salt Composite-SIF, dosing at each medium's amorphous solubility indulkar2018 P1, P2, P3, P7, P8, P9 (D F39, D F40). Lu and co-workers (2018) compared telaprevir in buffer, FaSSIF and two six-bile-salt lecithin media with and without 150 µg/mL HPMCAS-MF lu2018 P2, P6, A4 (D F43). Enright and co-workers (2020) built media on the duodenal bile acid pools of six volunteers with lipid fractions of FaSSIF-V3 enright2020 P5, P6, P7, P8, P13, P14, P15 (D F41). Elkhabaz and co-workers (2021) compared pooled aspirated fasted fluid with five simulated media and imaged crystals by SHG elkhabaz2021 P1, P2, P3, P7, P8 (D F42). Duong, Ni and Taylor (2022) fitted nucleation theory to posaconazole induction times in buffer and four media duong2022b R10, R11, R16, E10 (D F34). Bapat and co-workers (2023) and Kaur and co-workers (2025) released HPMCAS and its dispersions in FaSSIF and FeSSIF and their blank buffers and spiked bedaquiline and HPMCAS into each bapat2023 P14, R7; kaur2025 P7, P8, P9, P11, P12 (A F34); Alvarenga and co-workers (2025) released praziquantel dispersions in PBS, FaSSIF and FeSSIF-V2 with PLM and PXRD of residues alvarenga2025 P7, P8, P9, P6, P5 (B F28).

What the data show

Monomers. With 0.1% STC induction times rose from about 7–87 min in buffer to between about 15 and more than 1000 min, while STC raised the crystalline solubility only 1.1- to 3.5-fold chen2015 R3, R1 (D F28). Thirteen bile salts gave from 3 min to more than 16 h with celecoxib, the best bile salt changed with the drug (SC 281 min with celecoxib, 15.6 and 26 min with nevirapine and flibanserin), and a blend of six human bile salts delayed celecoxib 210 ± 21 against 103 ± 35 min for STC li2016a R6, R28 (D F29); hydrophobicity ordered the free and the glycine-conjugated bile salts in opposite directions, and no simulated interaction energy ranked them li2016a R16, R17, R18, R20 (D F30). Monomeric STCDC stopped growth on telaprevir seeds and held 60.5 of 65.2 µg/mL for 15 h, while four other bile salts slowed growth only 1.0- to 4.6-fold lu2017a R7, R10, R12 (D F33). Micelles. Telaprevir's crystalline solubility rose from 5.2 to 9.6–12.4 µg/mL and its GLPS onset from about 150 to 238–360 µg/mL with 12 mM dihydroxy salts, while STCDC and SGCDC lowered the maximum flux to 1.06–1.11 against 1.25–1.32 µg/min lu2017b R1, R2, R12, R13 (C F17). At 12 mM STDC, SGDC and STCDC crystallized telaprevir after about 140, 125 and 180 min lu2017 R3 (D F32). In FaSSIF and FeSSIF both posaconazole limits rose (up to 7.80 and 160.89 µg/mL) while the concentration ratio fell from about 34 to about 20 duong2022b R8 (D F19). Lecithin. In 2.8 mM glycocholate/taurocholate PC gave 185 ± 26 and 55 ± 14 min at 0.01 and 0.63 mM against 272 ± 94 min without lipid, and lyso-PC 73 ± 13 and 26 ± 2 min enright2020 R6, R10 (D F39); telaprevir crystallized in FaSSIF (about 21 min) as fast as in buffer (about 29 min) lu2018 R6, R4 (D F39). Media. Composite-SIF gave about 120 against 43 min (atazanavir), 740 against 240 min (ritonavir) and 101 against 53 min (tacrolimus) compared with FaSSIF-V1, and cilnidipine was unaffected (about 330 min in both) indulkar2018 R20, R12 (D F40). In volunteer-based media atazanavir lasted 23–33 min at 0.57–2.2 mM and 112–144 min at 3.6–5.1 mM bile salt with a fixed lipid fraction, and 1 mg/mL HPMC kept both extreme media beyond 360 min enright2020 R18, R20, R28 (D F41). Posaconazole nucleated after about 8, 5, 3, 4, 9 and 18 min in two blank buffers, FaSSIF-V1, FaSSIF-V2, a composite FaSSIF and human fluid elkhabaz2021 R6, R7 (D F42); near S 34 four media gave about 1.5–3 min against buffer, while at the lowest supersaturation FeSSIF V1 and FaSSIF V1 were slower than buffer duong2022b R10, R11 (D F34). With 150 µg/mL HPMCAS-MF telaprevir lasted about 357–474 min in buffer, FaSSIF and two lecithin media alike lu2018 R7, R9 (D F43). Release. In blank FeSSIF-V2 buffer HPMCAS LF complexed about 90% at the highest drug:COOH ratio and in FeSSIF-V2 17% kaur2025 R5, R6, R8 (A F34). In FeSSIF-V2 30% praziquantel dispersions released about 68–80% at 0.667 mg/mL and 34–52% at 1.5 mg/mL with either polymer, with crystals in HPMC residues from 5 min, while delamanid dispersions released the same in FaSSIF as in buffer although the amorphous solubility was ten times higher alvarenga2025 R16, R18, R22, R27; duong2022a R13, R1 (B F28).

chapter findingsystemmethod and conditionsresultids
D F2811 drugs, 0.1% STCmatched C/Ceq, induction timeall 11 longer; four did not crystallize within the runchen2015 R3, C13, R1
D F29celecoxib, nevirapine, flibanserin, 13 bile salts0.1%, 37 °C3 min to more than 16 h; best bile salt drug-dependent; human blend 210 against 103 minli2016a R6, R28
D F31nevirapine, celecoxib; telaprevirmatched ratio, mass flow, activity calibrationinduction times rose at unchanged flux and equal activityli2016a R13, R15; lu2017 R1, R3
D F32telaprevir, six bile salts, 1.86 and 12 mMδ 11.5 and 28.8monomers beyond 960 min; micelles of three dihydroxy salts 125–180 minlu2017 R3, R4
D F33telaprevir seeds, six bile saltsseeded desupersaturation, 15 h residualSTCDC stopped growth; others 1.0- to 4.6-foldlu2017a R7, R10, R12
C F17telaprevir, six bile saltssolubilities, GLPS onset, fluxmicellar dihydroxy salts double both solubilities; STCDC and SGCDC lower the maximum fluxlu2017b R1, R2, R13
C F16atazanavir, posaconazole in six media incl. human fluidflux against concentrationflux-based maximum constant, concentration-based value fallselkhabaz2019b R8, R9, C21
D F39atazanavir with lecithin, lyso-PC, oleate; telaprevir in FaSSIFinduction time595 → 43 min with 0.75 mM lecithin; lyso-PC shorter still; FaSSIF as fast as bufferindulkar2018 R16, R19; enright2020 R6, R10; lu2018 R6, R4
D F40four drugs in Composite-SIF and FaSSIF-V1at each amorphous solubilityabout 2- to more than 40-fold longer with six bile salts; cilnidipine unchangedindulkar2018 R20, R12; lu2018 R6
D F41atazanavir in six volunteer-based mediafixed lipid fraction; 1 mg/mL HPMC23–33 against 112–144 min by bile salt level; HPMC beyond 360 minenright2020 R18, R20, R28
D F42atazanavir, posaconazole, pooled human fluidinduction time, SHGhuman fluid longest (141 and 18 min), FaSSIF-V1 earliestelkhabaz2021 R6, R7, R14, R15
D F43telaprevir with 150 µg/mL HPMCAS-MF in six mediainduction time, ANOVA357–474 min alike with and without lecithin medialu2018 R7, R9
D F34posaconazole in buffer and four mediainduction time over S 5–33.6; nucleation-theory fitsmedia faster at high S, slower at the lowest S; effect in the pre-exponential factorduong2022b R10, R11, R16
A F34bedaquiline–HPMCAS LF and MFrelease and spike test in fluids and blank buffers17–30% in buffer, 87.5–97% in FaSSIF-V1; complexation up to 90% → at most about 29%kaur2025 R13, R15, R5, R6, R8
B F28praziquantel with HPMCAS-MF and HPMC; delamanid dispersionsrelease in PBS, FaSSIF, FeSSIF-V2FeSSIF-V2 34–52% at 1.5 mg/mL with crystals; delamanid unchanged in FaSSIFalvarenga2025 R16, R18, R22; duong2022a R13, R1

Figure

Fig. 3 of elkhabaz2021: atazanavir induction times in six media without and with 10 µg/mL HPMC-AS
Fig. 3 · elkhabaz2021atazanavir induction times in six media without and with 10 µg/mL HPMC-AS
Without polymer FaSSIF-V1 crystallizes atazanavir first and human fluid last; with HPMC-AS every medium lasts longer but FaSSIF-V1 still falls short of the buffers elkhabaz2021 R6 (D F42).

Why

All three bile-salt papers reason that an additive could lengthen induction times merely by lowering the driving force, which matched ratios, unchanged flux and the activity calibration rule out, so the delay comes from an effect on nucleation itself chen2015 C7; li2016a C47, C50, C51; lu2017 C25, C26 (D F31). The monomer is "the effective crystallization inhibitory species", and the authors "speculate" that micelles of the dihydroxy salts offer interfaces as nucleation sites lu2017 C25, C33, C34, C35 (D F32); micellar STDC and SGDC solubilize telaprevir while STCDC and SGCDC "presumably" mix into the drug-rich phase lu2017b C28, C46, C50, C51, C31 (C F17). For lecithin two routes are proposed, neither measured: taurocholate taken into mixed micelles no longer inhibits, and/or lecithin adsorbs on the nucleus ("possibly"); lyso-PC adsorbing faster is "likely the predominant mechanism" indulkar2018 C40; enright2020 C22, C26 (D F39). The chenodeoxy and deoxy conjugates of Composite-SIF explain its longer times ("can be readily explained"), a reading tested with atazanavir only indulkar2018 C42, X10 (D F40). For human fluid the authors suggest that adsorbed molecules must desorb before a solute molecule can attach, lowering the pre-exponential factor A = fZn ("may explain") elkhabaz2021 C22, E3 (D F42), and the posaconazole fits put the medium effect in the pre-exponential factor rather than in the interfacial energy duong2022b C51, C52 (D F34). In release, bedaquiline cations "clearly" interact with the mixed micelles, which "explains" the lower complexation kaur2025 C38, C36, C39 (A F34); for praziquantel the higher bile salt and lecithin content of FeSSIF-V2 "promoted crystallization" alvarenga2025 C29 (B F28). (synthesis: across the chapters the same medium component acts on several steps at once, the thermodynamic ceiling, nucleation and the polymer's release, often with opposite signs, so a medium raised or lowered the duration of supersaturation according to which step limited for that drug; only the activity scale of F2 separates the steps.)

Conditions and limits

At 0.1% bile salt three methods agree, but for other bile salts only the matched ratio was used, which disagrees with flux for celecoxib li2016a K2, X17, X18 (D F31). The CMC was measured for two bile salts only lu2017 X7, X8, X16 (D F32). Replicate numbers of the lecithin series are often not stated and the FaSSIF-V1 against V2 comparison also changes the buffer indulkar2018 X8; enright2020 X1; elkhabaz2021 X19 (D F39). Equal supersaturation is assumed for tacrolimus and cilnidipine, and many values are censored indulkar2018 X4, X10 (D F40). One human fluid pool at pH 7.3 was set against simulated media at pH 6.5, with no statistics on the kinetics elkhabaz2021 X12, X11 (D F42). Micellar solubilization and complex disruption were not separated for bedaquiline kaur2025 X13, X15 (A F34), and nucleation and growth were not measured in the praziquantel and delamanid release media alvarenga2025 X9; nguyen2023b X8 (B F28).

Counterexamples and conflicts

A few bile salts gave no delay or formed insoluble particles li2016a R6, C2 (D F29), and in ternary micelles STC lost the protection it kept alone at 12 mM lu2018 R3, R4, C18 (D F32). Cilnidipine was unaffected by the bile-salt mix, and for posaconazole the composite medium fell short of human fluid indulkar2018 R20; elkhabaz2021 R7 (D F40). At the lowest posaconazole supersaturation intestinal media were slower than buffer, at high supersaturation faster duong2022b R11 (D F34). Food components raised delamanid solubility up to several hundredfold and the release of the marketed tablet nguyen2023b R13, R14, C29 (B F28), the opposite sign to praziquantel. In the release of a non-complexing drug from HPMCAS FaSSIF changed nothing bapat2023 R7, R9 (A F23). A polymer narrowed but did not remove the medium effect: with 10 µg/mL HPMC-AS atazanavir lasted more than 480 min in two blank buffers but about 183 min in FaSSIF-V1 elkhabaz2021 R6 (D F43).

Transfer check

Compare additives and media at equal activity-based supersaturation, measured by flux, before reading a change in induction time as inhibition li2016a R15; lu2017 R1, R5 (D F31). Measure the induction time in FaSSIF-V1, in FaSSIF-V2 or a bile-salt mix and, if available, in aspirated fluid, at each amorphous solubility and at the dosage form's polymer:drug ratio, and treat a FaSSIF-V1 failure as conservative elkhabaz2021 C53, C59, R28, C23 (D F42). For a weak base in HPMCAS, compare complexation and release in the fluid and in its blank buffer kaur2025 P7, P8, P9 (A F34); for a fed-state claim, release the dispersion in FeSSIF-V2 and look for crystals in the residue alvarenga2025 P5, P6 (B F28).

History

2015: Chen and co-workers found taurocholate delaying nucleation of 11 drugs at matched ratio chen2015 R3 (D F28). 2016: Li and co-workers compared 13 bile salts and a human blend and called them "not interchangeable" li2016a R6, C69 (D F29). 2017: the telaprevir papers set bile salts on an activity scale, separated monomers from micelles and nucleation from growth lu2017b R1, R2; lu2017 R3; lu2017a R7 (C F17, D F32, D F33). 2018: lecithin and the human bile salt mix were added and FaSSIF found the shortest medium indulkar2018 R16, R20; lu2018 R6 (D F39, D F40). 2019: the activity ceiling was found constant in human fluid elkhabaz2019b R8, R9 (C F16). 2020–2021: volunteer-based media and pooled human fluid set the in vivo range enright2020 R18, R20; elkhabaz2021 R6, R7 (D F41, D F42). 2022: nucleation-theory fits placed the medium effect in the pre-exponential factor duong2022b R16, C51 (D F34). 2023–2025: release studies found media effects only where the drug complexed the polymer or crystallized in fed fluid bapat2023 R7; kaur2025 R15; alvarenga2025 R16 (A F34, B F28).

01Development line across the chapters

Every paper of the category in year order; the tag names its chapter and the chips open the chapter findings it supports.

  1. 2008
    konno2008apolymer type and felodipine dispersion dissolutionB. Supersaturation from ASD dissolutionfirst proposed

    Effect of polymer type on the dissolution profile of amorphous solid dispersions containing felodipine

    Note
    Known in the library (builds_on: Konno 2006, Konno 2008 on moisture, Marsac 2006): dry felodipine dispersions with PVP, HPMC and HPMCAS nucleated alike, and with moisture HPMCAS and HPMC inhibited crystallization better than PVP at high relative humidity; felodipine thermodynamic data for the Hoffman estimate konno2008a R18, R20.
    Added
    the first dissolution ranking of the three polymers (maxima 14.1, 4.9 and 2.3 µg/mL at 75% polymer), unchanged crystalline solubility with 1 mg/mL polymer, solvent-shift profiles read as growth inhibition, and a solution screen that matched dissolution for PVP and HPMCAS but not HPMC konno2008a R7, R1, C36, C31.
    Relation
    first in the library on the polymer ranking during dispersion dissolution.
    Note
    Findings: F4, F5, F6.
  2. 2010
    alonzo2010two crystallization routes during amorphous dissolutionB. Supersaturation from ASD dissolutionconfirmsextends

    Understanding the Behavior of Amorphous Pharmaceutical Systems during Dissolution

    Note
    Known in the library (builds_on: Konno 2008 on dissolution, Konno 2006, Marsac 2008): polymer inhibition of felodipine crystallization from solution and the felodipine crystalline solubility alonzo2010 R20, polymers as solid-state inhibitors of felodipine, and the Tg of dry and humid felodipine for the temperature argument.
    Added
    in situ Raman and microscopy that separate crystallization of the wetted solid (felodipine at 37 °C, ≈54% crystalline at 1 min) from crystallization in the liquid (indomethacin at 25 °C), a lag of about 13–20 min that dissolved polymers put before felodipine crystallizes, and the proposal of two polymers for two routes alonzo2010 R2, R19, R6, C46.
    Relation
    extends Konno 2008 to the solid route; confirms its felodipine solution ranking ("in excellent agreement") alonzo2010 C11.
    Note
    Findings: F1, F2, F4, F6.
  3. 2011
    alonzo2011drug loading, nanoparticles and the dissolved-drug ceilingB. Supersaturation from ASD dissolutionfirst proposed

    Dissolution and Precipitation Behavior of Amorphous Solid Dispersions

    Note
    Known in the library (builds_on: Alonzo 2010, Konno 2008, Van Eerdenbrugh 2011): crystallization limits the observed amorphous supersaturation, PVP is weaker than HPMC against felodipine crystallization from solution, and UV is inflated by felodipine nanosuspensions alonzo2011 C3, R24, R25.
    Added
    the first particle-blind test of dispersions (flux ratios 10.5, 9.5 and 8.5 for 90:10, 50:50 and pure amorphous felodipine, near a predicted 9), NMR, the UV artefact of submicron particles, and fast disintegration of 10% drug dispersions alonzo2011 R14, R15, C27, R4.
    Relation
    first in the library on the dissolved-drug ceiling of dispersions; later papers cite it for that ceiling and for nanodroplets from low-loading dispersions [almeidaesousa2016 C9; indulkar2016 R14].
    Note
    Findings: F7, F8, F9, F10, F4, F5.
  4. 2012
    alonzo2012HPMC on felodipine growth and nucleationD. Crystallization from solutionfirst proposed

    Characterizing the Impact of Hydroxypropylmethyl Cellulose on the Growth and Nucleation Kinetics of Felodipine from Supersaturated Solutions

    Known before
    the solubility advantage of amorphous felodipine (S about 10), that 1 mg/mL HPMC does not change the felodipine solubility, and the second-derivative UV method with its nanoparticle check (builds_on) alonzo2012 C42, R21, R19, R20.
    Added
    seeded growth at S 3–12 with 0.2–3.5 µg/mL HPMC, the adsorption isotherm, the Kubota–Mullin factor α (0.7 at S 3 to 0.2 at S 12), the growth order (1.5 to 1.97 ± 0.12), an unseeded induction time of 15.3 against 136.5 min, and a nucleation-rate ratio of 7.05 × 10⁻⁴ alonzo2012 R4, R9, R13, R16, R17.
    Relation
    first in the library to separate the polymer effect on nucleation from that on growth, and to apply the Kubota–Mullin model to a polymer on a drug crystal alonzo2012 C46, C10.
  5. 2012
    hsieh2012pH-induced precipitation of ten weak basesD. Crystallization from solutionfirst proposed

    pH-Induced Precipitation Behavior of Weakly Basic Compounds: Determination of Extent and Duration of Supersaturation Using Potentiometric Titration and Correlation to Solid State Properties

    Known before
    crystallization-tendency classes from the undercooled melt and from rapid solvent evaporation (builds_on) hsieh2012 C5, P7.
    Added
    CheqSol titrations of ten weak bases at 37 °C, two behaviours (type 1 crystalline with supersaturation of 3.1–14.7 min; type 2 amorphous at 7.2–20.7 times the crystalline solubility), the comparison of the type 2 plateau with Hoffman estimates with and without a water-sorption correction, and two absorption models hsieh2012 R1, R5, R10, R14, R15.
    Relation
    first in the library to tie the form of a precipitate to the solution behaviour, and to propose the plateau as a way of measuring the amorphous solubility hsieh2012 C30, C32, C47.
    SupportsF1F2F14F19
  6. 2012
    ilevbare2012abinary additive combinations on ritonavir growthD. Crystallization from solutionfirst proposed

    Effect of Binary Additive Combinations on Solution Crystal Growth of the Poorly Water-Soluble Drug, Ritonavir

    Known before
    the single polymers ranked in 2012c and 2012b, lower polymer effectiveness at higher supersaturation (alonzo2012), and CAP Adp 0.85 as the best cellulose inhibitor (builds_on) ilevbare2012a C13, C18, C26.
    Added
    13 polymer pairs (best 12.1 against about 3 for each polymer), an equal-dose control for one pair, buffer strength and supersaturation series, and surfactants below the CMC that doubled growth and cancelled the esters ilevbare2012a R11, R12, R14, R16, R17.
    Relation
    first to test additive combinations; does not change the single-polymer rankings but shows that they do not predict pair behaviour ilevbare2012a K1, X7.
  7. 2012
    ilevbare2012bcellulose polymers: supersaturation, pH and rougheningD. Crystallization from solutionconfirmsextends

    Inhibition of solution crystal growth of ritonavir by cellulose polymers – factors influencing polymer effectiveness

    Known before
    the felodipine–HPMC study, with the adsorption and Kubota–Mullin framework and the nucleation-over-growth argument (builds_on), and the polymer screen of 2012c, with CAP Adp 0.85 as the best cellulose inhibitor ilevbare2012b R19, R18.
    Added
    growth inhibition at S 3.8, 7.6 and 15.3; the loss of the adipate esters at pH 3.8 despite higher adsorption; the critical supersaturation of 1.37 (1.74 with polymer); Kubota–Mullin factors of 4.35 and 1.25 ilevbare2012b R5, R7, R9, R12, R16.
    Relation
    extends alonzo2012 from felodipine and HPMC to ritonavir and cellulose adipates, confirms that inhibition falls with supersaturation, and first links the loss to kinetic roughening ilevbare2012b C17, C18, C51.
  8. 2012
    ilevbare2012cpolymer properties for ritonavir growth inhibitionD. Crystallization from solutionconfirms

    Understanding Polymer Properties Important for Crystal Growth Inhibition—Impact of Chemically Diverse Polymers on Solution Crystal Growth of Ritonavir

    Known before
    ritonavir as a slow crystallizer and polymers changing nucleation and growth at low concentration (builds_on) ilevbare2012c C7, C2.
    Added
    34 polymers at 5 µg/mL on seeded ritonavir, the solubility window of 14 new cellulose esters, the carboxyl-content trend, a multivariate model, and the effect of Pn-IPAAmd on crystal habit ilevbare2012c R9, R10, R11, R12, R4.
    Relation
    confirms for ritonavir that polymers act at low concentration (alonzo2012) and adds the hydrophobicity hypothesis ilevbare2012c C34, C25.
    SupportsF7F8F12F19
  9. 2013
    ilevbare2013aLLPS of eight drugs and the ritonavir phase diagramC. Amorphous solubility and LLPSfirst proposed

    Liquid-Liquid Phase Separation in Highly Supersaturated Aqueous Solutions of Poorly-Water Soluble Drugs – Implications for Solubility Enhancing Formulations

    Known before
    melting data, Log P, Tg and the slow-crystallizer class of the drugs from the 2010 classification study, and crystal solubilities and the water sorption method from the 2012 pH-induced precipitation study (builds_on).
    Added
    UV, DLS and pyrene onsets for eight drugs at 37 °C, the isolated ritonavir drug-rich phase (about 95% drug, 4–5% water, Tg 0.4 °C), a ritonavir temperature–concentration diagram, and tests of ionic strength, temperature, Tween 80, PVP and a ritonavir–PVP dispersion ilevbare2013a R8, R5, R6, R11, R13, R14, R16, R17.
    Relation
    first proposed in the library that the LLPS onset equals the water-corrected amorphous solubility and that this concentration caps free drug ilevbare2013a C3, C5.
  10. 2013
    ilevbare2013bpolymers and growth of three structurally diverse drugsD. Crystallization from solutionextends

    Impact of Polymers on Crystal Growth Rate of Structurally Diverse Compounds from Aqueous Solution

    Known before
    felodipine–HPMC (alonzo2012), no secondary nucleation for ritonavir and a pair factor of about 3.3 (2012a), supersaturation and ionization effects with CAP Adp 0.85 (2012b), the hydrophobicity hypothesis (2012c), and the nucleation-inhibitor ranking (2013c) (builds_on) ilevbare2013b C7, R16, R17, R19, C35.
    Added
    seeded growth of celecoxib, efavirenz and ritonavir with 16 polymers including three second-generation suberate and sebacate esters, the salt test, N–H band shifts for PVPVA, the pH test for celecoxib, and supersaturation series up to the amorphous level ilevbare2013b R9, R10, R12, R13, R14, R15.
    Relation
    extends the hydrophobicity hypothesis to other drugs and shows that the best polymer depends on the drug (HPMC for celecoxib, suberate esters for ritonavir) ilevbare2013b C21, C43, C44, C60.
  11. 2013
    ilevbare2013cpolymers and induction times of three drugsD. Crystallization from solutionconfirmsrevises

    Maintaining Supersaturation in Aqueous Drug Solutions: Impact of Different Polymers on Induction Times

    Known before
    the melt-quench classes of the three drugs, the felodipine–HPMC nucleation result, that polymers inhibit ritonavir growth poorly at high supersaturation, and the same polymer set tested on growth (builds_on) ilevbare2013c C11, R19, M1–M3.
    Added
    unseeded induction times of ritonavir, efavirenz and celecoxib with 21 polymers at the calculated amorphous solubility, the solubility-parameter rule, the pH 3.8 arm and the 31-fold gain for HPMC at half the supersaturation ilevbare2013c R9, R13, R14, R15.
    Relation
    confirms alonzo2012 that nucleation can be delayed far more than growth is slowed, and revises the growth rankings: the best nucleation inhibitors differ from the best growth inhibitors ilevbare2013c C40.
  12. 2013
    ilevbare2013dritonavir nanodroplets and additivesB. Supersaturation from ASD dissolutionconfirms

    Influence of Additives on the Properties of Nanodroplets Formed in Highly Supersaturated Aqueous Solutions of Ritonavir

    Note
    Known in the library (builds_on: Ilevbare 2013 on LLPS, Ilevbare 2013 on induction times, Ilevbare 2012, Hsieh 2012, Alonzo 2011): the LLPS concentration of ritonavir and its measurement by solvent shift or pH shift, the induction-time method with a 120 min baseline, cellulose polymers and the Tg of amorphous ritonavir, and the diffusion cap on dissolved dispersions ilevbare2013d R18, R17, R19.
    Added
    the colloid of a dissolving ritonavir dispersion is a non-crystalline drug-rich liquid (Tg about 1 °C) formed at about the LLPS concentration; four classes of 15 additives for droplet size and crystallization; crystallization that appears to start in the droplets ilevbare2013d R1, R2, R14, C39.
    Relation
    confirms and names the ceiling of Alonzo 2011 as the LLPS concentration ilevbare2013d C35; first in the library on additives at drug-rich droplets.
    Note
    Findings: F7, F9, F12, F13, F14.
  13. 2014
    hsieh2014polymers and pH-induced precipitation by synchrotron WAXSD. Crystallization from solutionextends

    Assessing the Impact of Polymers on the pH-Induced Precipitation Behavior of Poorly Water-Soluble Compounds using Synchrotron Wide Angle X-Ray Scattering

    Known before
    rapid against reluctant crystallizers after a pH shift (hsieh2012), the melt classes, the hydrogen-bond donor and acceptor reasoning for polymers, and polymer hydrophobicity in growth and nucleation inhibition (builds_on) hsieh2014 R22, R18, C35, C39.
    Added
    four ionizable drugs precipitated alone and with nine polymers at 1 mg/mL, WAXS at 15 min to 6 h, concentration against the polymer-specific crystalline solubility, and a Hoffman check of the warfarin supersaturation hsieh2014 R4, R12, R13, R16.
    Relation
    extends hsieh2012 to polymers; shows that the same polymers redirect precipitation to an amorphous solid for the two acids and not for the two bases, and that the melt class does not predict the outcome hsieh2014 C4, C9, C30.
    SupportsF1F2F8F16F19
  14. 2014
    jackson2014polymers and precipitation of supersaturated danazolD. Crystallization from solutionextends

    Impact of Polymers on the Precipitation Behavior of Highly Supersaturated Aqueous Danazol Solutions

    Known before
    SHG detection of crystals, particle-size effects on the UV signal, the UV-extinction method for LLPS with an onset near the amorphous solubility, and the pyrene approach (builds_on) jackson2014 R29, R28, C11–C13.
    Added
    the danazol onset of 13 µg/mL by two methods, crystallization within 6–10 min, polymers lowering the onset to 8–11 µg/mL and prolonging crystallization to 88–516 min, droplet sizes and zeta potentials jackson2014 R5, R17, R22, R23.
    Relation
    extends the LLPS onset of ritonavir to a faster crystallizer and, unlike ritonavir, finds polymers lowering the onset jackson2014 C22, C23, R28.
  15. 2014
    raina2014bnifedipine polymorphs during dissolutionB. Supersaturation from ASD dissolutionextendscontradicts

    Impact of Polymers on the Crystallization and Phase Transition Kinetics of Amorphous Nifedipine during Dissolution in Aqueous Media

    Note
    Known in the library (builds_on: Alonzo 2010, 2011 and 2012, Marsac 2006 and 2008, Baird 2010, Raina 2014 on LLPS): the two routes and the felodipine polymer effects, nifedipine as a faster crystallizer than felodipine at similar Tg and moisture sorption, and no nifedipine solubility gain with 1 mg/mL polymer raina2014b C1, R17, C26.
    Added
    matrix crystallization of nifedipine glass that dissolved polymer does not change, γ before α on both routes with dissolved polymers lengthening γ (HPMCAS > HPMC > PVP), dispersions that switch the route to solution, and MCR to quantify forms without calibration raina2014b C11, C29, C17, C21, C43.
    Relation
    extends Alonzo 2010 to a fast crystallizer and to polymorph conversion; contradicts the felodipine result that polymer in the medium protects the wetted solid raina2014b C27.
    Note
    Findings: F1, F2, F3, F10.
  16. 2015
    almeidaesousa2015amorphous solubility of six fast crystallizers; heat-capacity methodC. Amorphous solubility and LLPSconfirmsrevises

    Assessment of the Amorphous “Solubility” of a Group of Diverse Drugs Using New Experimental and Theoretical Approaches

    Known before
    the onset method and its link to Eq. 1 from the 2013 paper, and the crystallization free energy of felodipine and nifedipine from the 2006 stability study (builds_on).
    Added
    six fast-crystallizing drugs at 25 °C, two of them glasses, with extinction and a polarity-probe check; free energies by the Hoffman equation and by a heat-capacity (Cp) method to the supercooled liquid and the glass almeidaesousa2015 R3, R5, R11, C10.
    Relation
    confirms that the onset matches the calculated amorphous solubility for fast crystallizers and glassy drugs almeidaesousa2015 C42; revises the free-energy route, the Cp method being closer than Hoffman almeidaesousa2015 C43.
  17. 2015
    chen2015bile salts as crystallization inhibitors of 11 drugsD. Crystallization from solutionfirst proposedextends

    Bile Salts as Crystallization Inhibitors of Supersaturated Solutions of Poorly Water-Soluble Compounds

    Known before
    STC inhibits celecoxib nucleation and stays below its CMC with the drug, polymers are the benchmark inhibitors, and the induction-time approach (builds_on) chen2015 R9, R11, C3.
    Added
    induction times of 11 drugs at a matched ratio of concentration to solubility in buffer, with 0.1% STC and with 0.1% SDS (STC 15 to more than 1000 min, SDS shorter for seven of nine drugs), solubility 1.1–3.5-fold higher with STC and up to about 266-fold with SDS, and SGC and SGDC for two drugs chen2015 R1, R3, R4.
    Relation
    first in the library to test a bile salt across many drugs and to set it against a conventional surfactant; extends the celecoxib result chen2015 C13, C18, C25.
  18. 2015
    chen2015asurfactants in celecoxib–HPMCAS suspensionsB. Supersaturation from ASD dissolutionfirst proposed

    Impact of Surfactants on the Crystallization of Aqueous Suspensions of Celecoxib Amorphous Solid Dispersion Spray Dried Particles

    Note
    Known in the library (builds_on: Ilevbare 2013 on induction times): the induction-time method at constant supersaturation chen2015a P9.
    Added
    SDS and polysorbate 80 crystallized acidified suspensions within an hour, STC and Triton X100 slowed nucleation, SDS dissolved far more HPMCAS and drug, and a trace of HPMCAS reversed the Poloxamer 188 result chen2015a R14, R12, R18, R19.
    Relation
    first in the library on surfactants in ASD suspensions; agrees with the surfactant promotion of ritonavir droplet crystallization of 2013 ilevbare2013d R12.
    Note
    Findings: F14, F15, F6, F1.
  19. 2015
    indulkar2015pH dependence for weak basesC. Amorphous solubility and LLPSextends

    pH-Dependent Liquid−Liquid Phase Separation of Highly Supersaturated Solutions of Weakly Basic Drugs

    Known before
    the onset as the amorphous solubility, also for a glassy phase (the 2013 and 2015 papers above), and the pH-shift titration method and amorphous precipitation of weak bases from the 2012 pH-induced precipitation study (builds_on).
    Added
    three weak bases over about ±2 pH units around the pKa, a solvent-free titration, XRPD, microscopy, Nile red, DSC of the precipitates and dissolution of amorphous films indulkar2015 R5, R6, R7, R8, R19, R18.
    Relation
    extends the framework to ionizable drugs: the onset follows Henderson–Hasselbalch with a constant un-ionized concentration indulkar2015 C3, C46; the calculation fits atazanavir closely and clotrimazole within 1.6-fold indulkar2015 R2, F3.
  20. 2015
    jackson2015danazol dispersions, LLPS, drug loading and polymerB. Supersaturation from ASD dissolutionconfirmsextends

    Dissolution of Danazol Amorphous Solid Dispersions: Supersaturation and Phase Behavior as a Function of Drug Loading and Polymer Type

    Note
    Known in the library (builds_on: Jackson 2014, Ilevbare 2013 on LLPS, Ilevbare 2013 on nanodroplets, Almeida e Sousa 2015, Raina 2014 on LLPS, Van Eerdenbrugh 2011): danazol crystalline solubility and polymer effects, LLPS onset near the estimated amorphous solubility, the diffusion-cell flux method, the UV overestimate with particles, and ASD dissolution above the amorphous solubility jackson2015 R11, C3, C12, C7.
    Added
    LLPS on dissolution up to 30% drug with three polymers, free drug by flux at 7.1–9.1 µg/mL against 8 µg/mL whatever the polymer, polymer-dependent duration (PVP < HPMC < HPMCAS), and slow release at 50% drug jackson2015 C36, R9, R5, C37.
    Relation
    confirms the ceiling by flux for three polymers ("is confirmed here") jackson2015 C30; extends the 2013 ritonavir colloid to danazol.
    Note
    Findings: F4, F6, F7, F9, F10.
  21. 2015
    mosqueragiraldo2015glass–liquid phase separation of telaprevirC. Amorphous solubility and LLPSconfirmsextendscontradicts

    Glass–Liquid Phase Separation in Highly Supersaturated Aqueous Solutions of Telaprevir

    Known before
    LLPS at the amorphous solubility for low-Tg drugs (2013 paper), the flux plateau at the LLPS concentration and the reservoir idea from the 2014 membrane-transport study, and the sorption method (builds_on).
    Added
    a high-Tg, high-melting drug: three onsets (UV, NMR, fluorescence) at 90–92 µg/mL, a pellet Tg of 52 °C, redissolution within about 2 min, NMR and flux plateaus, and three free-energy estimates mosqueragiraldo2015 R13, R2, R8, R10, R12.
    Relation
    extends the framework to a glassy drug-rich phase; contradicts the Hoffman route for this drug (245 against 90–92 µg/mL) and supports a supercooled-liquid reference state mosqueragiraldo2015 R13, C23, C27; confirms the flux plateau mosqueragiraldo2015 C20.
  22. 2015
    raina2015bsix dihydropyridines by synchrotron WAXSD. Crystallization from solutionextends

    Trends in the Precipitation and Crystallization Behavior of Supersaturated Aqueous Solutions of Poorly Water-Soluble Drugs Assessed Using Synchrotron Radiation

    Known before
    the melt classes of undercooled melts, LLPS above the amorphous solubility, and moderately hydrophobic polymers as inhibitors (builds_on) raina2015b C5, C7, C44.
    Added
    the first crystalline time of six analogues precipitated from a nominal 10 mg/mL (0.25 to 12 h), eight polymers at 4.5 mg/mL, 3-h concentrations against estimated amorphous solubilities and NMR partitioning of four polymers with felodipine raina2015b R6, R9, R10, R12.
    Relation
    extends hsieh2014 (WAXS of precipitates with polymers) to a close set of analogues; shows that the melt screen cannot clear slow crystallizers and proposes that an inhibitor needs affinity for both the precipitate and the water raina2015b C29, C48.
  23. 2015
    schram2015HPMCAS conformation and felodipine growthD. Crystallization from solution

    Impact of Polymer Conformation on the Crystal Growth Inhibition of a Poorly Water-Soluble Drug in Aqueous Solution

    Known before
    carboxylated cellulose esters were less effective at lower pH although they adsorbed as much, and conformation was proposed as the reason (ilevbare2012b, ilevbare2013b; builds_on) schram2015 R26, C2.
    Added
    growth ratios of 2.29 at pH 6.8 and 1.28 at pH 3 on a rotating disc, in-liquid AFM of adsorbed HPMCAS (globules about 44 nm apart at pH 3, a thin layer at pH 6.8), the same area imaged after a pH rise, and AFM-IR schram2015 R4, R12, R17, R10, R18, R20.
    Relation
    tests the conformation proposal of the 2012–2013 papers; the link to inhibition is a correlation across two pH values schram2015 C20, X7.
  24. 2015
    trasi2015acetaminophen nucleation and growth with five polymersD. Crystallization from solutionrevises

    Evaluating the influence of polymers on nucleation and growth in supersaturated solutions of acetaminophen

    Known before
    the melt ranks of the same five polymers for nucleation and growth (builds_on) trasi2015 R14.
    Added
    a Poisson fit of about 80 induction times per sample, crystal counting in a larger vessel, seeded growth and habit at S 1.5 trasi2015 R1, R3, R10, R11, R12.
    Relation
    revises the melt ranking for solution (PAA reversed from best growth inhibitor to nucleation promoter), and shows that induction time and count slope rank PVPVA differently trasi2015 C26, C28, C22.
  25. 2015
    trasi2015aa second drug in the drug-rich phaseC. Amorphous solubility and LLPSextends

    Thermodynamics of Highly Supersaturated Aqueous Solutions of Poorly Water-Soluble Drugs—Impact of a Second Drug on the Solution Phase Behavior and Implications for Combination Products

    Known before
    the LLPS concentration equals the amorphous solubility and probes mix into the drug-rich phase (2013 paper), flux maximum at LLPS and the ultracentrifuge supernatant as a binodal point (2014 membrane-transport study), and the estimation of the amorphous solubility (builds_on).
    Added
    ritonavir with lopinavir, paclitaxel, felodipine and diclofenac; onsets by fluorescence, ultracentrifugation and flux; partitioning into a pre-formed ritonavir-rich phase; an ideal-mixing model trasi2015a R7, R13, R9, R16.
    Relation
    new; extends the ceiling to mixtures, where each drug's amorphous solubility falls with its mole fraction in the shared phase trasi2015a C35, C50.
  26. 2015
    trasi2015bbinary amorphous drug combinationsB. Supersaturation from ASD dissolutionextends

    Dissolution performance of binary amorphous drug combinations—Impact of a second drug on the maximum achievable supersaturation

    Note
    Known in the library (builds_on: Trasi 2015 on a second drug, Ilevbare 2013 on LLPS, Raina 2014 on LLPS): a second drug lowers the amorphous solubility in antisolvent tests, LLPS above the amorphous solubility, and the amorphous solubility caps free drug and membrane transport trasi2015b C7, C4.
    Added
    the drop of each ceiling to about Sa × xd in dissolving films and in PVP and HPMCAS dispersions, the same drop from two dispersions dissolved together, colloids of HPMCAS dispersions that pass 0.45 µm filters, and slower crystallization of the mixed drug-rich phase trasi2015b R5, R13, R11, R7, R15.
    Relation
    extends the antisolvent result of the LLPS chapter to dissolution; first in the library on co-dosed amorphous products trasi2015b C47.
    Note
    Findings: F11, F7, F8, F10, F13.
  27. 2015
    wegiel2015resveratrol dispersions in aqueous mediaB. Supersaturation from ASD dissolutionextends

    Phase Behavior of Resveratrol Solid Dispersions Upon Addition to Aqueous media

    Note
    Known in the library (builds_on: Alonzo 2010, Van Eerdenbrugh 2010, Alonzo 2011, Wegiel 2013, Raina 2014): the two crystallization routes, resveratrol as a rapid crystallizer, a felodipine dispersion with a flux ten times that of the crystal, and the storage stability of the same resveratrol dispersions (PVP and E100 stable, HPMC, HPMCAS and CMCAB crystallized at high RH); diffusion-cell flux as a measure of free drug wegiel2015 R21, R22, R24.
    Added
    dissolved HPMCAS raised the crystalline solubility of resveratrol from 42 to 414 µg/mL at 10 mg/mL, PVP solutions first dissolved and then precipitated resveratrol with the polymer, only 80% HPMC, 85% HPMCAS or 95% CMCAB stopped matrix crystallization, and more HPMCAS dispersion raised the total concentration while the flux fell wegiel2015 R2, R3, R6, R7, R14, R19, R20.
    Relation
    extends the matrix route of Alonzo 2010 to dispersions of a rapid crystallizer; first in the library to separate a soluble drug–polymer complex from supersaturation by flux during dispersion dissolution wegiel2015 C41.
    Note
    Findings: F16, F17, F1, F7.
  28. 2015
    xie2015celecoxib dispersions with polymer combinationsB. Supersaturation from ASD dissolutionconfirms

    Dissolution Performance of High Drug Loading Celecoxib Amorphous Solid Dispersions Formulated with Polymer Combinations

    Note
    Known in the library (builds_on: Alonzo 2010, Trasi 2012, Ilevbare 2013 on induction times, Chen 2015, Trasi 2015 on acetaminophen): the matrix and solution routes, PAA as a solid-state growth inhibitor, the induction-time approach and the stronger effect of amphiphilic than hydrophilic polymers on lipophilic drugs, the onset criterion for celecoxib, and a polymer that fails as a solution inhibitor xie2015 C10, C47.
    Added
    HPMCAS and HPMC held 22 µg/mL celecoxib for more than 8 h against about 1–2 h with PVP; neat amorphous celecoxib crystallized on its own particles and gave almost no supersaturation; at 50% drug replacing a fifth of the PVP with HPMCAS or HPMC kept supersaturation for 16 h but slowed release, and 5 µg/mL of either in the medium protected the PVP-K12 dispersion xie2015 R1, R7, R4, R6.
    Relation
    confirms the cellulosic-over-PVP ranking for a third drug; first in the library on two polymers in one dispersion for dissolution, where little earlier work existed xie2015 C30.
    Note
    Findings: F4, F20, F1, F2, F6, F10.
  29. 2016
    almeidaesousa2016salt, co-crystal, glass and ASD of a weak baseC. Amorphous solubility and LLPSextendsrevises

    Supersaturation Potential of Salt, Co-Crystal, and Amorphous Forms of a Model Weak Base

    Known before
    ASD dissolution capped at the amorphous solubility (2011 study), UV probe overreading with submicron particles (2011 methods study), pH-shift supersaturation of weak bases (2012), and Eq. 1 with the onset methods (2013 and 2015 papers) (builds_on).
    Added
    seven solid forms of CRH1 dissolved at pH 4.6 with and without 20 µg/mL HPMC, pyrene and counterion fluorescence, and centrifugation with HPLC at the UV maximum almeidaesousa2016 R8, R9, R11, R12.
    Relation
    extends the ceiling to salts and an ASD, shown for four of seven forms, not for the glass and the co-crystal almeidaesousa2016 C43, C31; revises UV readings of a salt with an absorbing counterion almeidaesousa2016 R12.
  30. 2016
    jackson2016supersaturated danazol: polymers and phase transitionsD. Crystallization from solutionconfirmsrevises

    Characterization of Supersaturated Danazol Solutions – Impact of Polymers on Solution Properties and Phase Transitions

    Known before
    the onset of 13 µg/mL, the estimate of 16 µg/mL and the lower onsets with polymer of the first danazol paper (builds_on) jackson2016 R12, R4.
    Added
    an onset of about 8 µg/mL by four methods with and without polymer, a recalculated estimate of 7.8 µg/mL, the flux plateau, the pyrene reading at 15 s, 1 min and 5 min, induction times at 1–1000 µg/mL polymer, zeta potential and droplet size jackson2016 R3, R8, R10, R13, R17, R18, R19, R21.
    Relation
    revises jackson2014: the polymers do not lower the onset or the flux, and the 13 µg/mL was a 15 s reading; confirms the induction-time ranking HPMC-AS > HPMC > PVP jackson2016 C14, C20, C54.
  31. 2016
    li2016a13 bile salts comparedD. Crystallization from solutionextends

    A Comparison of the Crystallization Inhibition Properties of Bile Salts

    Known before
    STC, SGC and SGDC delay nucleation (chen2015; builds_on) li2016a R30, C10.
    Added
    13 bile salts with three drugs at 0.1%, a concentration series with STC, a diffusion-cell check of the driving force, hydrophobicity (LogP'A), simulations of nevirapine with four bile salts and a blend of the six main human bile salts li2016a R6, R7–R11, R15, R16, R17–R27, R28.
    Relation
    answers the open question of chen2015 (bile salts are not interchangeable) and extends it to 13 bile salts li2016a C3, C69.
  32. 2016
    li2016blopinavir dispersions leaching in acidB. Supersaturation from ASD dissolutionextends

    Leaching of Lopinavir Amorphous Solid Dispersions in Acidic Media

    Note
    Known in the library (builds_on: Chen 2015, Raina 2015): the spray-drying procedure, the CMC method and the question of surfactants in ASD suspensions, and the apparent supersaturation C/Ceq in solubilizing media li2016b C3, C7.
    Added
    33% lopinavir dispersions with three HPMCAS grades and HPMCP leached drug to between the crystalline and the amorphous solubility at pH 3 and little polymer; five surfactants raised leaching about as much as the crystalline solubility, so C/Ceq stayed about constant for each polymer; at pH 5 SDS raised drug and polymer leaching sharply; SDS with PVPVA gave the most li2016b R3, R4, R19, R20, R13, R17.
    Relation
    extends Chen 2015 from celecoxib to lopinavir, a slow crystallizer chosen so that leaching could be measured without concurrent crystallization li2016b C5, to more surfactants and to pH 5.
    Note
    Findings: F19, F15, F18.
  33. 2016
    mosqueragiraldo2016cellulose polymers and telaprevirD. Crystallization from solutionconfirms

    Mechanistic Design of Chemically Diverse Polymers with Applications in Oral Drug Delivery

    Known before
    matching the solubility parameter and ionized carboxylates for polymers of one chemistry (ilevbare2013c), the glass–liquid phase separation of telaprevir and the pH dependence of the HPMCAS conformation (builds_on) mosqueragiraldo2016 C4, C5, C27, R1, R24.
    Added
    26 polymers (commercial and 18 new cellulose derivatives) at 80 and 150 µg/mL telaprevir, pH 3.0, polymer levels of 5–50 µg/mL, SEM of the crystals, DFT solvation energies and MD of seven oligomers mosqueragiraldo2016 R4–R9, R16, R19.
    Relation
    confines the solubility-parameter rule to uniform chemistry, confirms the need for ionized carboxylates and adds the effect of spacer length mosqueragiraldo2016 C25, C28, C58.
  34. 2016
    schram2016surface poisoning and seed originD. Crystallization from solutionfirst proposed

    Polymer Inhibition of Crystal Growth by Surface Poisoning

    Known before
    HPMC and HPMCAS inhibit felodipine growth by adsorption and pinning, and the felodipine solubility (alonzo2012, schram2015; builds_on) schram2016 C2.
    Added
    four routes of seed formation, polymer pre-adsorbed on seeds, the pinning spacing and critical radius, and SDS with HPMCAS schram2016 R2, R3, R12, R14, R16.
    Relation
    first in the library to show that seed origin changes the inhibition by a polymer and that polymer only pre-adsorbed is overgrown; images the pinning of steps schram2016 C38, C39.
  35. 2016
    trasi2016commercial tacrolimus capsulesB. Supersaturation from ASD dissolutionconfirms

    Non-Sink Dissolution Behavior and Solubility Limit of Commercial Tacrolimus Amorphous Formulations

    Note
    Known in the library (builds_on: Alonzo 2011, Raina 2014, Almeida e Sousa 2015, Raina 2015, Trasi 2015 on a second drug, Jackson 2016): a maximum achievable supersaturation set by the amorphous solubility, flux proportional to activity with a plateau there, polymers with minimal impact on the amorphous solubility while small molecules lower and micelles raise it, and high-loading dispersions that may not form nanospecies trasi2016 C25, C32, C34, C41.
    Added
    an amorphous solubility of 49 µg/mL against 1.4 µg/mL for the crystal (ratio about 35); six marketed capsules dissolved to, not past, that limit; their flux reached the pure-drug plateau; 50 µg/mL HPMC delayed crystallization of 50 µg/mL tacrolimus from within 3 h to 6–8 h trasi2016 R4, R16, R13, R14, R15, R9.
    Relation
    confirms the ceiling of the earlier dispersion studies for marketed products; first in the library on the solution-phase behaviour of commercial amorphous formulations trasi2016 C6.
    Note
    Findings: F7, F8, F9, F10, F4.
  36. 2016
    xie2016acelecoxib with PAA and cellulose derivativesB. Supersaturation from ASD dissolutionextendsrevises

    Improved Release of Celecoxib from High Drug Loading Amorphous Solid Dispersions Formulated with Polyacrylic Acid and Cellulose Derivatives

    Note
    Known in the library (builds_on: Alonzo 2010, Alonzo 2012, Ilevbare 2013 on induction times): the two routes, the seeded-growth method and the nucleation-rate estimate, PAA as a poor nucleation inhibitor and the amphiphilic cellulose derivatives as the best precipitation inhibitors xie2016a C3, C7, C19.
    Added
    5 µg/mL HPMCAS slowed celecoxib nucleation about 4000-fold and seeded growth about 70-fold; PAA dispersions released fast and crystallized, and released only about half even with HPMCAS in the medium, leaving needle crystals in the residue; PAA with 10% HPMCAS or HPMC released completely at 30% drug and partly at 50%; IR read PAA and HPMCAS as immiscible and PAA and HPMC as partly miscible xie2016a R13, R12, R9, R10, R14, R17, R20, R21.
    Relation
    revises, for celecoxib, the growth reading of the 2008 felodipine solutions toward nucleation (F5); extends the polymer combinations of Xie 2015 to PAA.
    Note
    Findings: F4, F5, F10, F16, F2, F20.
  37. 2017
    indulkar2017aatazanavir in SDS micellesC. Amorphous solubility and LLPSrevises

    Impact of Micellar Surfactant on Supersaturation and Insight into Solubilization Mechanisms in Supersaturated Solutions of Atazanavir

    Known before
    the solvent-shift LLPS onset as the experimental amorphous solubility (2013 paper), the flux maximum at the amorphous solubility and flux as a measure of activity (2014 membrane-transport study), the preparation of atazanavir free base and its glass–liquid phase separation (2015 weak-base paper), flux-based activity with solubilizing additives with about 2:1 activity to concentration ratio for felodipine (2015 additive study) and the nanodroplet reservoir sustaining the maximum flux (2016) (builds_on) indulkar2017a R28, C3.
    Added
    one drug and one surfactant (0–3.6 mg/mL SDS): crystalline solubility, LLPS onset, flux-derived free drug and activity ratio, the micelle/water partition coefficient with a Langmuir fit, emission, energy transfer to curcumin, molecules per micelle and micelle size by NMR indulkar2017a R7, R8, R11, R13, R14, R16, R22, R24, R25.
    Relation
    new; shows that the concentration ratio understates supersaturation about twofold while the activity ratio at the amorphous solubility is unchanged by SDS, and revises the crystal-based prediction of the amorphous solubility for micellar media (overshoot twofold) indulkar2017a C21, C16, C43.
  38. 2017
    indulkar2017borigin of nanodroplets from dissolving nifedipine dispersions, isotope scramblingA. Release mechanism and LoCfirst proposed

    Origin of Nanodroplet Formation upon Dissolution of an Amorphous Solid Dispersion: A Mechanistic Isotope Scrambling Study

    Note
    Known in the library (builds_on: Alonzo 2011, Ilevbare 2013 on LLPS, Jackson 2015, Indulkar 2016): certain dispersions form nanodroplets on dissolution, more often at low loading, depending on polymer type and loading indulkar2017b C6; above the amorphous solubility excess drug separates as water-saturated drug-rich droplets indulkar2017b C3; the droplets sustain the maximum membrane flux as a reservoir indulkar2017b C4; two proposed origins, dissolution followed by LLPS (mechanism I) or release of drug-rich domains formed by AAPS in the hydrated matrix (mechanism II, cited) indulkar2017b C7, C8.
    Added
    a deuterium label in the medium diluted as full mixing predicts when nifedipine dispersions with HPMC-E5 or PVPVA dissolved at 5 °C, with slow droplet–solution exchange at that temperature, and release that continued into water saturated at the amorphous solubility indulkar2017b R11, R3, R8, R9.
    Relation
    first in the library to test where the nanodroplets of a dissolving dispersion come from; supports mechanism I for these systems ("strongly suggest") indulkar2017b C26.
    Note
    Findings: F1, F2, F4, F5.
  39. 2017
    lu2017maintaining supersaturation with bile saltsD. Crystallization from solutionextends

    Maintaining Supersaturation of Active Pharmaceutical Ingredient Solutions with Biologically Relevant Bile Salts

    Known before
    the nucleation inhibition by STC and by 13 bile salts (chen2015, li2016a), the activity calibration of telaprevir with each bile salt (chapter C) and the glassy droplets (builds_on) lu2017 C4, C6, C5.
    Added
    induction times at equal activity (δ 11.5 and 28.8), 1.86 and 12 mM bile salt, an STC series below its CMC, the zeta potential of droplets, seeded growth with STC and SGC, and HPMCAS-MF as comparator lu2017 R3, R4, R6, R8, R9, R11.
    Relation
    extends li2016a to equal activity, adds the monomer–micelle contrast and the effect of a drug-rich phase on the ranking of the bile salts lu2017 C28, C41, C42.
  40. 2017
    lu2017abile salts: growth rate and residual supersaturationD. Crystallization from solution

    Impact of Bile Salts on Solution Crystal Growth Rate and Residual Supersaturation of an Active Pharmaceutical Ingredient

    Known before
    the unseeded induction times of lu2017 (taken first because this paper builds on them), chen2015, li2016a with STCDC the strongest, and the effect of seed preparation (schram2016; builds_on) lu2017a R16, R17, C45.
    Added
    seeded growth at δ 2.4, 7.9 and 12.5 with six bile salts at 1.86 and 12 mM, 15 h residual free drug, zeta potential of seeds and an estimate of nucleation against growth inhibition lu2017a R7–R14.
    Relation
    separates growth from nucleation inhibition for bile salts: STCDC and SGCDC stop growth as monomers, STC, SGC, STDC and SGDC act mainly on nucleation lu2017a C32, C36, C37.
    SupportsF6F7F9F20F33
  41. 2017
    lu2017bsix bile salts and telaprevirC. Amorphous solubility and LLPSconfirmsextendscontradicts

    Impact of Endogenous Bile Salts on the Thermodynamics of Supersaturated Active Pharmaceutical Ingredient Solutions

    Known before
    telaprevir glass–liquid phase separation at 90–92 µg/mL, the model-drug choice and an earlier onset in 100 mM buffer (2015 paper), flux as a measure of activity and concentration against activity supersaturation with additives (2015 additive study), a miscible second solute lowers the maximum supersaturation (2015 second-drug study) and lower maximum supersaturation and transport with a second solute (2016 multidrug ASD study); STC inhibits crystallization of celecoxib (builds_on) lu2017b R19, R24.
    Added
    six bile salts at 1.86 and 12 mM in 50 mM pH 6.5 buffer: crystalline solubility, GLPS onset by extinction, ultracentrifugation and flux, flux against concentration, activity against concentration supersaturation and phase boundaries, and an ionic-strength check of the onset lu2017b R1, R2, R6, R9, R12, R13, R17, R18.
    Relation
    confirms the flux plateau at the GLPS onset for telaprevir and the lowering of the limit by ionic strength; extends the lowering by a miscible second solute to STCDC and SGCDC; shows that concentration-based and activity-based supersaturation drift apart in bile-salt media; contradicts the use of STC alone as a surrogate for the bile salts lu2017b C18, C20, C31, C39, C52.
  42. 2017
    purohit2017britonavir dispersions during hydration and dissolutionA. Release mechanism and LoCfirst proposed

    Phase Behavior of Ritonavir Amorphous Solid Dispersions during Hydration and Dissolution

    Note
    Known in the library (builds_on: Rumondor 2009, 2010 and 2011, Alonzo 2011, Ilevbare 2013 on LLPS, Purohit 2015 on phase separation kinetics, Raina 2015 on fluorescent probes): water can separate a hydrated dispersion into drug-rich and drug-lean domains (AAPS) purohit2017b C9; hygroscopic polymers favour it purohit2017b C45; 50% ritonavir–PVP and –PVPVA dispersions had separated within 10 s of water contact purohit2017b R20; LLPS above the amorphous solubility, for ritonavir at a similar concentration by several routes purohit2017b C10, C47.
    Added
    all PVP and PVPVA films separated at 97% RH and HPMCAS films did not purohit2017b C1; only low-loading PVP and PVPVA and all HPMCAS films passed the amorphous solubility and formed nanodroplets, and drug kept pace with the polymer only where they formed purohit2017b R11, R7, C52; humid storage removed LLPS from PVP and PVPVA dispersions purohit2017b C53.
    Relation
    first in the library to link water-induced phase separation with loss of LLPS on dissolution; argues against matrix domains as the source of the droplets ("we find no evidence") purohit2017b C56.
    Note
    Findings: F3, F4, F5, F8, F11, F12.
  43. 2017
    xie2017indomethacin with EPO and HPMCB. Supersaturation from ASD dissolutionextends

    Impact of Eudragit EPO and Hydroxypropyl Methylcellulose on Drug Release Rate, Supersaturation, Precipitation Outcome and Redissolution Rate of Indomethacin Amorphous Solid Dispersions

    Note
    Known in the library (builds_on: Alonzo 2010, Raina 2014, Indulkar 2016, Xie 2016): HPMC inhibits indomethacin crystallization and the calculated amorphous solubility at 37 °C, UV extinction for the amorphous solubility, drug-rich nanodroplets as a reservoir, and the ternary of a fast-dissolving polymer with a crystallization inhibitor xie2017 R29, R30, C42.
    Added
    EPO raised both solubilities of indomethacin but did not inhibit crystallization; with HPMC the drug stayed supersaturated up to the amorphous solubility (36 µg/mL), where 70–100 nm droplets formed; the EPO–HPMC ternary released fast into nanodroplets; after a rise to pH 5 these redissolved within about 2 min, while the α precipitate of the EPO dispersion redissolved faster than sieved crystals but only to 32.1 of 40 µg/mL; a shift to pH 6.8 hid the differences; the ternary stayed amorphous in storage xie2017 R1, R3, R4, R6, R15, R20, R19, R22, R26.
    Relation
    extends the ternary idea of Xie 2016 to a polymer that dissolves in acid; first in the library on redissolution of a crystalline precipitate after a pH rise xie2017 C61.
    Note
    Findings: F21, F20, F17, F9, F4, F10, F3.
  44. 2018
    bhardwaj2018surface-area-normalized dissolution of spray-dried and melt-extruded itraconazole–PVPVAA. Release mechanism and LoCfirst proposed

    Surface area normalized dissolution to study differences in itraconazole-copovidone solid dispersions prepared by spray-drying and hot melt extrusion

    Note
    Known in the library (builds_on: Purohit 2015 on ITZ–HPMC miscibility, Li 2017, Mugheirbi 2017): pyrene fluorescence and TEM contrast to detect drug-rich domains, and water in the solvent as a cause of drug-rich domains bhardwaj2018 C37.
    Added
    constant-area compacts with drug and polymer assayed and loading-normalized rates bhardwaj2018 P6, P7, E4, R11; amorphous ITZ dissolving about 18 times faster than the crystal bhardwaj2018 R5; a switch between 25 and 20% (spray-dried) and 20 and 10% (melt-extruded) bhardwaj2018 X6; the spray solvent changing surface drug content and release at 20% bhardwaj2018 R13, R20.
    Relation
    first in the library with the surface-normalized two-component method, which the later papers take over saboo2019 P9; saboo2020a P6.
    Note
    Findings: F1, F2, F3, F6, F14.
  45. 2018
    indulkar2018lecithin and a six-bile-salt simulated intestinal fluidD. Crystallization from solutionfirst proposedextends

    Crystallization from Supersaturated Solutions: Role of Lecithin and Composite Simulated Intestinal Fluid

    Known before
    bile salts delay crystallization by different amounts, linked to hydrophobicity (chen2015, li2016a), the flux-based supersaturation of atazanavir in micellar SDS and the solvent-shift onset as the amorphous solubility (chapter C), and supersaturation against solubilization for membrane transport (builds_on) indulkar2018 C4, C1, P7.
    Added
    atazanavir in 3 mM STC with 0–0.75 mM lecithin (crystalline solubility about 1 µg/mL throughout, amorphous 38 → about 82 µg/mL, flux-based supersaturation about 40 → 63–66, induction time about 595 → 43 min against about 170 in buffer), six single bile salts with lecithin, and FaSSIF-V1 against a Composite-SIF of the six main human bile salts for four drugs at each medium's amorphous solubility indulkar2018 R6, R10, R16, R18, R20.
    Relation
    first in the library to add lecithin to a bile-salt crystallization test and to compare media at a flux-measured equal supersaturation; extends li2016a (bile salts not interchangeable) to mixed micelles and finds lecithin turning taurocholate from an inhibitor into a medium that crystallizes faster than buffer indulkar2018 C20, C43, C17.
  46. 2018
    li2018lopinavir with insoluble polymersB. Supersaturation from ASD dissolutionextends

    Tailoring supersaturation from amorphous solid dispersions

    Note
    Known in the library (builds_on: Ilevbare 2013 on LLPS, Almeida e Sousa 2015, Trasi 2015 on a second drug, Trasi and Taylor 2015, Li 2016): the amorphous solubility as the maximum free drug concentration and its measurement by UV scattering, a second miscible drug that lowers the maximum supersaturation, and lopinavir as a slow crystallizer li2018 C8, C9, C11.
    Added
    insoluble polymers mixed with lopinavir lowered the 48-h concentration below the 17.4 µg/mL amorphous solubility, most at low drug loading, EC and HPMCP at 15% to about the crystalline solubility; the phase-separated CA and EUD dispersions and a physical mixture were hardly suppressed; the most suppressed HPMCP dispersion crystallized slowest in suspension li2018 R3, R8, R14, R6, R7, C61.
    Relation
    extends the second-drug drop of Trasi and Taylor 2015 (F11) from a drug to an undissolved polymer, as its hypothesis li2018 C10; first in the library on solubility suppression by polymers.
    Note
    Findings: F18, F7, F16.
  47. 2018
    lu2018bile salt mixtures, six-bile-salt lecithin media and HPMCAS-MF with telaprevirD. Crystallization from solutionextends

    Compositional Effect of Complex Biorelevant Media on the Crystallization Kinetics of an Active Pharmaceutical Ingredient

    Known before
    the single bile salt induction times and growth ratios of telaprevir at equal activity, the activity calibration in buffer, bile salts not interchangeable with a human blend twice as effective as STC for celecoxib, HPMCAS-MF as one of the strongest telaprevir inhibitors, and the glassy drug-rich phase at δ 28.8 (builds_on) lu2018 R11, R12, R13, R16, C6.
    Added
    binary and ternary bile salt mixtures at 1.86 mM (more than 960 min at δ 11.5) and at 3.72–5.58 mM (about 255 min), seeded growth with the binary mixture (ratios about 35.5 and 7.4), buffer about 29 and FaSSIF about 21 min against more than 960 min in two six-bile-salt lecithin media, and 150 µg/mL HPMCAS-MF at δ 28.8 in media with and without lecithin lu2018 R3, R4, R5, R6, R7, R9.
    Relation
    extends lu2017 and lu2017a from single bile salts to mixtures (no synergy between bile salts) and to complete media; independently of indulkar2018 (neither cites the other) finds FaSSIF far weaker than a human bile salt mix, and adds that an effective polymer at the amorphous solubility removes the medium effect among lecithin media while lecithin cancels the bile salt contribution lu2018 C14, C26, C37, C43.
  48. 2018
    mosqueragiraldo2018afive carboxylated cellulose esters and ethers, nine drugs, simulationsD. Crystallization from solutionextends

    Crystallization Inhibition Properties of Cellulose Esters and Ethers for a Group of Chemically Diverse Drugs - Experimental and Computational Insight

    Known before
    carboxylated polymers beat amide, amine and alcohol analogues and a long-spacer twin failed for telaprevir (mosqueragiraldo2016), polymer structure and acid content govern induction times (ilevbare2013c), and AFM of adsorbed HPMCAS conformation (schram2015) (builds_on) mosqueragiraldo2018a C26, R13, C37.
    Added
    induction times of nine drugs with 5 µg/mL of a short- and a long-tether cellulose ester and three ethyl cellulose ethers, AFM of the polymers on amorphous atazanavir, and molecular dynamics of 28-monomer chains alone and next to 25-molecule telaprevir or atazanavir aggregates mosqueragiraldo2018a R1, R2, R4, R7, R9, R12.
    Relation
    extends the long-spacer failure of mosqueragiraldo2016 from telaprevir to nine drugs, finds that a second acid per side chain does not help, and puts the drug into the simulations that in 2016 covered oligomers alone; a carboxylated ether outside the solubility-parameter window beat the 2013 polymers for celecoxib mosqueragiraldo2018a C8, C30, C43, R2.
  49. 2018
    que2018paclitaxel seed crystals and HPMCASB. Supersaturation from ASD dissolutionfirst proposedextends

    Paclitaxel Crystal Seeds with Different Intrinsic Properties and Their Impact on Dissolution of Paclitaxel-HPMCAS Amorphous Solid Dispersions

    Note
    Known in the library (builds_on: Alonzo 2012, Schram 2016, Jackson 2016, Ilevbare 2013 on induction times, Trasi 2017): seeds reduce the amorphous solubility advantage unless growth is inhibited, seeds grown in different environments differ in interface structure and growth rate, polymers inhibit nucleation from solution, and a commercial amorphous tacrolimus product contains crystals que2018 C8, C2, C7.
    Added
    at an equal 18 wt%, seeds of different morphology left ≈7.9–25.3 µg/mL of a 31.6 µg/mL amorphous solubility after 16 h; sonication raised the needle-end area 7–9-fold; HPMCAS held an unseeded solution at S = 88 for more than 16 h but only slowed growth, which the authors trace to a critical two-dimensional nucleus (5.4–7.0 nm) smaller than the spacing of adsorbed polymer (≈10.5–16.8 nm) que2018 R14, R6, R3, R15, R12.
    Relation
    first in the library on seed morphology at equal mass in dispersion dissolution; extends the nucleation-against-growth split of Konno 2008 and Xie 2016 to a seeded dispersion.
    Note
    Findings: F22, F4, F5, F7, F8.
  50. 2018
    sugihara2018pazopanib after a pH shiftC. Amorphous solubility and LLPSconfirmsextends

    Evaluation of Pazopanib Phase Behavior Following pH-induced Supersaturation

    Known before
    pH-induced supersaturation and precipitation of weak bases (2012), the pH-solubility diagram with crystalline and amorphous boundaries and the extinction method (2015 weak-base paper), glass–liquid phase separation with the extinction method and colloid size (2015 telaprevir paper) and the flux maximum at LLPS with colloids replenishing absorbed drug (2016 reservoir paper) (builds_on) sugihara2018 C4, C6.
    Added
    pazopanib HCl (pKa 6.4): crystalline and amorphous solubility between pH 5 and 8.4, a two-stage pH-shift test at 1, 1/10 and 1/100 of the clinical dose with 0–50 µg/mL HPMC, DLS, NTA, polarized microscopy and DSC of the precipitate sugihara2018 R1, R2, R4, R8, R12, R15, R17, R22, R23.
    Relation
    extends the diagram of the weak-base paper to a dose-ranging pH-shift test; sets the highest ratio of the chapter (about 600); confirms the cap at the amorphous solubility for a salt; the Tg of the colloids was measured on dried precipitate sugihara2018 C14, C15, C22, C45, X5.
  51. 2019
    elkhabaz2019aposaconazole dispersions through a gastric stageB. Supersaturation from ASD dissolution

    Characterization of Phase Transformations for Amorphous Solid Dispersions of a Weakly Basic Drug upon Dissolution in Biorelevant Media

    Note
    Known in the library (builds_on: Alonzo 2010, Li 2018, Raina 2015 on fluorescent probes, Wanapun 2010, Kestur 2012): the two crystallization routes during amorphous dissolution and matrix crystallization as a source of seeds, polymers delaying crystallization by acting on nucleation and growth, enteric polymers suspended at gastric pH, and more release from insoluble-polymer dispersions at higher drug loading elkhabaz2019a C2, C3, C29; fluorescence detection of the LLPS onset and SHG detection of crystals in amorphous powders (builds_on, as listed in the evidence index).
    Added
    crystals form in crystal-free HPMCAS dispersions during an hour in fasted gastric fluid although the medium is subsaturated, about 68% of the undissolved drug at 50% drug against 0.03–0.05% at 10–25%; after the pH shift the low loadings held the amorphous solubility with ≈300 nm droplets while the 50% dispersion never reached it; a fifth of the dose lost supersaturation about an hour sooner elkhabaz2019a R20, R6, R13, R12.
    Relation
    carries the matrix route of Alonzo 2010 into the stomach of a weakly basic drug; first in the library on a gastric stage as the source of the seeds that end intestinal supersaturation.
    Note
    Findings: F24, F26, F1, F4, F9, F10, F16, F18, F19.
  52. 2019
    indulkar2019aritonavir–copovidone tablets, congruent release and the limit of congruencyA. Release mechanism and LoCextends

    Insights into the dissolution mechanism of ritonavir-copovidone amorphous solid dispersions: importance of congruent release for enhanced performance

    Note
    Known in the library (builds_on: Alonzo 2011, Ilevbare 2013 on LLPS, Purohit 2015 on phase separation kinetics, Indulkar 2017, Purohit 2017): the ritonavir amorphous solubility (about 30 µg/mL) and wet Tg (about 0 °C) indulkar2019a M1; impaired release without droplets at high loading for some compounds indulkar2019a C13; water-induced AAPS indulkar2019a C14; the Higuchi two-component model and Corrigan's note that it fails for low-loading dispersions indulkar2019a C23, C24.
    Added
    the limit of congruency, defined as the highest loading with congruent release (25%), and release "falling off a cliff" above it indulkar2019a C2, C31, R11; release into ritonavir-saturated medium that separates the regimes indulkar2019a R12; a drug-rich tablet surface by IR within minutes at 50% indulkar2019a R16; films that separate on contact with water above the limit and not below indulkar2019a R18.
    Relation
    names the limit; extends Purohit 2017 from films to tablets and takes the dissolution-then-LLPS route of Indulkar 2017 for the droplets indulkar2019a C49.
    Note
    Findings: F1, F2, F3, F4, F6, F7, F8.
  53. 2019
    indulkar2019bmonomeric and micellar SDS, SDS–polymer pairs and atazanavir nucleationD. Crystallization from solutionextends

    Impact of monomeric vs. micellar surfactant and surfactant-polymer interactions on nucleation-induction times of atazanavir from supersaturated solutions

    Known before
    a surfactant can bind a polymer in solution and cancel its inhibition (ilevbare2012a), and the CMC of SDS in the buffer with the flux-based supersaturation of atazanavir in SDS (chapter C) (builds_on) indulkar2019b C11, M2, C12.
    Added
    atazanavir at each medium's amorphous solubility in 13 SDS levels from 0 to 3.6 mg/mL (about 200 min up to 0.05 mg/mL, about 56 min at 0.3 mg/mL, about 52–68 min above the CMC of 0.5 mg/mL), pyrene in crystal slurries below the CMC, 1 mg/mL PVPVA, HPMC-606 and HPMCAS-MF with 0.1 mg/mL SDS, the aggregation concentration of SDS on each polymer, and a dissolving atazanavir:PVPVA:SDS dispersion indulkar2019b R3, R6, R4, R8, R5.
    Relation
    extends the sub-micellar surfactant effects of ilevbare2012a and chen2015 to a threshold well below the CMC and a plateau above it, and shows that the polymer most bound by SDS (PVPVA) is the one that loses its inhibition indulkar2019b C30, C31, C50.
  54. 2019
    que2019ledipasvir–copovidone, drug loading and drug–polymer interactionsA. Release mechanism and LoCextends

    Insights into the Dissolution Behavior of Ledipasvir-Copovidone Amorphous Solid Dispersions: Role of Drug Loading and Intermolecular Interactions

    Note
    Known in the library (builds_on: Rumondor 2009, Purohit 2015 on phase separation kinetics, Indulkar 2016, Purohit 2017, Indulkar 2019, Saboo 2019): the LoC concept and its variability in PVPVA (ritonavir 25%, cited limits for other drugs) que2019 C6, R27; colloids form only under polymer control que2019 C4; colloids as a reservoir que2019 C3; AAPS on contact with water que2019 C34; phase segregation at the dissolution front of polyphase mixtures forming a barrier layer que2019 C5.
    Added
    a limit of 5–7.5% for a high-Tg drug que2019 C10; surface drug enrichment by XPS within 10 min que2019 R15; drug–drug hydrogen bonds broken by PVPVA up to about 7–10% loading, near the limit que2019 R25, C45; SDS raising the limit to 30% and poloxamer 407 to 7.5%, with smaller colloids que2019 C12, R12.
    Relation
    extends the limit to a drug with a low value; first in the library to raise it with a surfactant que2019 C56.
    Note
    Findings: F3, F4, F6, F7, F8, F9, F10, F13.
  55. 2019
    saboo2019congruent release as a "sweet spot", nilvadipine and cilnidipine in PVPVAA. Release mechanism and LoCconfirmsrevises

    Congruent release of drug and polymer: A “sweet spot” in the dissolution of amorphous solid dispersions

    Note
    Known in the library (builds_on: Ilevbare 2013 on LLPS, Mosquera-Giraldo 2015, Raina 2015 on dihydropyridines, Saboo 2017, Bhardwaj 2018, Indulkar 2019): polymer-controlled release at low and drug-controlled release at high loading, a picture "likely" oversimplified, with the switch loading poorly understood saboo2019 C4; high RH known to induce phase separation in some dispersions saboo2019 C15; the surface-normalized method and the ritonavir and itraconazole drop-offs (builds_on).
    Added
    the cliff for two drugs 2.5 log units apart at about the same molar loading, refuting the log P hypothesis saboo2019 R7, C35; nanodroplets only from congruent dispersions ("a clear link") saboo2019 C30; a porous, drug-rich surface above the switch saboo2019 R13, R18; humidity turning a congruent compact incongruent saboo2019 C41; the same cliff in powder dissolution saboo2019 R20, R21.
    Relation
    confirms the ritonavir cliff for two more drugs; revises the expectation that the more lipophilic drug switches earlier saboo2019 C6, C35.
    Note
    Findings: F1, F2, F3, F4, F6, F7, F8, F9, F12.
  56. 2020
    enright2020phospholipid digests, cholesterol and volunteer bile acid pools with atazanavirD. Crystallization from solutionconfirmsextendsrevises

    Impact of phospholipid digests and bile acid pool variations on the crystallization of atazanavir from supersaturated solutions

    Known before
    PC shortens the atazanavir induction time and Composite-SIF holds supersaturation longer than FaSSIF (indulkar2018), and bile salts differ as inhibitors with a concentration dependence of taurocholate (li2016a) (builds_on) enright2020 C5, C4.
    Added
    atazanavir at each medium's amorphous solubility in buffer (253 ± 65 min), FaSSIF (about 48), Composite-SIF (about 81) and FaSSIF-V3 (23 ± 6 min); PC against lyso-PC and oleate in 2.8 mM glycocholate/taurocholate; cholesterol; one digest lipid fraction with four bile salt fractions; media built from six volunteers' duodenal bile acid pools (23–33 against 112–144 min); and 1 mg/mL HPMC in the two extreme volunteer media (more than 360 min) enright2020 R2, R10, R14, R18, R28.
    Relation
    confirms indulkar2018 (FaSSIF shorter than Composite-SIF; phospholipid accelerates) and extends it to the digestion products of PC, which accelerate more; revises indulkar2018 on bile salt alone, since glycocholate/taurocholate without lipid did not lengthen the induction time over buffer (272 against 253 min) whereas 3 mM STC alone had given about 595 against 170 min at a lower supersaturation enright2020 R6, R2, C24, X10; indulkar2018 X5.
  57. 2020
    saboo2020indomethacin and its methyl ester in PVPVA: hydrogen bonding, surface crystallization and glass transitionA. Release mechanism and LoCfirst proposedrevises

    Congruent release of drug and polymer from amorphous solid dispersions: insights into the role of drug-polymer hydrogen bonding, surface crystallization and glass transition

    Note
    Known in the library (builds_on: Taylor and Zografi 1997 on indomethacin–PVP hydrogen bonding, Rumondor 2009 and 2011, Purohit 2017, Indulkar 2019, Saboo 2019): polymer-controlled, congruent release at low loading with an abrupt decrease at a loading that varies between drug–polymer pairs saboo2020 C2; the same limit for two PVPVA dispersions of very different log P saboo2020 C4; drug–polymer hydrogen bonding considered advantageous to physical stability, with its role in release poorly understood saboo2020 C5.
    Added
    a limit of 10% for indomethacin against at least 25% for its methyl ester over 5 min, so that the hypothesis that hydrogen bonding raises the limit "appears to be incorrect" saboo2020 C14, C48; the surface of the 25% indomethacin compact followed by EDX, nanoTA and FTIR to about 60–72 wt% drug at 20 min saboo2020 R21, R28, R17, X15; congruent release of the ester stopped after 7.5–20 min by crystals on the surface saboo2020 R8, R22, C17; the indomethacin limit at 10% from 25 to 57 °C, 5% at 17 °C and below 5% at 10 °C, against a wet Tg onset of 18 °C for a 70% dispersion saboo2020 R29, R30.
    Relation
    first in the library to set a matched analogue without a donor, and the test temperature, against the limit; revises the hypothesis taken from Rumondor 2009 and 2011 that hydrogen bonding favours release saboo2020 C7, C48.
    Note
    Findings: F1, F2, F3, F4, F6, F7, F8, F10, F15, F17, F18, F19.
  58. 2020
    saboo2020arelease against drug loading for five polymers, felodipineA. Release mechanism and LoCextends

    Patterns of drug release as a function of drug loading from amorphous solid dispersions: A comparison of five different polymers.

    Note
    Known in the library (builds_on: Konno 2006, Purohit 2015 on phase separation kinetics, Purohit 2017, Saboo 2017, Bhardwaj 2018, Indulkar 2019, Que 2019, Saboo 2019): congruent release seen only at low loading, mostly with PVPVA, and a limit thought to depend on drug properties and interactions saboo2020a C4; no correlation between polymer properties and the limit established saboo2020a C5; water-induced AAPS turning congruent into incongruent release saboo2020a C40; no log P effect at low loading saboo2020a C33.
    Added
    limits of 10, 15 and 10% with PVP, PVPVA and HPMC and none to 50% with HPMCAS and Eudragit S 100 saboo2020a R15; polymer hydrophobicity by water sorption and contact angle saboo2020a R3, R4; the trade-off between fast release at low loading and workable release at higher loading saboo2020a C55; release falling with log P at 40% in HPMCAS saboo2020a R16, C19; no positive correlation between drug–polymer hydrogen bonding and the limit saboo2020a C48; the Higuchi critical ratio far below practical loadings saboo2020a R27.
    Relation
    extends the limit from a drug property to a polymer property; generalizes Purohit 2017's HPMCAS contrast to five polymers saboo2020a C49.
    Note
    Findings: F1, F2, F3, F6, F7, F8, F9, F10, F11.
  59. 2020
    ueda2020bthree polymers and ibuprofen, by NMRC. Amorphous solubility and LLPSconfirms

    Polymer type impacts amorphous solubility and drug-rich phase colloidal stability: A mechanistic study using nuclear magnetic resonance spectroscopy

    Known before
    the LLPS concept and the extinction method (2013), polymers stabilize the size of drug-rich droplets and adsorb at the amorphous surface (2013 ritonavir nanodroplet study), solubilization raises the amorphous solubility without raising transport (2017 SDS paper) and polymer mixing with the drug-rich phase lowers the amorphous solubility and membrane transport (2018 telaprevir ASD paper) (builds_on) ueda2020b C3, C4, C5.
    Added
    HPMC, PVP-VA and EUD-E at 300 µg/mL with ibuprofen: crystalline and amorphous solubility, NMR of both phases and of the dissolved polymer, fresh droplet size and zeta potential, and 3 h of stirring ueda2020b R1, R5, R6, R7, R13, R15.
    Relation
    confirms, with NMR evidence of where each polymer sits, the polymer-mixing mechanism proposed for telaprevir; first paper of the chapter to read polymer partitioning and droplet stability together ueda2020b C32, C33, C52.
  60. 2021
    elkhabaz2021crystallization kinetics in simulated and aspirated human intestinal fluidD. Crystallization from solutionfirst proposedconfirms

    Crystallization Kinetics in Fasted-State Simulated and Aspirated Human Intestinal Fluids

    Known before
    bile salts delay nucleation and differ with structure, slow growth and leave residual supersaturation (chen2015, li2016a, lu2017, lu2017a), lecithin promotes crystallization and atazanavir is a slow nucleator (indulkar2018), two proposed lecithin mechanisms (enright2020), SHG rates of nucleation and growth, and the amorphous solubilities and activity-based supersaturation of the two drugs in the six media (Bioperformance) (builds_on) elkhabaz2021 C4, C24, C25, R4.
    Added
    induction times of atazanavir and posaconazole at their amorphous solubility in two blank buffers, FaSSIF-V1, FaSSIF-V2, a six-bile-salt composite FaSSIF and pooled aspirated fasted human fluid, without and with HPMC-AS; SHG nucleation and growth rates; desupersaturation rates; needle and plate habit; the atazanavir precipitate form elkhabaz2021 R6, R7, R8, R14, R15, R21, R20.
    Relation
    first in the library to measure crystallization in aspirated human intestinal fluid; confirms indulkar2018 for atazanavir (composite medium slower than FaSSIF, more lecithin faster) but finds the six-bile-salt medium short of human fluid for posaconazole, and HPMC-AS helping most in blank buffer elkhabaz2021 C24, C27, C28, C32.
  61. 2021
    que2021four phenolphthalein analogues in PVPVA: hydrogen bonding, halogen bonding and the limitA. Release mechanism and LoCextends

    Impact of Drug−Polymer Intermolecular Interactions on Dissolution Performance of Copovidone-Based Amorphous Solid Dispersions

    Note
    Known in the library (builds_on: Indulkar 2019, Saboo 2019, Que 2019, Que 2020 on halogen bonding, Saboo 2020 on five polymers, Saboo 2020 on indomethacin, Crowley and Zografi 2002): phenolic OH groups can hydrogen-bond to the PVPVA carbonyl and iodine atoms can potentially halogen-bond to the same acceptor que2021 C2; halogen bonding to the VP carbonyl and the Me-TIPP data (Que 2020, builds_on); a lower limit for indomethacin than for its ester (Saboo 2020, builds_on).
    Added
    limits of 5% (PHPH) and 10% (TIPP) for the two phenols against 30% (Me-TIPP) and 40% (Me-PHPH) for their methyl ethers, 0.012–0.115 mol per 100 g que2021 R19, R20; VP carbonyl shifts of up to 30 cm⁻¹ for the phenols, 7 cm⁻¹ for Me-TIPP and minimal for Me-PHPH que2021 R7; the share of halogen-bonded iodine by XPS falling with loading que2021 R11, R12; drug and PVPVA leaving at the neat-polymer rate at every limit que2021 R21, C39; no obvious correlation of log P, amorphous solubility, Tg or molecular weight with the limit que2021 C29.
    Relation
    extends the indomethacin–ester comparison of Saboo 2020 to two analogue pairs and adds halogen bonding; proposes, without measuring it, that bonds persisting in water slow polymer hydration que2021 C44.
    Note
    Findings: F1, F2, F3, F4, F6, F9, F10, F15, F16, F17, F18.
  62. 2021
    saboo2021TPGS in felodipine–PVPVA dispersions at higher loadingA. Release mechanism and LoCextends

    Exploring the Role of Surfactants in Enhancing Drug Release from Amorphous Solid Dispersions at Higher Drug Loadings

    Note
    Known in the library (builds_on: Saboo 2019, Indulkar 2019, Li 2019, Que 2019, Saboo 2020 on five polymers, Saboo 2020 on indomethacin, Han 2019): surfactants raised the limit of ledipasvir–PVPVA but the mechanism "remains elusive" saboo2021 C6; hydrophobic polymers give higher limits but slower release saboo2021 C3; a drug-rich surface layer formed during hydration slows release saboo2021 C28; the transient gel layer model (Saboo 2020 on indomethacin, builds_on).
    Added
    limits of 25, 35 and 45% with 2, 5 and 10% TPGS against 15% without saboo2021 R12; the gain with TPGS below its CMC, so that micelles play "a negligible role", and no gain with TPGS dissolved in the medium saboo2021 R1, C33, R15; semi-continuous drug-rich domains at 0 and 2% TPGS against discrete domains at 5 and 10% in humidified films, and a porous surface layer only on the 0 and 2% tablets saboo2021 R21, R23, R19; TPGS lowering the dispersion Tg from 89.2 to 71.1 °C saboo2021 R5.
    Relation
    extends the surfactant result of Que 2019 to a second drug and a graded level; first in the library to tie release to the shape of the drug-rich phase ("appeared to be linked") saboo2021 C53.
    Note
    Findings: F1, F2, F4, F5, F6, F7, F8, F13, F15, F16, F20, F21.
  63. 2021
    ueda2021six polymers, quantitative NMRC. Amorphous solubility and LLPSextends

    Effect of Polymer Species on Maximum Aqueous Phase Supersaturation Revealed by Quantitative Nuclear Magnetic Resonance Spectroscopy

    Known before
    Eq. 1 and its ibuprofen inputs (2015 six-drug paper), a second component lowers the amorphous solubility, eq 2 (2015 second-drug study), the ASD polymer lowers the amorphous solubility (2018), polymer grade lowers the maximum supersaturation (2020 HPMCAS grades) and NMR of dissolved and phase-separated drug with polymer mixing (2020 NMR paper) (builds_on) ueda2021 C2, C4.
    Added
    PVP K12, K25, K90, PVP-VA and HPMC 603 and 615 at 25–1000 µg/mL with 50–600 µg/mL ibuprofen: dissolved drug and polymer weight ratio in the drug-rich phase, Flory–Huggins calculation and DVS of ASDs ueda2021 R5, R8, R10, R11, R12, R13, R17.
    Relation
    extends the 2020 result to molecular weight, chemistry and amount; shows a ceiling for PVP K25 and PVP-VA and none for HPMC 603; ideal mixing over-predicts the solubility and an interaction term improves it ueda2021 C13, C24, C33, C39.
  64. 2021
    wilson2021polymers and enzalutamide nanodropletsD. Crystallization from solutionextends

    Interaction of Polymers with Enzalutamide Nanodroplets—Impact on Droplet Properties and Induction Times

    Known before
    effective inhibitors distribute between the water and the drug-rich precipitate (raina2015b), the induction-time method and globular polymers as poorer inhibitors (mosqueragiraldo2016), the polymer–drug simulation protocol with extended against globular chains (mosqueragiraldo2018a), NMR depletion of polymer and drug (Bioperformance), and HPMCAS as an inhibitor for enzalutamide (builds_on) wilson2021 C4, C54, P10, P6, C6.
    Added
    enzalutamide at 30–120 µg/mL across a stated amorphous solubility of 42 µg/mL with HPMCAS, the cellulose ester P177 and Eudragit E PO at 2.5–100 µg/mL, NMR of polymer and drug left in solution, colorimetry of pellets, TEM with EDX, DLS and zeta potential, a dansyl-labelled HPMCAS, and 15 ns simulations of one chain beside a 10-molecule drug cluster wilson2021 R3, R7, R8, R9, R11, R13, R14, R17, R21.
    Relation
    tests the two-phase criterion of raina2015b: both polymers enter the droplets and lower the dissolved drug alike, but the one with the larger share in the droplets (Eudragit E PO) inhibits worst, so distribution alone does not rank inhibitors; extends the extended-chain reading of mosqueragiraldo2018a to a droplet interface wilson2021 C37, C38, C58.
  65. 2021
    yang2021six drugs of different Tg and log P in PVPVA and HPMCASA. Release mechanism and LoCextends

    Drug Release and Nanodroplet Formation from Amorphous Solid Dispersions: Insight into the Roles of Drug Physicochemical Properties and Polymer Selection

    Note
    Known in the library (builds_on: Indulkar 2019, Saboo 2019, Saboo 2020 on indomethacin, Que 2019, Jackson 2015, Mosquera-Giraldo 2018, Ilevbare 2013 on LLPS, Saboo 2017): high log P drugs were expected to undergo phase separation in the wet matrix more readily and impair release yang2021 C6, and high-Tg drugs to be detrimental to release and nanodroplet formation yang2021 C7.
    Added
    PVPVA powders failing at 25 and 40% for low-Tg loratadine and miconazole and at 5–10% for danazol, elbasvir, paclitaxel and ivacaftor, with no log P trend yang2021 R7, R8, R9, R10, R11, R12, C19; a cliff within a 10% loading span in every PVPVA system against a gradual decline with HPMCAS yang2021 C2; the loratadine limit falling from 30 to 2% (PVPVA) and 20 to 5% (HPMCAS) on cooling from 37 to 5 °C, below its wet Tg of 13.8 °C yang2021 R22, M1; HPMCAS keeping elbasvir and loratadine droplets smaller yang2021 R3, R6.
    Relation
    extends the temperature test of Saboo 2020 to a second drug and two polymers; Tg and hydrogen-bond donors went together across the drugs and were not separated yang2021 C25, C38.
    Note
    Findings: F1, F2, F3, F4, F6, F8, F9, F11, F15, F16, F17, F18, F19.
  66. 2022
    correasoto2022asurfactants in clopidogrel–copovidone dispersions: drug loading and nanodroplet stabilityA. Release mechanism and LoCextends

    Impact of Surfactants on the Performance of Clopidogrel-Copovidone Amorphous Solid Dispersions: Increased Drug Loading and Stabilization of Nanodroplets

    Note
    Known in the library (builds_on: Indulkar 2019, Que 2019, Saboo 2021, Saboo 2019, Saboo 2020 on indomethacin, Yang 2021, Indulkar 2017 on SDS, Indulkar 2016, Ueda 2020): drug-rich nanodroplets benefit bioavailability as a reservoir correasoto2022a C1; a supersaturated solution with a drug-rich phase is metastable and its droplets coarsen correasoto2022a C2; reported limits in PVPVA range from below 5 to about 30% correasoto2022a C45.
    Added
    a limit of about 40% for a low-Tg drug without hydrogen-bond donors, and 50% with SDS correasoto2022a C46, C47, C55; PVPVA dissolving about twice as fast from the binary dispersions as from the neat compact correasoto2022a R18, C30; SDS, TPGS or Tween 80 keeping the droplets at constant size for 4 h and CTAB agglomerating them correasoto2022a R6, C12; TPGS taken up into the droplets at about 50:17 w/w drug:TPGS correasoto2022a R12; uniform, bicontinuous and drug-continuous films at 40, 50 and 60% correasoto2022a R20.
    Relation
    raises the limit of a third drug with SDS, as Que 2019 did for ledipasvir, and extends the morphology link of Saboo 2021 to a binary dispersion correasoto2022a C55, C32.
    Note
    Findings: F1, F2, F3, F4, F6, F8, F13, F15, F16, F17, F18, F19, F20, F21.
  67. 2022
    correasoto2022bsurfactants and vinylpyrrolidone in atazanavir–PVPVA dispersionsA. Release mechanism and LoC

    Role of surfactants in improving release from higher drug loading amorphous solid dispersions

    Note
    Known in the library (builds_on: Indulkar 2019, Que 2019, Saboo 2020 on indomethacin, Yang 2021, Saboo 2021, Indulkar 2015, Indulkar 2017 on SDS, Ueda 2021, Devotta 1995, Cooper 1986): the drug Tg plays a role in the limit and high-Tg drugs release poorly unless the loading is very low correasoto2022b C3; surfactants can raise release at higher loading, with selection mostly empirical correasoto2022b C4; the dry and wet Tg of atazanavir, 105 and 55 °C correasoto2022b M1.
    Added
    a limit of 5% for the binary dispersion, 10% with SDS or CTAB and 15% with Span 80 correasoto2022b R1, C12; every additive raising release at 10% by 4- to 35-fold, vinylpyrrolidone as well as the best surfactants correasoto2022b R20; release of the 10% binary dispersion restored at 55 °C until the drug crystallized correasoto2022b R5; additives lowering the dispersion Tg by 7–16 °C and making wet films separate within 10 min correasoto2022b R20, R10, R11.
    Relation
    tests plasticization as the cause of the surfactant effect with a plasticizer that is not a surfactant correasoto2022b C9, C40; a high-Tg drug where the clopidogrel paper of the same year studied a low-Tg one (synthesis).
    Note
    Findings: F1, F2, F3, F4, F6, F8, F13, F15, F18, F19, F20, F21.
  68. 2022
    duong2022adelamanid salts formed inside the dispersionB. Supersaturation from ASD dissolutionfirst proposed

    Combining enabling formulation strategies to generate supersaturated solutions of delamanid: In situ salt formation during amorphous solid dispersion fabrication for more robust release profiles

    Note
    Known in the library (builds_on: Towler 2008, Ueda 2020, Hate 2020, Moseson 2020): the counterion changes the crystallization tendency of amorphous salts, polymers stabilize drug-rich droplets, and residual crystals in dispersions can seed growth during release duong2022a C5, C11, C55.
    Added
    a fast crystallizer that cannot be vitrified at 50 °C/min left crystals in rotary-evaporated dispersions from 15–20% drug, and release collapsed once crystallinity was detectable; seven of eight sulfonate salts were amorphous with Tg 83.7–117.8 °C, and salts formed in the same step as the dispersion released ≈95–97 µg/mL of 100 at 25% drug against ≈20 for the free base; a polymer screen chose HPMCP and HPMCAS by induction time and droplet size duong2022a R8, R14, R20, R26, R4, R5.
    Relation
    first in the library on in situ salt formation in a polymer dispersion; adds a fast-crystallizing weak base to the residual-crystal problem of Que 2018.
    Note
    Findings: F23, F4, F9, F10, F12, F25, F28.
  69. 2022
    duong2022bposaconazole phase diagram, supersaturation and mediaD. Crystallization from solutionconfirmscontradicts

    Phase Behavior and Crystallization Kinetics of a Poorly Water-Soluble Weakly Basic Drug as a Function of Supersaturation and Media Composition

    Known before
    pH-shift supersaturation and precipitation of weak bases (hsieh2012), LLPS above the amorphous solubility and the flux cap there, pH-dependent LLPS of weak bases, the concentration dependence of the micelle–water partition coefficient, unchanged free posaconazole in FaSSIF (chapters C and Bioperformance), nucleation acceleration by oleate and lipid digests (enright2020), and the proposal that surfactants lower the interfacial energy (elkhabaz2021), here tested (builds_on) duong2022b C2, C3, C8, C9, C33, C51.
    Added
    crystalline and amorphous solubility of posaconazole at 13 pH values from 1.0 to 7.0 and in five biorelevant media against same-pH buffers, induction times from S 5 to 33.6 in PBS pH 6.5 and in four intestinal media, seeding with nanocrystals from a marketed suspension, and nucleation-theory fits giving the interfacial energy, the pre-exponential factor, the barrier and the critical radius duong2022b R1, R8, R10, R11, R13, R16, R17.
    Relation
    confirms for a weak base the constant amorphous-to-crystalline ratio across pH (about 34 from pH 2 to 7) and the lower concentration ratio in micellar media; contradicts the interfacial-energy reading of indulkar2018, indulkar2019b and elkhabaz2021 by placing the medium effect in the pre-exponential factor, an assignment its own data do not make secure duong2022b C19, C51, C53, X12.
  70. 2022
    hiew2022bamorphous salts of lumefantrine in PVPVA: Tg, release and stabilityA. Release mechanism and LoCfirst proposed

    Combining drug salt formation with amorphous solid dispersions – a double edged sword

    Note
    Known in the library (builds_on: Hiew 2022 on lumefantrine polymers, Towler 2008, Tong 1999 and 2002, Saboo 2020 on indomethacin, Yang 2021, Que 2019, Indulkar 2019, Narasimhan and Peppas 1996 and 1997): salt formation as a way to raise Tg and reduce recrystallization hiew2022b C6; impaired release from systems with a high Tg against the dissolution temperature hiew2022b C7; congruent release from fast-releasing PVPVA dispersions hiew2022b C25.
    Added
    salts raising the onset Tg from 19.7 °C to as much as about 101 °C hiew2022b R2; the highest loading with good release falling from 35% (free base) to 2% (sulfate) as the salt Tg rose hiew2022b R20; higher-Tg forms crystallizing later in storage hiew2022b R7, R8; the critical polymer volume fraction of PVPVA, 0.89 at 37 °C hiew2022b R21.
    Relation
    first in the subcategory to vary the Tg of one drug by salt formation and to show the stability–release trade-off hiew2022b C55, C53.
    Note
    Findings: F1, F2, F3, F6, F7, F8, F9, F15, F17, F18, F20, F22.
  71. 2022
    indulkar2022surfactants in ritonavir–copovidone dispersions above the limitA. Release mechanism and LoCextends

    Role of Surfactants on Release Performance of Amorphous Solid Dispersions of Ritonavir and Copovidone

    Note
    Known in the library (builds_on: Indulkar 2016, Purohit 2017, Indulkar 2019): the ritonavir–PVPVA limit of about 25%, with polymer-controlled, congruent release below it indulkar2022 R2; water-induced separation impeding release and nanodroplet formation in ritonavir dispersions (Purohit 2017, builds_on); the 30% binary dispersion with a lag, a period of congruent release and then incongruent, incomplete drug release indulkar2022 C30, R1; strategies that raise the limit called "essential" indulkar2022 C5.
    Added
    five surfactants at 5 parts per 100 parts of 30:70 ritonavir–PVPVA, every one removing the lag and giving congruent release for at least 20 min indulkar2022 C31; near-complete release with Span 85 and TPGS, release stopped near 80% by surface crystals with SDS, and about 41 and 25% with Span 20 and Tween 80 indulkar2022 R8, R9, R5, R15, R7, R6; early PVPVA release about doubled by SDS indulkar2022 C32, R20; a lowered Tg of surface material after dissolution with Tween 80 and Span 20, read as phase separation indulkar2022 R19, C19; released droplets from about 1 µm with the Spans to about 10 µm with Tween 80 indulkar2022 R11, R13.
    Relation
    extends the surfactant results of Que 2019, Saboo 2021 and the 2022 clopidogrel and atazanavir papers to a drug above its limit (synthesis); first in the subcategory to show a surfactant bringing surface crystallization to a drug that did not crystallize on the binary tablet indulkar2022 C38.
    Note
    Findings: F1, F8, F13, F15, F16, F19, F20, F21.
  72. 2022
    qi2022polymer salts of the enteric polymer HP-50 and their miconazole dispersionsA. Release mechanism and LoCfirst proposed

    Improved dissolution of an enteric polymer and its amorphous solid dispersions by polymer salt formation

    Note
    Known in the library (builds_on: Indulkar 2019, Saboo 2020 on five polymers, Yang 2021, Hiew 2022 on lumefantrine polymers): release worsening as the loading of a lipophilic drug rises; drug-dependent changes in enteric polymer dissolution; the miconazole pKa and amorphous solubility (builds_on); a critical ionization of about 83% for HP-50 qi2022 R19; the dependence of enteric polymer dissolution on buffer capacity, "well known" from coating work (cited) qi2022 C20.
    Added
    HP-50 dissolution set by the buffer species, fastest in BIS-TRIS and slowest in TEA, not by cation size qi2022 R1, R2, C14; nine salts dissolving about 3-fold faster than HP-50 whatever the counterion qi2022 R10, C3; HP-50-Na keeping its rate at 3 mM/ΔpH where HP-50 slowed 6-fold qi2022 R12, C4; dissolution rising with neutralization, the largest step from 80 to 100% qi2022 R13; 20% miconazole on HP-50-Na and its triethylamine salt releasing about 84–90% in 60 min against about 9% on HP-50 qi2022 R14.
    Relation
    first in the library to pre-ionize an enteric dispersion polymer as a salt qi2022 C44; adds an ionizing polymer whose own dissolution, not the drug, limits release to the hydrophobic-polymer contrast of Saboo 2020 (synthesis).
    Note
    Findings: F3, F15, F23, F24.
  73. 2022
    ueda2022temperature dependence of polymer partitioningC. Amorphous solubility and LLPSextends

    Variable-Temperature NMR Analysis of the Thermodynamics of Polymer Partitioning between Aqueous and Drug-Rich Phases and Its Significance for Amorphous Formulations

    Known before
    Eq. 1 inputs and the ideal-mixing reduction (2015), NMR detection of the drug-rich phase and the polymer-lowered amorphous solubility (2020), and the same drug, polymers and quantitative NMR with the polymer distribution at 37 °C (2021) (builds_on) ueda2022 C3, C4.
    Added
    15–60 °C: polymer weight ratio in the drug-rich phase, amorphous solubility, partition coefficient and ΔG, ΔH, ΔS by a van't Hoff analysis, solid-state NMR of dry ASDs and DSC ueda2022 R9, R10, R17, R22, R23, R13.
    Relation
    extends the 2021 result in temperature; shows an endothermic, entropy-driven transfer and a reversal of the polymer ranking; adds the third temperature profile of the chapter ueda2022 C48, C59, R9.
  74. 2022
    yang2022arelease mechanisms of ritonavir–copovidone: phase separation and its morphologyA. Release mechanism and LoCfirst proposed

    Release mechanisms of amorphous solid dispersions: Role of drug-polymer phase separation and morphology

    Note
    Known in the library (builds_on: Indulkar 2017, Purohit 2017, Indulkar 2019, Li 2019, Yang 2022 on surfactant-containing dispersions): solution-mediated nanodroplet formation (Indulkar 2017); fluorescent dyes for the phase behaviour of hydrating ritonavir dispersions (Purohit 2017); the limit of 25% yang2022a R15; the falling-off-the-cliff effect of PVPVA dispersions yang2022a C7; conflicting evidence on whether preformed discrete drug-rich domains help release (Li 2019, builds_on).
    Added
    drug release of about 100, 35 and at most 3% at 20, 30 and 40–50% yang2022a R2; cross-sections with a gel layer at every loading and a drug-rich crust from 30% yang2022a R5, R6, R7; the gel–glass front slowed above the limit yang2022a R8; real-time imaging of droplets of 0.5–2 µm leaving with the polymer at 10–20% and a continuous drug-rich layer at 30–40% yang2022a R10, R11, R12, R13; XPS surface ritonavir rising from 35 to 72% at 40% yang2022a R14.
    Relation
    first in the library to image the separation in dissolving compacts, in cross-section and in real time yang2022a C5; reconciles the solution route of Indulkar 2017 with water-induced separation at the gel–solution interface yang2022a C50, C51; carries the morphology link of Saboo 2021 and the 2022 clopidogrel paper from humidified films to dissolving compacts (synthesis).
    Note
    Findings: F1, F3, F5, F6, F7, F8, F18, F20, F25.
  75. 2023
    bapat2023media choice for HPMCAS dispersions: buffer capacity, gel pH and releaseA. Release mechanism and LoCconfirmsextends

    Does Media Choice Matter When Evaluating the Performance of Hydroxypropyl Methylcellulose Acetate Succinate-Based Amorphous Solid Dispersions?

    Note
    Known in the library (builds_on: Saboo 2020 on indomethacin, Hiew 2022 on lumefantrine polymers, Yang 2022 on release mechanisms, Nguyen 2023 on delamanid): polymer-controlled release in copovidone dispersions (Saboo 2020, Yang 2022); drug release linked to HPMCAS dissolution and the HPMCAS-MF pKa of 4.92 or 5.0 bapat2023 M3; HPMCAS solubility rising between pH 5.0 and 6.5 (Nguyen 2023, builds_on).
    Added
    the neat HPMCAS-MF rate rising about sixfold from 3 to 51 mM/ΔpH in pH 6.8 phosphate bapat2023 R5; FaSSIF equal to its blank buffer and no dissolution in FeSSIF V1 at pH 5.0 bapat2023 R7, R8; a gel layer only from 13 mM/ΔpH, 3 to 19 µm thick, with an apparent pH of 5.6–6.2 bapat2023 R14, R15; drug at the polymer's rate for 10% indomethacin and its methyl ester bapat2023 R9, R13; rate linear in the square root of rotation speed without a plateau bapat2023 R18, R19; the drugs lowering polymer release and water uptake bapat2023 R20, C46.
    Relation
    extends the buffer-capacity result of Qi 2022 from HP-50 to HPMCAS and adds the gel pH bapat2023 C51; confirms polymer-controlled release for HPMCAS dispersions of acidic and neutral drugs bapat2023 C49.
    Note
    Findings: F1, F2, F11, F15, F23, F24.
  76. 2023
    correasoto2023plasticizers in PVPVA dispersions of high-Tg drugsA. Release mechanism and LoCextends

    Release Enhancement by Plasticizer Inclusion for Amorphous Solid Dispersions Containing High Tg Drugs

    Note
    Known in the library (builds_on: Indulkar 2019, Que 2019, Saboo 2020 on indomethacin, Correa Soto 2022 on atazanavir): binary limits of 25% (ritonavir), 5% (ledipasvir) and 5% (atazanavir), cited correasoto2023 R14, R11, R1; the link between drug Tg and the limit (Saboo 2020, builds_on); surfactants raising the limit possibly by plasticization (Correa Soto 2022, builds_on).
    Added
    the atazanavir limit raised from 5 to 7.5–25% by 5 g per 100 g of nine plasticizers correasoto2023 R1, C12; ledipasvir from 5 to 15–20% with 10 g correasoto2023 R11, C17; ritonavir from 25 to 30% correasoto2023 R14; the Tg of 8:1 drug–plasticizer glasses lowered by 30–53 °C correasoto2023 R17, R18; neat PVPVA dissolving faster with GTB or TBC correasoto2023 R13; little change in water vapour uptake correasoto2023 C34.
    Relation
    extends the vinylpyrrolidone test of Correa Soto 2022 to plasticizers that are not surfactants and to two more drugs correasoto2023 C28; the gain was largest for the highest-Tg drugs correasoto2023 C21.
    Note
    Findings: F15, F16, F18, F21, F26.
  77. 2023
    deac2023athe dissolution interface of two phenolphthalein analogues in PVPVAA. Release mechanism and LoCextends

    Dissolution Mechanisms of Amorphous Solid Dispersions: A Close Look at the Dissolution Interface

    Note
    Known in the library (builds_on: Saboo 2017, Indulkar 2019, Que 2021, Deac 2023 on drug load): the prodan and rhodamine 6G dye pair for confocal imaging (Saboo 2017, builds_on); congruent release, the limit and the surface barrier; limits of 40% for MePHPH and 5% for PHPH deac2023a R14; the polymer-rich PHPH drug-rich phase and associative against segregative separation (Deac 2023 on drug load, builds_on).
    Added
    drug release at 30 min of about 96, 61, 15 and 0% for 20–70% MePHPH and 75 and 0% for 5 and 20% PHPH deac2023a R1, R2; drug piling up in the gel at 40 and 50% MePHPH deac2023a R3; gel thickness, water content and residence time deac2023a R4; in situ imaging of droplets within the gel up to 30% MePHPH, networks at 40% and inversion at 50%, and of PHPH particles beyond the gel at 5% and a network at 10–20% deac2023a R6, R7, R8; released drug-rich phases of 98.8 and 26.2 wt% drug deac2023a R12; porous drug-rich surfaces above the limit deac2023a R9, R10.
    Relation
    extends the real-time imaging of Yang 2022 to two analogues of different limit and adds gel-layer measurements deac2023a C71; ties the polymer-rich PHPH phase to the lower loading at which the drug-rich phase connects deac2023a C65.
    Note
    Findings: F1, F5, F6, F7, F8, F15, F17, F18, F19, F20, F25, F27.
  78. 2023
    deac2023bdrug load and molecular interactions: polymer in the drug-rich phaseA. Release mechanism and LoCfirst proposed

    Dissolution Mechanisms of Amorphous Solid Dispersions: Role of Drug Load and Molecular Interactions

    Note
    Known in the library (builds_on: Indulkar 2019, Que 2019, Saboo 2020 on indomethacin, Que 2021, Ueda 2022): congruent release and the limit; the drug-rich surface layer of a PVPVA dispersion (Que 2019, builds_on); hydrogen bonding lowering the limit (Saboo 2020, builds_on); limits, interaction types and amorphous solubility with PVPVA of the four analogues deac2023b R8; entropy-driven polymer partitioning into drug-rich phases deac2023b C45.
    Added
    PVPVA lowering the amorphous solubility of PHPH from 200 to 27.5 µg/mL and raising that of MePHPH from 2.81 to 4.40 deac2023b R1; about 77, 36.5, 9 and 5 wt% PVPVA in the nanoparticles of PHPH, TIPP, MeTIPP and MePHPH, the reverse order of their limits deac2023b R3, R8; PVPVA moving into rather than out of PHPH particles above about 28% deac2023b R4, R5; compact surfaces drifting toward the drug-rich phase above the limit and constant below it deac2023b R6, R7; schematic ternary diagrams with plait points and the lever rule deac2023b C34, C48, C63.
    Relation
    first in the subcategory to measure where the polymer goes when the analogues separate deac2023b C26; proposes, on schematic diagrams, that associative separation lowers the limit deac2023b C63, X14; the interface paper of the same year builds on it.
    Note
    Findings: F7, F10, F17, F18, F27.
  79. 2023
    hiew2023hierarchical co-precipitated particles of grazoprevir–HPMCASA. Release mechanism and LoCfirst proposed

    Improving Dissolution Performance and Drug Loading of Amorphous Dispersions Through a Hierarchical Particle Approach

    Note
    Known in the library (builds_on: Bhardwaj 2018, Indulkar 2019, Saboo 2019, Li 2020, Yang 2021, Hiew 2022 on lumefantrine polymers): surface drug enrichment impairing release (Bhardwaj 2018, Li 2020) hiew2023 C44; polymer- against drug-controlled release, the limit and the drug-rich surface barrier hiew2023 C35; a sloped decline of release with loading in enteric-polymer dispersions (Hiew 2022, builds_on) hiew2023 C36.
    Added
    solvent-evaporated dispersions falling from about 102% released at 5% to 27–30% at 50–75% hiew2023 R8; binary co-precipitates at 60 and 75% releasing 8–37.5% and wetting poorly hiew2023 R10, R9; HPMC or HPC dissolved in the anti-solvent raising release to 56–72% hiew2023 R10, R12; surface drug of at most 34% against at least 53% separating good from poor release hiew2023 R14; AUC 135 against 73 µM·h in dogs hiew2023 R15.
    Relation
    first in the library to lower the surface drug of high-loading particles on purpose and to test the result in dogs hiew2023 C47, C43; carries the surface-composition result of Bhardwaj 2018 from spray-dried to co-precipitated particles (synthesis).
    Note
    Findings: F11, F14, F28.
  80. 2023
    nguyen2023benteric coating on a delamanid dispersion tabletB. Supersaturation from ASD dissolutionfirst proposed

    Enteric coating of tablets containing an amorphous solid dispersion of an enteric polymer and a weakly basic drug: A strategy to enhance in vitro release

    Note
    Known in the library (builds_on: Nguyen 2023 on gastric pH, Van Duong 2022, Elkhabaz 2019, Schram 2016): delamanid dispersions crystallize at their surfaces at gastric pH and release less afterwards, salt forms did not cure it, posaconazole dispersions crystallized in gastric fluid, and enteric polymers inhibit crystallization where they dissolve nguyen2023b R19, C11, R20, C36.
    Added
    a 14–16% Acryl-EZE II coat cut gastric release below 0.5% and gave ≈76–86 µg/mL after every gastric pH, against ≈0.3–93 µg/mL uncoated; a 2 µm Eudragit L 100-55 layer prevented the surface crystals on dispersion films; the coat failed after about 130–150 min at pH 4.5–5.0 in buffer but lasted more than 17 h in a fed gastric medium; food components raised delamanid solubility up to 57.97 µg/mL and the release of the marketed tablet nguyen2023b R10, R2, R6, R7, R13, R14.
    Relation
    first in the library to coat a tablet of a dispersion made with an enteric polymer; remedies the gastric-pH dependence that the companion paper mapped.
    Note
    Findings: F27, F24, F25, F28, F19.
  81. 2023
    nguyen2023cgastric pH, polymer grade and drug formB. Supersaturation from ASD dissolutionextends

    Impact of Gastric pH Variations on the Release of Amorphous Solid Dispersion Formulations Containing a Weakly Basic Drug and Enteric Polymers

    Note
    Known in the library (builds_on: Van Duong 2022, Elkhabaz 2019, Li 2016, Li 2018, Almeida e Sousa 2016): the delamanid salt dispersions and their polymer screen, matrix crystallization in a gastric stage, drug leaching from enteric dispersions in acid, suppression of the ceiling by an undissolved polymer, and disproportionation of salts that are not stable in the medium.
    Added
    final release from ≈0 to 101% across three gastric pH values, five enteric grades and two drug forms; polymer release that does not track drug release; a gastric supersaturation ratio rising from ≈0.9–3.8 at pH 1.6 to ≈11–42 at pH 5.0 that does not predict release; conversion of the neat amorphous salt to crystalline free base within 5 min at pH 1.6; surface crystals on films and powders after 1 h in acid, more with HPMCAS nguyen2023c R11, R12, R13, R14, R19.
    Relation
    extends the gastric-stage crystallization of Elkhabaz 2019 across polymer grades and gastric pH, and the salt dispersions of Van Duong 2022 to a pH grid; rules out the solution route in acid.
    Note
    Findings: F25, F24, F1, F2, F8, F10, F16, F18, F19, F23.
  82. 2023
    yang2023surfactants in ritonavir–PVPVA dispersions and the drug-rich barrier at the dissolving interfaceA. Release mechanism and LoCfirst proposedconfirms

    Drug Release from Surfactant-Containing Amorphous Solid Dispersions: Mechanism and Role of Surfactant in Release Enhancement

    Note
    Known in the library (builds_on: Purohit 2017, Indulkar 2019, Li 2019, Que 2019, Saboo 2021, Correa Soto 2022 on clopidogrel, Yang 2022 on release mechanisms, Yang 2022 on surfactant-containing dispersions): the binary ritonavir–PVPVA limit of 25% and its release yang2023 R1; discrete drug-rich domains released and a continuous layer blocking release at the dissolving interface yang2023 R25, C39; surfactants raising the limit of ledipasvir, felodipine and clopidogrel yang2023 R27; Span partitioning into the drug-rich phase and lowered Tgs of the same four ternary dispersions under water vapour yang2023 R24.
    Added
    release at 30–50% with 10 parts of SDS, Tween 80, Span 20 or Span 85 (about 50–97% at 30%, 1–57% at 40%) yang2023 R2; confocal images of the interface of ten ternary compacts after partial dissolution and in situ yang2023 R6, R7, R8, R9, R10, R12, R13, R14; the water needed for separation (14.0% without, 24.5% with SDS) yang2023 R21; Tg of ritonavir–Span mixtures yang2023 R22; SDS covering the dissolved surface and needle crystals at 30% yang2023 R17, R16.
    Relation
    first in the library to image the interface of surfactant-containing dispersions in water yang2023 C1; confirms the barrier picture of the 2022 interface study for ternary dispersions and adds that a layer must persist under flow to block release; confirms the SDS-related surface crystals of the 2022 surfactant study yang2023 C40, R8, C51.
    Note
    Findings: F3, F6, F8, F15, F16, F19, F20, F21, F25, F26, F30, F31.
  83. 2024
    bapat2024drug charge and insoluble drug–HPMCAS complexesA. Release mechanism and LoCfirst proposed

    Interplay of Drug−Polymer Interactions and Release Performance for HPMCAS-Based Amorphous Solid Dispersions

    Note
    Known in the library (builds_on: Indulkar 2019, Saboo 2020 on five polymers, Hiew 2022 on lumefantrine polymers, Bapat 2023, Deac 2023 on drug load, Nguyen 2023): congruent release and the limit bapat2024 C2; the gradual decline of HPMCAS release with loading bapat2024 C3; ionic drug–polymer interactions proposed to slow enteric polymer dissolution (Hiew 2022, builds_on) bapat2024 C5; the HPMCAS gel pH of 6.0 in 50 mM pH 6.8 phosphate bapat2024 R20; the insoluble PHPH–PVPVA complex bapat2024 C41.
    Added
    drug and HPMCAS-MF release of eight drugs of different charge at 5–60% bapat2024 R2, R3, R4; the polymer slowed 1.6- to 30-fold by weak bases, most where ionized bapat2024 R5; complexation of HPMCAS at pH 6.0 (5–17% against 60–90%), with drug:COOH ratio, pH and ionic strength bapat2024 R12, R11, R13, R16; a loratadine dispersion releasing faster at pH 7.5 than 6.8, the reverse of the neat drug bapat2024 R4, R7; release on two trendlines against complexation bapat2024 R14.
    Relation
    first in the library to measure drug–HPMCAS complexes across drug charge and to set them against release bapat2024 C6; limits the gradual HPMCAS pattern of the 2020 five-polymer study to drugs that do not complex the polymer (synthesis).
    Note
    Findings: F1, F2, F9, F11, F15, F17, F23, F24, F32.
  84. 2024
    deac2024apolymer molecular weight and a new failure modeA. Release mechanism and LoCfirst proposedextends

    Dissolution mechanisms of amorphous solid dispersions: Role of polymer molecular weight and identification of a new failure mode

    Note
    Known in the library (builds_on: Indulkar 2019, Que 2020, Que 2021, Yang 2022 on release mechanisms, Deac 2023 on the interface, Deac 2024 on ternary phase diagrams): congruent, polymer-controlled release and the limit deac2024a C5; drug–polymer interactions and drug Tg lowering the limit deac2024a C2; dispersed droplets against a continuous drug-rich phase in the gel layer, here named Failure Mode II deac2024a C9; clotrimazole forming no strong interactions with PVP deac2024a C10.
    Added
    clotrimazole limits with six PVP grades, below 5% to about 38%, near the computed entanglement weight of 46,620 g/mol deac2024a R12, E1; droplet agglomeration in films and at the dissolution front of short-chain compacts deac2024a R7, R10; inversion between 30 and 40% and unchanged phase compositions for two grades deac2024a R8, R11; no droplet stabilization by PVP in dilute suspension deac2024a R5.
    Relation
    first in the library to vary the polymer grade and to describe failure by droplet agglomeration in the gel ("Failure Mode I") deac2024a C54; extends the interface picture of 2022–2023 to a failure in which the droplets are discrete when they form (synthesis).
    Note
    Findings: F1, F2, F3, F4, F6, F8, F15, F16, F20, F25, F29, F30, F31.
  85. 2024
    deac2024bternary phase diagrams and the limit of congruencyA. Release mechanism and LoCfirst proposed

    Dissolution Mechanisms of Amorphous Solid Dispersions: Application of Ternary Phase Diagrams To Explain Release Behavior

    Note
    Known in the library (builds_on: Indulkar 2019, Que 2021, Yang 2022 on release mechanisms, Deac 2023 on the interface, Deac 2023 on drug load): the limit and the cliff deac2024b C1; a continuous drug-rich phase in the gel above the limit deac2024b C2; strong interactions and high drug Tg lowering the limit deac2024b C4; limits and interaction ranks of the four analogues deac2024b R39; polymer partitioning into the drug-rich phases of the analogues deac2024b C5.
    Added
    measured drug–PVPVA–water diagrams of PHPH and MePHPH at 37 °C, with associative and segregative tie lines deac2024b R15, R17, R22, R23; PC-SAFT diagrams and critical points of all four analogues deac2024b R35, R37; the water that separates MePHPH–PVPVA (under 15 wt%) deac2024b R1, R2; the switch from droplets to a network in films deac2024b R18, R19; Tgs of the hydrated phases deac2024b R29, R30.
    Relation
    first in the library to measure and compute the phase diagrams of dispersions and to compare the critical-point loading with the limit deac2024b C59; tests the plait-point hypothesis of the 2023 drug-load paper, confirming its order and missing the PHPH film switch deac2024b X5.
    Note
    Findings: F6, F8, F17, F18, F20, F25, F27, F30.
  86. 2024
    polyzois2024praziquantel dispersions, racemate and enantiomerB. Supersaturation from ASD dissolutionfirst proposed

    Amorphous Solid Dispersion Formation for Enhanced Release Performance of Racemic and Enantiopure Praziquantel

    Note
    Known in the library (builds_on: Sato 2015, Indulkar 2019, Saboo 2020, Trasi 2015 on dispersions): cellulose polymers inhibit crystallization of two enantiomers to different extents, release can fall sharply above a threshold drug loading or decline gradually when the polymer controls it polyzois2024 C28, C16, C17.
    Added
    a seven-polymer screen that chose HPMCAS-MF and HPMC E5 LV for the racemate and found both much weaker for the R-enantiomer (37 and 15.5 min against at least 83 min); complete release up to 40–50% drug at 667 µg/mL and a gradual decline at 1.5 mg/mL without a cliff; hot-melt extrusion at least as good as solvent evaporation; commercial tablets at most 16% polyzois2024 R3, R4, R8, R9, R11, R14.
    Relation
    first in the library on a dispersion of a single enantiomer; carries the chiral polymer effect of Sato 2015 from melt growth into solution and release.
    Note
    Findings: F29, F4, F6, F10, F25.
  87. 2025
    alvarenga2025praziquantel dispersions across mediaB. Supersaturation from ASD dissolutionconfirmsextends

    Release performance and crystallization of racemic and enantiopure praziquantel amorphous solid dispersion in various media

    Note
    Known in the library (builds_on: Polyzois 2024, Elkhabaz 2021, Ilevbare and Taylor on the LLPS onset method): the praziquantel polymer choice and the enantiomer's shorter induction time, longer induction times in buffer than in simulated intestinal fluid for posaconazole and atazanavir, and the light-scattering onset as the amorphous solubility alvarenga2025 C25, C18, P7.
    Added
    amorphous solubility 4.0–7.7 times the crystalline one across nine media and nearly independent of pH for a neutral drug; HPMCAS dispersions that recovered to ≈92–103% after pH 1.6 but only ≈62–77% after pH 3.0 or 5.0; HPMC dispersions that released fast at any pH and crystallized, shown by polarized light and PXRD; a fed intestinal medium that defeated both polymers (≈34–52% at 1.5 mg/mL); an enantiomer advantage limited to simple buffer alvarenga2025 R1, R7, R10, R20, R27, R18, R8.
    Relation
    confirms and extends Polyzois 2024 across media and adds the fed-state failure; relates the medium effect to the nucleation work of the crystallization-from-solution chapter.
    Note
    Findings: F28, F29, F25, F10.
  88. 2025
    bapat2025aHPMCAS grade and the release of weak basesA. Release mechanism and LoCfirst proposedextends

    Impact of HPMCAS Grade on the Release of Weakly Basic Drugs from Amorphous Solid Dispersions

    Note
    Known in the library (builds_on: Hiew 2022 on lumefantrine polymers, Bapat 2023, Bapat 2024): the titration method and critical ionization model for enteric polymers, and the MF acid content and pKa bapat2025a C2, M4; MF release and rate data and the surface pH of 6.0 bapat2025a R15, X7; hydrophobic ion pairs of weak bases with HPMCAS-MF and the complexation test bapat2025a C5.
    Added
    neat rates of HPMCAS LF, MF and HF bapat2025a R1; release of 25% loratadine and cinnarizine from the three grades at pH 6.8 and 7.5 bapat2025a R2, R3; titrated acid contents and pKa bapat2025a M3, M5, R8; complexation by grade, ratio and pH bapat2025a R9, R11, R12.
    Relation
    first in the library to compare HPMCAS grades for release of weak bases bapat2025a C24; extends the 2024 complexation result from one grade to three.
    Note
    Findings: F1, F2, F4, F11, F15, F19, F23, F24, F32, F33.
  89. 2025
    hiew2025surface composition and wettability of high-loading particlesA. Release mechanism and LoCfirst proposedrevises

    The importance of surface composition and wettability on the dissolution performance of high drug loading amorphous dispersion formulations

    Note
    Known in the library (builds_on: Indulkar 2019, Deac 2023 on the interface, Deac 2023 on drug load, Hiew 2023): the release decline above a threshold loading in copovidone hiew2025 C4; a hydrophobic continuous phase blocking release hiew2025 C4; the hierarchical co-precipitation method and 70% grazoprevir particles with HPMC diluting the surface hiew2025 R22, C7.
    Added
    release of 75% grazoprevir–HPMCAS particles with seven secondary excipients hiew2025 R9; FaSSIF contact angles splitting good from poor materials hiew2025 R15, R17; XPS surface drug of 32–50% for good and poor alike hiew2025 R14; de-agglomeration by sonication and sieving hiew2025 R13, R11; high-shear treatment of a 75% solvent-evaporated dispersion hiew2025 R10.
    Relation
    first in the library to screen secondary excipients against wettability hiew2025 C40; revises the surface-drug reading of the 2023 study: among diluted surfaces wettability, not surface drug content, separated good from poor release hiew2025 C35.
    Note
    Findings: F11, F14, F28, F35.
  90. 2025
    kaur2025bedaquiline–HPMCAS complexation and biorelevant mediaA. Release mechanism and LoCfirst proposedextends

    Impact of drug-polymer complexation and media properties on the release performance of amorphous solid dispersions containing a weakly basic drug and hydroxypropyl methylcellulose acetate succinate

    Note
    Known in the library (builds_on: Duong 2022, Hiew 2022 on lumefantrine polymers, Bapat 2023, Nguyen 2023, Bapat 2024, Bapat 2025): ionic weak base–HPMCAS interactions impeding release kaur2025 C3; the gel pH of HPMCAS-MF and media effects on HPMCAS release kaur2025 R22; insoluble complexes of lipophilic cationic drugs with HPMCAS kaur2025 C3; delamanid dispersions without a biorelevant-media effect, as a contrast kaur2025 C52.
    Added
    bedaquiline–HPMCAS LF and MF complexation at pH 5.8–10.5 and in FaSSIF-V1 and FeSSIF-V2 kaur2025 R5, R6, R7, R8; drug protonation in the complex and in a dry dispersion by XPS kaur2025 R20; release in buffers after a pH shift and in three biorelevant fluids kaur2025 R12, R13, R15, R16, R17; amorphous residues and induction times with polymer kaur2025 R14, R18.
    Relation
    first in the library to measure drug–polymer complexation in simulated intestinal fluids kaur2025 C57; extends the complexation results of 2024–2025 to a drug of pKa 8.5 and shows that micelles change release where FaSSIF changed nothing for non-complexing drugs in 2023 (synthesis).
    Note
    Findings: F1, F16, F19, F23, F24, F32, F33, F34.
  91. 2025
    shah2025HPMCAS grade and ionization with posaconazoleD. Crystallization from solutionextends

    Chemistry and ionization of HPMCAS influences the dissolution and solution-mediated crystallization of posaconazole amorphous solid dispersions

    Known before
    the ultracentrifugation method for the LLPS concentration, the UV-extinction induction-time method, posaconazole fluorescence and HPMCAS delaying posaconazole crystallization, polymer-controlled dissolution with an HPMCAS pKa of about 4.9, the pH-dependent ionization and solubility of the HPMCAS grades, and posaconazole as a fast crystallizer (builds_on) shah2025 P3, P4, C5, M2, C4.
    Added
    posaconazole at pH 5.5, 6.5 and 7.5 in FaSSIF-V2 buffer with HPMCAS L, M and H: LLPS concentrations with 900 µg/mL polymer, induction times at 10 µg/mL with 90 µg/mL polymer, fluorescence below and above the LLPS concentration, droplet size, ζ-potential and polymer depletion into the droplets, and release from 10 and 25 wt% dispersions shah2025 R2, R3, R9, R11, R15, R16, R4, R5.
    Relation
    extends the carboxylate and pH results of 2012–2016 above the polymer pKa, where, unlike at pH 3–3.8, more ionization weakened HPMCAS; against wilson2021, the grade that entered the droplets most (H) inhibited best shah2025 C13, C14, C51.

01Links between findings of different chapters

same mechanism · 72builds on · 51conditions differ · 36extends · 27explains · 10contradicts · 7

Links between chapters: Dissolution

Pairs are written once. The direction runs from the finding that needs the other, or whose papers are later, to the finding that supplies its basis, data or caution. The four chapters, in their logical order, are C. Amorphous solubility and LLPS, D. Crystallization from solution, B. Supersaturation from ASD dissolution and A. Release mechanism and LoC; link text gives the chapter letter and the finding number. Rows are ordered by the chapter and finding of the first column. Relations: builds on, explains, extends, same mechanism, conditions differ, contradicts; "explains" means that the finding in the first column gives the reason for the one in the second, or the reverse where the sentence says so. Citation keys are in sources.md; every id cited in a row appears in one of the two chapter findings of that row. Reasoning that goes beyond the cited chapter findings is marked (synthesis).

fromtorelationwhy
C F10D F1extendsFive weak bases left a non-birefringent precipitate with a Tg of 28–56 °C after a pH rise hsieh2012 R1, R5, R10; for three such bases (clotrimazole, atazanavir, nicardipine) the total LLPS concentration rose 30- to 65-fold with ionization while the un-ionized part stayed near 5.6–8.4, 57–70 and 4.5–6.8 µg/mL indulkar2015 R18, R5, R6, R7, R9, F2.
C F23D F1extendsThe two outcomes of a pH shift, crystals that end supersaturation within minutes or an amorphous solid that holds a plateau hsieh2012 R1, R5, R10, were placed on the dose: pazopanib above its amorphous solubility at pH 6.5 formed glassy colloids with a capped free drug, and at about 0.5 times it formed no colloids and could only crystallize sugihara2018 R8, R11, R12, R15, R20.
C F23D F16extendsAfter a pH shift chemically diverse polymers kept glyburide and warfarin precipitates amorphous for at least 6 h but none stopped papaverine or dipyridamole crystallizing hsieh2014 R4, R12; for pazopanib the outcome was set by the dose relative to the amorphous solubility at the intestinal pH, and HPMC set how long supersaturation lasted sugihara2018 R8, R20, R22.
D F2C F5same mechanismThe supernatants of four type 2 bases after a pH rise (5.09, 157, 76.5 and 11.3 µg/mL) lay near Hoffman estimates of the amorphous solubility hsieh2012 R10, as solvent-shift onsets of 17 compounds lay mostly at 0.91–1.15 times the prediction C_{amorphous} = C_{eq}\,e^{-I(a_2)}\,e^{\Delta G/RT} ilevbare2013a R8; almeidaesousa2015 R5, R11; indulkar2015 R2; mosqueragiraldo2015 R13; in both chapters the best-fitting estimate changes with the compound.
D F2C F6extendsWarfarin held 103–224 µg/mL, 13–25 times its polymer-specific solubility, against a Hoffman ratio of about 48 hsieh2014 R4, R16, inside the range of maximum supersaturations, about 2 to 600, that the amorphous-solubility chapter measured and called "highly compound dependent" almeidaesousa2015 R5, C23; sugihara2018 R4.
D F2C F10builds onThe plateaus of the type 2 bases and the measured amorphous solubility of posaconazole at pH 7.0 (9.08 µg/mL) are values for drugs that are largely un-ionized in the test hsieh2012 R10; duong2022b R6, R7; for weak bases the limit is set by the un-ionized drug and the total rises with ionization indulkar2015 R18, F2 (synthesis).
D F2C F13same mechanismDissolved amorphous ritonavir reached 19.8 of a calculated 20.6 µg/mL, efavirenz 12.3 of 19.8 and celecoxib only 2.5 of 22.6 ilevbare2013c R2; amorphous films of three weak bases reached 69–110% of the LLPS concentration indulkar2015 R18, F6; in both, a dissolving amorphous solid reaches the limit only when crystallization is slow enough.
D F3C F3same mechanismStarted at their calculated amorphous solubility without polymer, celecoxib, efavirenz and ritonavir crystallized after about 2.4, 5.1 and 120 min ilevbare2013c R8, R9.a, the drug-dependent lifetime, from minutes to hours, of the drug-rich phase in the LLPS chapter ilevbare2013a R8, R11, R12; mosqueragiraldo2015 R1; almeidaesousa2015 R1, R4.
D F4C F1builds onDanazol separated a noncrystalline drug-rich phase seen by UV extinction and the pyrene ratio jackson2014 R5.a, R8, R6, the same read-outs and the same phase as in the 21 compounds of the amorphous-solubility chapter ilevbare2013a C2, R8; almeidaesousa2015 C41.
D F4C F3same mechanismWithout polymer the danazol drug-rich phase gave crystals within 6–10 min by three read-outs jackson2014 R13, R17.a–c, like telaprevir (birefringent particles after about 15 min) and the six fast crystallizers that turned turbid "only a few minutes" before particles appeared mosqueragiraldo2015 R1; almeidaesousa2015 R1.
D F4C F4conditions differThe danazol onset moved from 13 to about 8 µg/mL when it was read 1 or 5 min instead of 15 s after the addition jackson2016 R8, R13, a reading-time effect not considered in the agreement of onset methods within a few µg/mL for ritonavir, telaprevir, lopinavir and paclitaxel ilevbare2013a R8, R4, R6; mosqueragiraldo2015 R13; trasi2015a R1.
D F9C F6builds onGrowth inhibition by CAP Adp 0.85 fell from 6.4-fold at S 3.8 to 1.6-fold at S 15.3, the calculated amorphous solubility ilevbare2012b R5; the supersaturation at which a polymer must act is the drug's maximum supersaturation, which ranges from about 2 to about 600 almeidaesousa2015 R5, C23; sugihara2018 R4 (synthesis).
D F14C F14same mechanismHPMC lengthened celecoxib's induction time 31-fold at S 7.3 against about 5-fold at S 14.7 ilevbare2013c R15, R9.a, R9.j, R16, and for pazopanib after a pH shift the time supersaturation lasted rose from 5 ± 2 to about 39 min with 50 µg/mL HPMC sugihara2018 R22; in both, a dissolved polymer buys time that depends on the supersaturation reached.
D F15C F19conditions differFor danazol three polymers at 1–1000 µg/mL left the onset at about 8 µg/mL jackson2016 R8, R17, whereas HPMC and PVP-VA at 300 µg/mL lowered the amorphous solubility of ibuprofen from 177.1 to about 91–97 µg/mL by entering its drug-rich phase ueda2020b R1; whether a polymer lowers the onset depends on the drug–polymer pair.
D F15C F20conditions differThe enzalutamide and posaconazole droplets held HPMCAS and changed size and charge with the polymer wilson2021 R13, R14; shah2025 R11, R15, and the share of polymer in the ibuprofen drug-rich phase ranged from about 0.40 to 1.14 by weight with grade and chemistry ueda2021 R5; the danazol onset did not move with polymer jackson2016 R8.
D F15C F22same mechanismHPMC and HPMC-AS kept danazol droplets at about 230–345 nm for 2–4 h instead of about 9800 nm in 1 h jackson2014 R22, R23, and HPMC and PVP-VA gave ibuprofen droplets of 268–345 nm against 3182–5313 nm in buffer ueda2020b R5, R6.
D F19C F8builds onSupersaturation has to be referred to solubilities measured in the same medium hsieh2014 R4; chen2015 R1, because above the limit the free concentration, activity and flux stop rising and extra drug only adds drug-rich phase mosqueragiraldo2015 R10, R12; trasi2015a R2, R1.
D F19C F11same mechanismTaurocholate lowered the amorphous solubility of atazanavir from 65 to 38 µg/mL indulkar2018 R6, and the bile salts STCDC and SGCDC lowered the maximum flux of telaprevir, read as components that mix into the drug-rich phase like a second drug lu2017b R13, R18, C31, X6; trasi2015a R7.
D F19C F18builds onFaSSIF and FeSSIF raised both posaconazole limits while the concentration ratio fell from about 34 to about 20 duong2022b R8; in SDS the amorphous solubility of atazanavir rose only half as much as predicted from the crystal because the micelle/water partition coefficient falls with drug concentration indulkar2017a R9, R14.
D F19C F19same mechanismPolymers that entered enzalutamide droplets lowered the dissolved drug from 42 to about 20–37 µg/mL wilson2021 R8, as HPMC and PVP-VA lowered the amorphous solubility of ibuprofen without changing its crystalline solubility ueda2020b R1.
D F20C F14extendsA dissolved polymer holds a crystal-free solution for hours but not one seeded with crystals (felodipine with HPMC: about 5.0 against 2.2 µg/mL) alonzo2012 R18, which bounds the time a polymer buys for dissolving solid forms, where HPMC raised the CRH1 maxima from 2.9–5.4 to 6.2–12.1 µg/mL almeidaesousa2016 R8, R9.
D F21C F3extendsSix dihydropyridine precipitates from a 10 mg/mL solvent shift stayed amorphous for 0.25 to 12 h raina2015b R6, R7, R8, a range of lifetimes for the drug-rich phase beside the minutes of telaprevir and griseofulvin without polymer mosqueragiraldo2015 R1; almeidaesousa2015 R1, R4.
D F22C F7builds onThe revised danazol onset of about 8 µg/mL matched a recalculated amorphous solubility of 7.8 µg/mL jackson2016 R8, R3, the comparison for which the heat-capacity free energy fitted better than the Hoffman equation for high-melting drugs almeidaesousa2015 R14, R15; mosqueragiraldo2015 R13.
D F22C F8same mechanismThe maximum membrane flux of danazol at 15 µg/mL did not fall with three polymers jackson2016 R8, R9, R3, R11, the same plateau of flux at the limit seen for telaprevir, ritonavir, lopinavir and paclitaxel mosqueragiraldo2015 R10, R12; trasi2015a R2, R1.
D F22C F19contradictsThree polymers at 1–1000 µg/mL left the danazol onset at 7–9.1 µg/mL (all p > 0.3) jackson2016 R8, R9, whereas HPMC and PVP-VA at 300 µg/mL lowered the ibuprofen amorphous solubility by about 45–49% (177.1 → 96.9 and 90.7 µg/mL) ueda2020b R1; the two results differ by drug, polymer level and method and were not reconciled in either paper (synthesis).
D F25C F3builds onThe telaprevir nucleation screen was run at 150 µg/mL, above the glass–liquid phase separation at about 90–100 µg/mL mosqueragiraldo2016 R4, where without polymer the drug-rich phase gave birefringent particles after about 15 min mosqueragiraldo2015 R1.
D F26C F20builds onPVPVA and HPMCAS were found in the felodipine precipitate and in the water, PAA almost only in the water raina2015b R12; the polymer:drug ratio in a drug-rich phase was later measured by NMR, about 0.40–1.14 for six polymers with ibuprofen ueda2021 R5.
D F28C F12builds onRuns with STC and SDS were set at a fixed ratio of concentration to the crystalline solubility measured in the same medium chen2015 R1, C7, the scale on which a micellar solubilizer raises crystalline solubility and LLPS concentration together ilevbare2013a R16, C54.
D F28C F17conditions differAt 0.1% sodium taurocholate lengthened the induction time of all 11 drugs chen2015 R3, C13, while for telaprevir the trihydroxy bile salts did little to either solubility and only STCDC and SGCDC lowered the maximum supersaturation lu2017b R1, R2, R13; the bile salt acts on nucleation without changing the thermodynamic limit.
D F29C F17same mechanismThe best bile salt for delaying crystallization depended on the drug and "not interchangeable" was the conclusion li2016a R6, C63, C69, the same words used for the thermodynamic effects of six bile salts on telaprevir lu2017b C56, C52.
D F31C F16builds onThe flux-based supersaturation at the amorphous solubility was 63–65 for atazanavir and 9.2–10 for ritonavir in buffer, FaSSIF-V1 and a six-bile-salt medium indulkar2018 R12, R8, the activity scale on which the micellar concentration ratio understates supersaturation about twofold indulkar2017a R11, R13.
D F31C F17builds onThe telaprevir nucleation runs at an activity-based supersaturation of 11.5 used the flux calibration of the bile-salt thermodynamics study, in which 12 mM dihydroxy salts doubled both solubilities lu2017 R1, R3; lu2017b R1, R2.
D F32C F3extendsAt δ 28.8, just above the amorphous solubility, buffer crystallized at once and 1.86 mM bile salts held the drug-rich solution from about 30 to more than 960 min lu2017 R4, an inhibitor-dependent lifetime of the drug-rich phase like those of telaprevir with 5 µg/mL HPMCAS-MF mosqueragiraldo2015 R1.
D F32C F17builds onAt 12 mM STDC, SGDC and STCDC lost most of their delay (about 140, 125 and 180 min) lu2017 R3; these are the micellar dihydroxy bile salts that raised the telaprevir GLPS onset to 238–360 µg/mL lu2017b R1, R2.
D F33C F17conditions differMonomeric STCDC stopped growth on telaprevir seeds and held 60.5 of 65.2 µg/mL for 15 h lu2017a R7, R12, whereas in the thermodynamic study STCDC and SGCDC lowered the maximum flux to about 0.8–0.9 of buffer lu2017b R13, R18; the same bile salts inhibit growth and lower the ceiling.
D F34C F10builds onThe posaconazole induction times were run at S 5 to 33.6 in PBS pH 6.5 up to its amorphous limit duong2022b R10, a weak base whose limit is set by the un-ionized drug indulkar2015 R18, F2.
D F34C F18builds onIntestinal media changed posaconazole nucleation in both directions duong2022b R11; in micellar media the partition coefficient of drug into micelles was later found much lower at the amorphous than at the crystalline solubility for atazanavir and posaconazole elkhabaz2019b C33; duong2022b C45.
D F35C F9explainsThe polymer-free induction times of atazanavir differed about sixfold between buffers of different species and strength mosqueragiraldo2018a R1.b; enright2020 R2; buffer strength alone moved the ritonavir LLPS concentration from 37.2 to 4.7 µg/mL and the telaprevir onset from about 149 to 104 µg/mL ilevbare2013a R13; lu2017b R9, so the starting supersaturation changes with the buffer (synthesis).
D F37C F19builds onEudragit E PO and HPMCAS both lowered dissolved enzalutamide from 42 to about 20–37 µg/mL wilson2021 R7, R8, the lowering by polymers that enter the drug-rich phase first shown for ibuprofen ueda2020b R1, C33.
D F37C F20extendsThe share of polymer in the droplets (about 41 w/w% Eudragit E PO against 13–25 w/w% HPMCAS; HPMCAS-H about 31 wt% in posaconazole droplets) did not rank the inhibitors wilson2021 R7, R3; shah2025 R17, R3, although it set how far each polymer lowered dissolved ibuprofen ueda2021 R5, R11.
D F38C F16builds onThe SDS nucleation series was run at an equal flux-based supersaturation of about 65 indulkar2019b R3, R1, R2, the activity scale on which the atazanavir concentration ratio fell to about 33 in SDS while the activity ratio stayed at about 65 indulkar2017a R11, R13.
D F38C F18builds onAbove the CMC the amorphous solubility and the dose rose from about 115 to 1480 µg/mL while the induction time stayed at about 52–68 min indulkar2019b R3, M2; the micellar solubilization of the amorphous drug is the one that rose only half as much as predicted indulkar2017a R9.
D F39C F11conditions differLecithin and its digestion products shortened atazanavir induction times indulkar2018 R16, R19; enright2020 R6, R10; in the thermodynamic chapter a second component acts by mixing into the drug-rich phase and lowering the limit trasi2015a R7, R16, E4, a route not measured for the lipids.
D F39C F17conditions differTelaprevir crystallized in FaSSIF (about 21 min) as fast as in buffer although taurocholate alone held it beyond 960 min lu2018 R6, R4; the thermodynamic study had found STC, the bile salt of FaSSIF, to do little to telaprevir's solubilities lu2017b R1, C52.
D F40C F17extendsA six-bile-salt medium held atazanavir, ritonavir, tacrolimus and telaprevir about two- to more than fortyfold longer than FaSSIF indulkar2018 R20, R12; lu2018 R6, the kinetic side of the finding that STC "is not an adequate surrogate" for the human bile salts lu2017b C52, C56.
B F1C F13conditions differAmorphous films of three weak bases and a ritonavir film reached the LLPS concentration indulkar2015 R18, F6; ilevbare2013a R13, whereas neat amorphous felodipine at 37 °C was about 54% crystalline at the first reading and dissolved only to the crystal level alonzo2010 R2, R1; the limit is reached only by drugs whose wetted solid does not crystallize first.
B F1C F14same mechanismThe rates of crystallization in the wetted solid and in solution relative to dissolution "in large part shape" the concentration–time profile alonzo2010 C32, C47; for the solid forms of CRH1 reaching the limit was likewise decided by dissolution outrunning crystallization almeidaesousa2016 R8.
B F1D F2same mechanismNeat amorphous felodipine and celecoxib crystallized in the slurry and dissolved no higher than the crystal alonzo2010 R2, R1; xie2015 R4, R8, R7, as dissolved amorphous celecoxib reached only 2.5 of a calculated 22.6 µg/mL while slowly crystallizing ritonavir reached 19.8 of 20.6 ilevbare2013c R2.
B F2C F14extendsDissolved polymer bought time for wetted amorphous felodipine (50% crystallinity after 13.5–20.5 min instead of within 1 min) but not for nifedipine or celecoxib particles alonzo2010 R6, R5, R4, R3; raina2014b C11, R2; xie2015 R9, R10, whereas 20 µg/mL HPMC raised the maxima of every CRH1 form almeidaesousa2016 R9.
B F2D F2extendsFelodipine with dissolved PVP, HPMC or HPMC-AS peaked at 7.3–12.0 µg/mL against an estimated amorphous solubility of about 9 µg/mL alonzo2010 R4, R3; the solution chapter compares such plateaus with estimates and finds that the best estimate changes with the compound hsieh2012 R10; jackson2014 R5, R1, X1.
B F2D F20same mechanismWith 5 µg/mL HPMC or HPMCAS in the buffer, wetted amorphous celecoxib formed no crystals in the liquid but crystallized on its particles xie2015 R9, R10, R7; a dissolved polymer holds a crystal-free solution but not one that contains crystals alonzo2012 R18; ilevbare2012b R5, R17.
B F3D F6extendsDissolved PVP, HPMC and HPMCAS lengthened the life of γ nifedipine to about 20, 60 and 110 min raina2014b R9, R10, an effect on conversion beside the separate effects of polymers on nucleation and growth alonzo2012 R5, R16, R17.
B F3D F21conditions differNeat nifedipine glass crystallized as γ within minutes in buffer raina2014b R6, R8, and nifedipine was the fastest of six dihydropyridines precipitated from a solvent shift (Bragg peaks at 0.25 h) raina2015b R6, R7, R8.
B F4D F7same mechanismThe best polymer for sustaining supersaturation changed with the drug konno2008a R7; xie2015 R1; duong2022a R4, as the best growth inhibitor did: 12.6 (ritonavir), 10.2 (celecoxib) and about 4.9 (efavirenz) with different polymers ilevbare2013b R9.
B F4D F8explainsCellulosic polymers held felodipine, danazol, celecoxib and praziquantel far longer than PVP or PVPVA konno2008a R7; jackson2015 R5; xie2015 R1; polyzois2024 R3; the solution chapter explains growth inhibition by moderate hydrophobicity relative to the drug, ionized carboxyls and a semirigid chain, with flexible synthetic chains mostly failing ilevbare2012c R10, R11; ilevbare2013b R9.
B F4D F13same mechanism5 µg/mL PVP left the ritonavir induction time at 120.0 against 119.3 min ilevbare2013d R12, and flexible synthetic polymers did not work for ritonavir and efavirenz even when matched in solubility parameter ilevbare2013c R13, R9.
B F4D F15same mechanismDanazol dispersions began to crystallize after about 56–70 (PVP), 188–200 (HPMC) and 284–319 min (HPMCAS) jackson2015 R5, the order of the antisolvent induction times with the same polymers jackson2014 R17; jackson2016 R17.
B F5C F1conditions differThe felodipine solvent shift to a nominal 50 µg/mL read about 6 µg/mL at 5 min konno2008a R12, a solution far above the onset at which supersaturated solutions split into a drug-rich phase ilevbare2013a C2, R8; the drop was read as crystal growth, not as phase separation (synthesis).
B F5D F5builds onThe 2008 growth reading of felodipine rested on initial slopes and equal crystal surface areas konno2008a R16, C28; the seeded slope and the unseeded induction time later measured growth and nucleation separately, with assumptions checked only in part ilevbare2012a R7, R9; ilevbare2013b R5.
B F5D F6contradictsKonno and co-workers concluded that the cellulose polymers "appeared to reduce" growth and did not prevent nucleation konno2008a C28, C36, C25; with seeded and unseeded runs separated, 1 µg/mL HPMC slowed felodipine growth only 1.6-fold but nucleation about 1,400-fold alonzo2012 R5, R16, R17.
B F5D F9same mechanismHPMCAS slowed growth on celecoxib seeds about 70-fold but nucleation about 4000-fold xie2016a R12, R13, and growth inhibition weakens as supersaturation rises, to 1.6-fold for ritonavir at its amorphous solubility ilevbare2012b R5.
B F5D F20same mechanismHPMCAS held unseeded paclitaxel at S ≈88 for more than 16 h but was "unable to completely block crystal growth" on seeds que2018 R3, R14, C30; for felodipine an unseeded HPMC solution held its level while a seeded one fell from about 5.1 to 2.2 µg/mL within 58 min alonzo2012 R18.
B F6D F13builds onThe celecoxib dispersion study used the induction-time screen, which it called "quite predictive" xie2015 C48; in that screen the best polymer lengthened the celecoxib time from 2.4 to about 12.6 min at its amorphous solubility ilevbare2013c R9, R12.
B F6D F15builds onThe danazol dispersion order PVP < HPMC < HPMCAS matched antisolvent induction times of about 111, 173 and 365 min jackson2015 R5, the polymer series of the solution chapter jackson2016 R17, C46.
B F6D F35same mechanismSolution tests ranked polymers as dispersion dissolution did but the absolute times differed (danazol PVP dispersions crystallized after about 56–70 min, half the antisolvent value) jackson2015 R5, X8, as induction times of one drug differ up to about sixfold between protocols mosqueragiraldo2018a R1.b; enright2020 R2.
B F7C F5builds onThe ceilings of dissolving dispersions were set against amorphous solubilities that the LLPS chapter measured or calculated, for felodipine a predicted advantage of about 9 alonzo2011 M1, R14 and for tacrolimus 46–50 µg/mL by four methods trasi2016 R4, R15, the agreement of onset and calculation of that chapter ilevbare2013a R8, C6.
B F7C F6builds onReceiver slopes of felodipine dispersions were 8.5–10.5 times those of the crystal against a predicted amorphous advantage of about 9 alonzo2011 R14, M1, the ratio that the amorphous-solubility chapter measured from about 2 to about 600 across drugs almeidaesousa2015 R5, C23.
B F7C F8same mechanismFlux, NMR and ultracentrifugation put the free drug from dissolving felodipine, danazol, ritonavir, lopinavir and tacrolimus dispersions at about the amorphous solubility alonzo2011 R14, M1; jackson2015 R9, R2, M1; trasi2016 R10, R4, R15, R14, the cap that solvent-shift solutions showed as a plateau of free drug and flux mosqueragiraldo2015 R10, R12; trasi2015a R2, R1.
B F7C F13extendsSix marketed tacrolimus capsules all levelled at ≈46–50 µg/mL, the amorphous solubility measured four ways trasi2016 R10, R4, R15, R14; the earlier tests reached the same limit from films, a ritonavir–PVP dispersion and salts indulkar2015 R18, F6; ilevbare2013a R17, R8, R13; almeidaesousa2016 R12, R2.
B F7C F19conditions differDanazol dispersions with PVP and HPMC gave 7.1–7.3 µg/mL free drug against 8.7–9.1 µg/mL with HPMCAS and an amorphous solubility of 8 µg/mL jackson2015 R9, R2; polymers that enter the drug-rich phase lowered ibuprofen's amorphous solubility by up to about half ueda2020b R1; ueda2021 R5.
B F8C F4same mechanismUV read ≈27 µg/mL for a 90:10 felodipine dispersion and ≈16.2 µg/mL for a danazol dispersion where flux gave about 8 µg/mL alonzo2011 R1, R14, R15; jackson2015 R2, R9; in solvent-shift solutions extinction cannot tell crystals from droplets and an in situ UV probe overread a drug-rich solution (19.1 against 11.4 µg/mL) almeidaesousa2015 C16; almeidaesousa2016 R12.
B F8C F15extendsNMR gave the dissolved felodipine of dispersions that UV overread alonzo2011 R14, and for low-Tg ibuprofen solution NMR separates dissolved drug from drug in the drug-rich phase in one tube (154 against 151 µg/mL calculated) ueda2021 R3, R5, R6.
B F9C F1same mechanismA ritonavir–PVP dispersion added stepwise gave ≈350 nm droplets at 20 µg/mL and none at 10 µg/mL ilevbare2013d R1, the drug-rich phase that solvent-shift solutions form past a drug-specific concentration ilevbare2013a C2, R8; almeidaesousa2015 C41.
B F9C F2same mechanismThe phase isolated from a dissolving ritonavir dispersion had a Tg of about 1 °C ilevbare2013d R2, as the solvent-shift ritonavir phase had 0.4 °C, a supercooled liquid at 37 °C ilevbare2013a R5, C23.
B F9C F4builds onDanazol dispersions were followed by the pyrene ratio and particle tracking jackson2015 R2, R5, R6, the probe and scattering methods whose onsets agree within a few µg/mL in the LLPS chapter ilevbare2013a R8, R4, R6.
B F9D F4same mechanismDanazol dispersions lowered the pyrene ratio once the concentration passed about 6–10 µg/mL and held droplets of 246–284 nm jackson2015 R2, R5, R6, the drug-rich phase that danazol forms near 8 µg/mL from a solvent shift jackson2016 R8, R13.
B F10C F13conditions differA 50:50 HPMCAS danazol dispersion levelled at ≈6 µg/mL without a drug-rich phase and a 50% posaconazole–HPMCAS dispersion never reached the amorphous solubility jackson2015 C36, R2, R9; elkhabaz2019a R8, C44, whereas films, a 1:9 ritonavir–PVP dispersion and salts reached it indulkar2015 R18; ilevbare2013a R17; the limit is reached only when release is fast enough.
B F10C F14same mechanismRelease speed set by loading decided whether danazol, celecoxib and indomethacin dispersions reached the ceiling jackson2015 R2; xie2016a R4, R17; xie2017 R10, R13, R14, as the race between dissolution and crystallization decided it for the solid forms of CRH1 almeidaesousa2016 R8, R9.
B F10D F44same mechanismAt 50% drug HPMC and HPMCAS dispersions of danazol, celecoxib and indomethacin released slowly jackson2015 R2; xie2016a R4, R17; xie2017 R10, and for posaconazole the higher-acetyl HPMCAS grades released only about 5–31 µg/mL at pH 5.5–6.5 shah2025 R4, R5; the polymer that inhibits best can limit release.
B F11C F11builds onIn dissolving films and dispersions five of six mixed ritonavir and lopinavir values lay within 0.5 µg/mL of C_{max} = S_a\,x_d trasi2015b R5, E1, the ideal-mixing relation S_a(x_1) = S_a^\circ x_1 first fitted to solvent-shift mixtures trasi2015a R16, E4.
B F11C F19same mechanismA second drug that mixes into the drug-rich phase lowered each drug's ceiling trasi2015b R5, R13, as dissolved polymers that enter the ibuprofen-rich phase lowered its amorphous solubility ueda2020b R1, C33.
B F12C F22same mechanismHPMCAS and cellulose esters kept ritonavir droplets at about 200–350 nm and HPMCP and HPMCAS kept delamanid droplets at about 440 and 600 nm for 3 h ilevbare2013d R12, R14; duong2022a R7, R5, and HPMC kept most of the ibuprofen drug-rich phase dispersed for 3 h ueda2020b R15.
B F12D F13extendsAt 20 µg/mL ritonavir, above the LLPS concentration, HPMCAS and four cellulose esters lengthened the induction time from 119.3 to 146.0–242.8 min ilevbare2013d R12, R14, the cellulose adipates that were the best nucleation inhibitors at the amorphous solubility (CAB Adp 0.81, about 244 min) ilevbare2013c R9, R12.
B F12D F15same mechanismCharged additives kept ritonavir droplets small, read as charge repulsion between adsorbed polymers ilevbare2013d C37, C38, and anionic HPMC-AS made danazol droplets more negative (−8.1 to −13.7 mV) and kept them at about 230–345 nm jackson2014 R1, R22, R23.
B F12D F37extendsAdditives that kept ritonavir droplets small did not all delay crystallization (Tween 80 and several ethers cut it to 23.6–59.5 min) ilevbare2013d R12, R14, and with enzalutamide the polymer that loaded the droplets most inhibited worst wilson2021 R7, R3.
B F13C F3extendsThe drug-rich phase is a transient precursor of crystals ilevbare2013a R8, R11, R12; mosqueragiraldo2015 R1; in a dissolving ritonavir system crystallization appeared to start inside the droplets, which the authors read as droplets that "appear to promote" crystallization ilevbare2013d C39, C41.
B F13D F14same mechanismThe induction time of ritonavir fell from about 284 to 119.3 min across its LLPS concentration ilevbare2013d R16, R12, part of the general fall of induction time with supersaturation, for example danazol with HPMC-AS from 516 to 277 min between 10 and 20 µg/mL jackson2014 R17.
B F13D F37same mechanismRitonavir crystallized after about 120 min just above the LLPS concentration against about 284 min just below it ilevbare2013d R16, R12, and crossing enzalutamide's amorphous solubility cut the induction time with HPMCAS from about 129 to 43 min wilson2021 R3.
B F14D F18same mechanismTween 80 and SDS cut the ritonavir induction time with droplets to 23.6 and 34.7 min ilevbare2013d R12, and below their CMC TPGS and Tween 80 doubled ritonavir crystal growth ilevbare2012a R17, R1.g, M17.
B F14D F28same mechanismAt S = 5 SDS and polysorbate 80 shortened the celecoxib induction time while STC held it beyond 960 min chen2015a R12, C6, the same split as 0.1% STC lengthening and SDS shortening the induction time of most of 11 drugs chen2015 R3, C17, C18.
B F14D F31builds onSTC at 0.75% held celecoxib beyond 960 min chen2015a R12; the bile salt delay is not a solubilization effect, since at matched concentration ratios and unchanged flux the induction times still rose chen2015 R1, R3; li2016a R13, R15.
B F14D F38same mechanismSDS below its CMC still cut the celecoxib induction time to 29 min chen2015a R12, C6, and for atazanavir SDS shortened the induction time between about a seventh of its CMC and the CMC indulkar2019b R3, R1, R2, M2.
B F15D F19builds onThe celecoxib supersaturation in SDS assumes that about 860 µg/mL dissolved HPMCAS leaves the crystalline solubility unchanged chen2015a R18, X9, whereas 1 mg/mL polymers raised the crystalline solubility of papaverine from 12.2 to 19.0–21.9 µg/mL and of warfarin from 3.7 to as much as 10.7 µg/mL hsieh2014 R4.
B F15D F44same mechanismAt pH 5 with SDS, HPMCAS-LF dissolved from lopinavir dispersions to about 290–330 µg/mL and HPMCAS-HF to about 120 µg/mL, which the authors attribute to a "small extent" of polymer ionization li2016b R13, R16, C24, C49; the low-succinoyl HPMCAS grades released posaconazole poorly at pH 5.5 shah2025 R4, R5; in both, partial ionization near pH 5 decides how much enteric polymer, and with it drug, is released (synthesis).
B F16C F14extendsWhether the wetted dispersion crystallizes depends on the dispersion polymer and its content, and an inhibitor in the medium did not prevent it wegiel2015 R9, R14; xie2016a R9, R10; for undispersed solid forms of CRH1 a dissolved polymer raised the maxima almeidaesousa2016 R9.
B F16D F20same mechanismCrystals that formed in PAA particles kept celecoxib release at about half even when 5 µg/mL HPMCAS held the dissolved drug for 16 h xie2016a R9, R10, C31; µg/mL polymer levels do not hold a solution that already contains crystals alonzo2012 R18; ilevbare2012b R17.
B F17C F12same mechanismEPO raised the crystalline solubility of indomethacin from 1.61 to 6.2 µg/mL and its amorphous solubility with HPMC from 36 to 41–56 µg/mL xie2017 R1, R3, as Tween 80 raised both ritonavir solubilities so that their ratio stayed near 14 ilevbare2013a R16.
B F17C F19conditions differDissolved HPMCAS raised crystalline resveratrol about tenfold at 10 mg/mL wegiel2015 R2, R3, while at 300 µg/mL HPMC and PVP-VA left ibuprofen's crystalline solubility unchanged and lowered its amorphous solubility; only cationic EUD-E raised both ueda2020b R1.
B F17D F19same mechanismFelodipine, celecoxib and lopinavir kept their crystalline solubility within about 1.4-fold at the polymer levels tested konno2008a R1; xie2015 R11; xie2016a R1; li2018 R1, whereas 1 mg/mL polymers raised papaverine from 12.2 to 19.0–21.9 µg/mL hsieh2014 R4; supersaturation has to be referred to the same medium.
B F18C F11extendsAn undissolved polymer mixed with lopinavir lowered its maximum below the 17.4 µg/mL amorphous solubility, most at 15% drug (≈0.3–4.3 µg/mL) li2018 R3, R1, the mixing argument of a second component lowering the activity of the drug-rich phase trasi2015a R7, R16, E4.
B F18C F19same mechanismHPMCP and EC films held lopinavir far below its amorphous solubility while a dissolving polymer (HPMC) did not li2018 R3, R8, R14; dissolved polymers that enter the ibuprofen-rich phase lowered its amorphous solubility by up to about half ueda2020b R1; ueda2021 R5.
B F18C F20same mechanismThe lowering of the lopinavir maximum rose as drug loading fell li2018 R3, as the lowering of dissolved ibuprofen rose with the polymer:drug ratio in its drug-rich phase ueda2021 R5, R11.
B F19C F12same mechanismSurfactants raised leached lopinavir and its crystalline solubility together, so that C/Ceq stayed at ≈3.25–3.9 with HPMCAS-HF li2016b R19, R20, as a micellar solubilizer raised both ritonavir solubilities without raising the ratio ilevbare2013a R16, C54.
B F19C F16conditions differThe constant lopinavir C/Ceq in micellar media is a concentration ratio li2016b R19, R20; for atazanavir in SDS the concentration ratio fell to about 33 while the flux-based activity ratio stayed at about 65 indulkar2017a R11, R13.
B F19D F19builds onLeaching was judged against the crystalline solubility measured in the same surfactant medium li2016b R19, R20, the reference that the solution chapter requires because surfactants raised it up to about 266-fold chen2015 R1.
B F20D F13builds onHPMCAS and HPMC were chosen as the minor inhibitor xie2015 R6, the polymer that was best for celecoxib in the induction-time screen (HPMC, 2.4 → about 12.6 min) ilevbare2013c R9, R12.
B F20D F17conditions differA minor cellulosic in PVP or PAA dispersions held released celecoxib for 16 h xie2015 R6; xie2016a R14, R17, a combination aimed at nucleation and release; the polymer pairs of the solution chapter acted on ritonavir growth, mostly at twice the total polymer ilevbare2012a R11, R12.
B F20D F44same mechanismAdding HPMCAS or HPMC to a PVP dispersion removed desupersaturation but slowed release (≈6.7–12.4 against ≈16.1 µg/mL at 2 h) xie2015 R6, the same trade-off between inhibition and release that the HPMCAS grades showed for posaconazole shah2025 R3, R4, R5.
B F21C F10conditions differIndomethacin is a weak acid whose solubility rises on the shift from pH 2.2 to 5 or 6.8 xie2017 R10, R22, the mirror image of weak bases, whose total limit rises as pH falls indulkar2015 R18, F2 (synthesis).
B F21C F23same mechanismIndomethacin nanodroplets formed in acid redissolved within about 2 min after the shift to pH 5, while crystals formed in acid recovered only to 32.1 of 40 µg/mL xie2017 R10, R20, R19, R23; for pazopanib the pH-shift outcome was likewise set by whether glassy colloids or crystals formed sugihara2018 R8, R20.
B F21D F1same mechanismWhat separated in acid decided recovery after the pH rise xie2017 R19, R23, R25, as after a pH shift the form of the precipitate, crystalline or amorphous, matched the solution behaviour in all ten weak bases hsieh2012 R1, R5, R10.
B F22D F6same mechanismHPMCAS held unseeded paclitaxel more than 16 h against 6 min without polymer but only slowed growth on seeds que2018 R3, R14, the decoupling of nucleation and growth inhibition seen for felodipine with HPMC alonzo2012 R5, R16, R17.
B F22D F9same mechanismAt S ≈88 HPMCAS could not stop growth on paclitaxel seeds que2018 R3, R14, as growth inhibition by polymers weakened with supersaturation and ritonavir grew continuously above a critical supersaturation ilevbare2012b R5, R12, R13.
B F22D F10builds onQue and co-workers explain continued growth on paclitaxel seeds by a two-dimensional nucleus (5.4–7.0 nm) smaller than the spacing of adsorbed polymer (≈10.5–16.8 nm) que2018 R15, R12, C38, the step-pinning picture fitted to felodipine and ritonavir growth alonzo2012 R7, R8, R13; ilevbare2012b R16.
B F22D F20builds onHPMCAS held unseeded paclitaxel for 16 h but seeds lowered it to 7.9–25.3 µg/mL que2018 R3, R13, R14, the contrast between unseeded and seeded solutions first shown for felodipine and ritonavir alonzo2012 R18; ilevbare2012b R5, R17.
B F22D F24builds onSeeds grown at S 16 and S 80 with the same end area left different residual levels que2018 R6, R18, R14, after the felodipine finding that the seed route changed HPMCAS growth inhibition from 2.7- to 12-fold schram2016 R2.
B F23C F7conditions differFor delamanid the Hoffman estimate of the amorphous-to-crystalline ratio (31.8) lay below the measured 42.3 duong2022a R27, C43, whereas for high-melting drugs the Hoffman free energy overshot the onset (telaprevir 245 against 90–92 µg/mL) mosqueragiraldo2015 R13; almeidaesousa2015 R14, R15.
B F24D F11builds onIn acid, where enteric polymers stay undissolved, wetted posaconazole and delamanid dispersions crystallized elkhabaz2019a R16, R20; nguyen2023c R19, R20, and in solution carboxylated cellulose esters lost most of their inhibition at pH 3–3.8 ilevbare2012b R7, R9; mosqueragiraldo2016 R7.
B F24D F23builds onDelamanid salt dispersions crystallized at their surfaces in acid, more with HPMCAS grades nguyen2023c R19, R20, where adsorbed HPMCAS sits on crystals as separate globules at pH 3 and slows growth about 1.8-fold less than at pH 6.8 schram2015 R4, R7, R10.
B F24D F44same mechanismUndissolved HPMCAS in gastric media left the wetted drug to crystallize elkhabaz2019a R16, R20, and as pH fell toward 5.5 HPMCAS released posaconazole poorly while every grade inhibited nucleation longer shah2025 R3, R4, R5.
B F25C F10builds onThe gastric supersaturation ratio of delamanid dispersions rose from ≈0.9–3.8 at pH 1.6 to ≈11–42 at pH 5.0 nguyen2023c R13, because for a weak base the solubility rises with ionization at low pH indulkar2015 R18, F2 (synthesis).
B F25C F23extendsFinal release of delamanid salt dispersions after a gastric stage ranged from about 0 to 101% with gastric pH and grade nguyen2023c R11, whereas for pazopanib the dose relative to the intestinal amorphous solubility decided the outcome sugihara2018 R8, R20; with an undissolved enteric polymer the gastric stage itself changes the solid.
B F25D F44same mechanismAfter pH 5.0 the HPMCAS-MF and -HF delamanid dispersions released only ≈12.5 and 0% nguyen2023c R11, and the high-acetyl HPMCAS grades released posaconazole poorly at pH 5.5–6.5 shah2025 R4, R5.
B F26C F8builds onA posaconazole dispersion dosed at ten times its amorphous solubility held ≈22–24 µg/mL, about that solubility elkhabaz2019a R6, R12, R2, the cap above which extra drug only adds drug-rich phase mosqueragiraldo2015 R10, R12; trasi2015a R2.
B F26C F13extendsBoth doses of the posaconazole dispersion reached the amorphous solubility, but the lower one lost it about an hour sooner elkhabaz2019a R6, R12, so reaching the limit (C F13) indulkar2015 R18; ilevbare2013a R17 is not the same as holding it once crystals are present.
B F26D F20same mechanismCrystals from the acid stage were present at transfer elkhabaz2019a R16, and seeds remove the protection that µg/mL polymer gives a crystal-free solution alonzo2012 R18; duong2022b R13, M2.
B F27D F11builds onAn enteric coat kept gastric medium from the delamanid–HPMCP tablet and prevented the surface crystals of uncoated films at pH 3.0 nguyen2023b R10, R6, where carboxylated polymers lose most of their inhibition ilevbare2012b R7; mosqueragiraldo2016 R7.
B F28C F16builds onDelamanid dispersions released the same in FaSSIF as in buffer although the amorphous solubility was ten times higher (7.93 against 0.76 µg/mL) duong2022a R13, R1; in micellar media the concentration ratio understates the supersaturation and the activity at the amorphous solubility is unchanged indulkar2017a R11, R13; elkhabaz2019b R8, R9, C21.
B F28D F39same mechanismThe authors attribute the loss of praziquantel release in FeSSIF-V2 to its higher bile salt and lecithin content, which "promoted crystallization" alvarenga2025 C29, R16, R18; in solution lecithin and its digestion products shortened induction times in bile salt media indulkar2018 R16, R19; enright2020 R6, R10.
B F28D F42conditions differFasted intestinal fluid changed praziquantel release little alvarenga2025 R12, and in pooled human fasted fluid atazanavir and posaconazole nucleated later than in simulated fluids elkhabaz2021 R6, R7.
B F28D F43conditions differWith HPMCAS or HPMC in the dispersion, FeSSIF-V2 still lowered praziquantel release to about 34–52% at 1.5 mg/mL alvarenga2025 R16, R18, whereas 150 µg/mL HPMCAS-MF made buffer, FaSSIF and two lecithin media alike for telaprevir lu2018 R7, R9.
B F29D F13conditions differHPMCAS-MF and HPMC E5 LV held racemic praziquantel beyond 83 min but R-praziquantel only 37 and 15.5 min polyzois2024 R2, R3, R4; in the solution screen the effective polymer also changed between drugs ilevbare2013c R13, R9.
A F1C F4builds onThe presaturated-medium test dissolves compacts into medium already at the amorphous solubility, 110 µg/mL for nifedipine indulkar2017b R8, R9, R1, a value set by the onset methods compared in the LLPS chapter ilevbare2013a R8, R4, R6; mosqueragiraldo2015 R13.
A F1B F8extendsThe concentration of drug in the medium cannot tell the release regime indulkar2019a R12, R13; indulkar2017b R8, R9, R1, and in situ UV overreads it once submicron particles form alonzo2011 R1, R14; jackson2015 R2, R9; both chapters move to read-outs that the colloid does not distort, the polymer assay and constant area in one, flux, NMR and ultracentrifugation in the other.
A F2B F9explainsCongruent release delivers the drug at the polymer rate, about 4 times amorphous itraconazole and 71 times the crystal for 10% ITZ–PVPVA bhardwaj2018 R4, R6, so the drug passes its amorphous solubility within minutes and the excess forms the colloid seen with ritonavir and danazol dispersions ilevbare2013d R1; jackson2015 R2, R5, R6.
A F2B F10explainsLow-loading dispersions release drug and polymer together at about the polymer's pace (ritonavir–PVPVA 97–100% in 60 min at 10–25%) indulkar2019a R11, R3, R1, which explains why 10% drug dispersions released within minutes and overshot into a colloid alonzo2011 R4, R2, R1.
A F3C F13conditions differFrom 50:50 ritonavir films PVP or PVPVA dissolved while ritonavir reached only ≈18 and ≈9 µg/mL, below its amorphous solubility of about 27 µg/mL purohit2017b R15, R16, R10, R1, whereas neat amorphous films of three weak bases reached 69–110% of the limit indulkar2015 R18, F6.
A F3B F7same mechanismDrug-controlled release stops in medium already at the amorphous solubility and does not pass it indulkar2019a R12; purohit2017b R15, R16, R10, R1, and dispersions that dissolve past it do not raise the free drug above it alonzo2011 R14; jackson2015 R9; trasi2016 R10; from either regime the free drug cannot exceed the amorphous solubility.
A F3B F10explainsAbove the switch the polymer leaves first and the drug dissolves near the neat amorphous rate bhardwaj2018 R4, R11; indulkar2019a R3, R7, which explains the slow release of 50% drug HPMC and PVP dispersions of felodipine and danazol in the supersaturation chapter alonzo2011 R4; jackson2015 C36, R2 (synthesis).
A F4C F1builds onThe droplets released by congruent dispersions are the drug-rich phase that supersaturated solutions form past a drug-specific concentration ilevbare2013a C2, R8; almeidaesousa2015 C41; ritonavir films that formed droplets lowered the pyrene I/III ratio to 1.50–1.66 purohit2017b R10, R11, R7.
A F4C F8builds onNanodroplets formed exactly where the free drug reached the amorphous solubility (27–30 µg/mL for ritonavir) purohit2017b R10, R11, R7, the concentration beyond which free drug, activity and flux stop rising trasi2015a R2, R1; ilevbare2013a R17, R8.
A F4B F8builds onThe link of nanodroplets to congruent release rests on free drug, a probe and particle counting purohit2017b R10, R11, R7; saboo2019 R10, R11, R12, because total concentrations overread above the limit alonzo2011 R1, R14; trasi2015b R6, R7.
A F4B F9builds onThe nanodroplets of 190–370 nm formed only where release stayed polymer-controlled purohit2017b R10, R11, R7; indulkar2019a R9, R20; saboo2019 R10, R11, R12, the colloid that fast-releasing ritonavir and danazol dispersions formed at the LLPS concentration ilevbare2013d R1, R2; jackson2015 R2, R5, R6.
A F5C F1builds onThe deuterium label in the medium was diluted as full mixing predicts indulkar2017b R11, P8, X2, so the droplets formed from dissolved drug by the phase separation of supersaturated solution ilevbare2013a C2, R8.
A F5C F2builds onThe isotope test relied on slow exchange between glassy droplets and solution at 5 °C indulkar2017b R3, R4, X5, a glassy state that follows the water-plasticized Tg of the drug-rich phase against the test temperature ilevbare2013a R5, C23; indulkar2015 R22, M1, M2.
A F5C F9builds onThe isotope test was run at 5 °C indulkar2017b R11, P8, where the limit itself depends on temperature (ritonavir: about 58 µg/mL at 10 °C against about 37 near 35 °C) ilevbare2013a R14, R15.
A F5B F9explainsDroplets of dissolving ritonavir–PVPVA compacts formed at the gel–solution interface and passed into the solution with the polymer yang2022a R6, R10, C50, one origin for the colloid that fast-releasing dispersions put into solution within minutes ilevbare2013d R1; jackson2015 R2, R5, R6.
A F6B F10explainsThe limit of congruency is a narrow switch, ritonavir–PVPVA releasing ≈97% at 25% and at most ≈2% at 35–50% indulkar2019a R11, C2, C31; the loading series of the supersaturation chapter (danazol, celecoxib, indomethacin) show the same fall in release with loading jackson2015 C36, R2; xie2016a R4, R17; xie2017 R10, R13, R14.
A F7B F10explainsAbove the limit the dissolving surface turned drug-rich within minutes (ledipasvir 17 → 54 wt% in 10 min) que2019 R15; saboo2019 R18, the authors' reading of a barrier; a 50:50 HPMC–felodipine particle kept its shape for at least 30 min while a 90:10 one dissipated within 5 min alonzo2011 R4, R2.
A F8C F1same mechanismWater separated ritonavir, ledipasvir and felodipine films into drug-rich domains above the limit indulkar2019a R18; que2019 R14; saboo2020a R23, as supersaturated solutions split into a non-crystalline drug-rich phase ilevbare2013a C2, R8; both are separation of a drug-rich amorphous phase on water uptake (synthesis).
A F9C F2builds onQue and co-workers note that under the test conditions ritonavir (wet Tg about 0 °C) is a supercooled liquid and ledipasvir a glass que2019 M1, R27, R28, C48, C49, the classification of drug-rich phases by water-plasticized Tg against the test temperature ilevbare2013a R5, C23; mosqueragiraldo2015 R2, M1.
A F9C F6conditions differThe limit of congruency did not follow log P saboo2019 R7, C6, C35; que2021 C29, and the maximum supersaturation, amorphous over crystalline solubility, ranged from about 2 to about 600 without a single descriptor almeidaesousa2015 R5, C23.
A F11D F44same mechanismThe polymer choice is a "trade-off" between fast release at low loading and workable release at higher loading saboo2020a C55, and for posaconazole the HPMCAS grade is a trade-off between inhibition and release shah2025 R3, R4, R5.
A F11B F4conditions differHPMCAS and EUDS released felodipine congruently up to 50% but more slowly than PVP and PVPVA at 10% saboo2020a R15, R14; for holding supersaturation HPMCAS led for felodipine, danazol, celecoxib and praziquantel, while PVPVA held delamanid as long as HPMCAS konno2008a R7; jackson2015 R5; xie2015 R1; duong2022a R4.
A F11B F10same mechanismHPMCAS dispersions of loratadine, miconazole and danazol declined gradually with loading instead of falling off a cliff yang2021 R7, R8, R9, R10, C2, and praziquantel–HPMCAS dispersions showed no release cliff up to 40% drug polyzois2024 R8, R9, C17.
A F13C F12conditions differThe SDS gain in limit was not micellar, the medium staying below the CMC que2019 C51, X19, whereas the LLPS chapter's micellar solubilizer raised both solubilities without raising their ratio ilevbare2013a R16, C54.
A F13D F18conditions differAt complete release the ledipasvir medium held at most about 0.05 mg/mL surfactant, below the CMC que2019 C51, X19, the range in which surfactants doubled ritonavir crystal growth and SDS shortened induction times ilevbare2012a R17; chen2015 R3.
A F13B F12same mechanismThe surfactant colloids from ledipasvir dispersions measured about 60 nm with SDS against ≈225–257 nm without que2019 R12, as surfactants kept ritonavir droplets at 178–395 nm ilevbare2013d R12, R14.
A F13B F14contradictsFive parts SDS per 100 raised the ledipasvir–PVPVA limit of congruency from 5 to 30% que2019 R7, R8, R9, C12, while SDS promoted crystallization of celecoxib from HPMCAS particles and of ritonavir droplets chen2015a R14, R12; ilevbare2013d R12; the surfactant helps release and harms the supersaturation it creates.
A F14B F23conditions differAt 20% ITZ–PVPVA the spray-dried compact released 113 and the extruded one 48.8 µg/min/cm² bhardwaj2018 R4, and spray-drying delamanid free base at 25% gave an amorphous dispersion that released more than 80% where rotary-evaporated ones held crystals nguyen2023c R5, R6; duong2022a R8; the route acts through the surface in one case and residual crystals in the other.
A F15B F10extendsThe polymer rate that caps polymer-controlled release changed with the drug and additives, from about 0.22 of the neat rate to about twice it bhardwaj2018 R12; correasoto2022a R18, M1, C30, C48, which adds to the dependence of release speed on loading and polymer alonzo2011 R4; trasi2015b R14.
A F16C F22same mechanismPVPVA droplets from elbasvir and loratadine dispersions grew while HPMCAS droplets stayed small yang2021 R3, R6, and in solvent-shift ibuprofen only HPMC and EUD-E kept most of the drug-rich phase dispersed for 3 h ueda2020b R15, R7.
A F16D F15same mechanismDanazol droplets grew to about 2780 nm even with dissolved HPMCAS in release yang2021 R4, R5, X9, whereas in solution HPMC and HPMC-AS kept danazol droplets at about 230–345 nm for 2–4 h jackson2014 R22, R23.
A F16B F12same mechanismHPMCAS kept elbasvir and loratadine droplets at about 250–570 nm where PVPVA let them grow to 1190–2120 nm yang2021 R3, R6, as HPMCAS and cellulose esters kept ritonavir droplets at 200–350 nm and PVP droplets grew from ≈360 to ≈5590 nm ilevbare2013d R12, R5.
A F17B F18same mechanismHydrogen-bonding drugs had lower limits in PVPVA and carried the polymer into their drug-rich phase saboo2020 R3; que2021 R7, R19; deac2023b R3, R8, and undissolved polymers that interact with lopinavir lowered its maximum concentration below the amorphous solubility, which the authors rationalize by "the extent and strength of drug-polymer interactions" li2018 R3, C68.
A F18C F2builds onCooling below the wet Tg of the drug-rich surface lowered the limit (indomethacin 10 → below 5%, loratadine 30 → 2%) saboo2020 R29, R30, C53; yang2021 R22, M1, the water-plasticized Tg against test temperature that decides whether a drug-rich phase is liquid or glassy ilevbare2013a R5, C23; indulkar2015 R22, M1, M2.
A F18B F23contradictsHigh-Tg drugs failed at 5–10% in PVPVA and heating restored atazanavir release yang2021 R7, R8, C25; correasoto2022b R6, R5, whereas for delamanid sulfonate salts that raised the Tg to 83.7–117.8 °C gave near-complete release at 25% with HPMCP duong2022a R20, R26; there the salt removed residual crystals of a fast crystallizer duong2022a C56, C67.
A F19D F18same mechanismWith 10 parts SDS, 30% ritonavir–PVPVA stopped near 70% with needle crystals on the surface by 15 min yang2023 R2, R16, R17, and below the CMC surfactants doubled ritonavir crystal growth ilevbare2012a R17 (synthesis: no crystallization rate was measured at the dissolving surface).
A F19B F1same mechanismINDester crystallized on its dissolving surface and drug release levelled off while the polymer kept dissolving saboo2020 R8, R9, R22, the crystallization of the wetted solid that removes supersaturation of neat amorphous felodipine, nifedipine and celecoxib alonzo2010 R2; raina2014b R2, R6; xie2015 R4, R8.
A F19B F2same mechanism1000 µg/mL HPMC-606 in the medium did not prevent surface crystallization of INDester compacts saboo2020 R8, R1, M6, C36, C37, as dissolved polymer did not delay crystallization of wetted nifedipine or celecoxib raina2014b C11, R2; xie2015 R9, R10.
A F19B F16same mechanismCrystals on the dissolving surface ended congruent release of INDester saboo2020 R9, R22, and crystallization in PAA and CAP particles left celecoxib and lopinavir dispersions incomplete xie2016a R9, R10; li2018 R7; in both the crystals form in the wetted solid, not in the medium.
A F20B F18conditions differIn water-separated films a continuous drug-rich phase went with loss of release saboo2021 R21, R23; correasoto2022a R20, R21, whereas lopinavir films with CA and EUD, which showed two glass transitions, reached ≈12.8–17.0 µg/mL, closer to the amorphous solubility than one-phase films with HPMCAS, CAP, EC or HPMCP li2018 R3, R8.
A F21C F12conditions differ35 µg/mL TPGS dissolved in the medium did nothing for a 30% felodipine dispersion and the gain was not micellar solubilization saboo2021 R12, R15, whereas a micellar solubilizer in solution raises both solubilities together ilevbare2013a R16, C54.
A F21D F18conditions differTween 80 and SDS raised ritonavir release at 30–40% yang2023 R2, C37, but at 5 µg/mL Tween 80 doubled ritonavir crystal growth and cancelled the cellulose esters ilevbare2012a R17.
A F21D F38conditions differSDS raised the clopidogrel limit from 40 to 50% and atazanavir release with SDS gave a limit of 10% correasoto2022a R17, R18; correasoto2022b R2, R4, and in solution SDS shortened the atazanavir induction time from about 0.075 mg/mL and cut the inhibition by PVPVA indulkar2019b R3, R4.
A F21B F14contradictsA few percent of surfactant inside PVPVA dispersions raised the limit of four drugs saboo2021 R12; correasoto2022a R17; correasoto2022b R2, R4, while SDS and polysorbate 80 promoted crystallization of celecoxib and ritonavir chen2015a R14, R12; ilevbare2013d R12.
A F22B F23contradictsAmorphous salts of lumefantrine raised its Tg to as much as 101 °C but lowered the loading with good release from 35% to 2–15% hiew2022b R2, R20, C53, whereas sulfonate salts of delamanid (Tg 83.7–117.8 °C) raised release at 25% from ≈20 to ≈95–97 µg/mL duong2022a R20, R26, C67; the delamanid free base, a fast crystallizer, had left crystals in its dispersions duong2022a R8, C56.
A F23D F44explainsThe HPMCAS gel was 0.6–1.2 pH units more acidic than the medium and its dissolution rate rose with the gel pH bapat2023 R15, R16, which bears on the poor release of high-acetyl HPMCAS grades at pH 5.5–6.5 shah2025 R4, R5 (synthesis).
A F23B F15same mechanismBuffer capacity and pH set how much enteric polymer dissolves (HP-50 about 0.92 against 0.14 mg/min/cm² in strong and weak phosphate) qi2022 R12, R2, as SDS raised the HPMCAS dissolved from suspended celecoxib particles about 250-fold at pH 3 chen2015a R18; in both the drug follows the polymer.
A F23B F25explainsAt pH 5.0 neat HPMCAS-MF did not dissolve bapat2023 R5, R7, R8, and after a gastric stage at pH 5.0 the HPMCAS-MF and -HF delamanid dispersions released only ≈12.5 and 0% nguyen2023c R11.
A F23B F28conditions differFaSSIF matched its blank buffer for neat HPMCAS-MF and for a 10% indomethacin dispersion bapat2023 R5, R7, and fasted intestinal fluid changed praziquantel release little while FeSSIF-V2 lowered it alvarenga2025 R16, R18, R12.
A F24B F23conditions differSalt formation of the polymer (HP-50 neutralized with sodium or amines) raised miconazole release from about 8.6 to 84–90% qi2022 R14, R15, and salt formation of the drug (delamanid sulfonates formed in the dispersion) raised delamanid release at 25% duong2022a R20, R26; both are salt strategies, on different components.
A F25C F1same mechanismIn the gel of dissolving PVPVA compacts water separated discrete drug-rich droplets of 0.5–2 µm yang2022a R6, R10; deac2023a R6, R7, the phase that supersaturated solutions form past their limit ilevbare2013a C2, R8 (synthesis: in the gel it forms in a drug–polymer–water mixture rather than in dilute solution).
A F25C F2builds onThe drug-rich layer at 40% ritonavir was rigid and at 30% porous yang2022a R6, R10, R11, R12, R13; the drug-rich phase of ritonavir is a water-plasticized supercooled liquid at 37 °C ilevbare2013a R5, C23.
A F26C F2builds onLipophilic plasticizers raised the limit of the high-Tg drugs atazanavir and ledipasvir three- to fivefold but that of ritonavir only to 30% correasoto2023 R1, R11, R14, R16, the drug whose drug-rich phase is already a supercooled liquid at 37 °C ilevbare2013a R5, C23.
A F26B F23contradictsLowering the Tg of high-Tg drugs with plasticizers raised their limit of congruency correasoto2023 R1, R17, whereas raising the Tg of delamanid by salt formation raised its release duong2022a R20, R26; the two act through different failures, slow mobility at the surface against residual crystals (synthesis).
A F27C F19same mechanismPVPVA lowered the amorphous solubility of phenolphthalein from 200 to 27.5 µg/mL by entering its drug-rich phase deac2023b R1, R3, as HPMC and PVP-VA lowered that of ibuprofen ueda2020b R1, C33.
A F27C F20extendsThe PVPVA content of drug-rich nanoparticles ran from about 77 to 5 wt% across four phenolphthalein analogues in the reverse order of their limits of congruency deac2023b R3, R8, beside polymer:drug ratios of 0.40–1.14 in ibuprofen drug-rich phases ueda2021 R5.
A F27C F21builds onThe phenolphthalein partitioning was measured at 60 °C and by two routes deac2023b R3, R8, and polymer transfer into the ibuprofen-rich phase is endothermic and entropy-driven, so more polymer enters as temperature rises ueda2022 R10, R22, R23, C48.
A F28B F10extendsGrazoprevir–HPMCAS dispersions declined gradually with loading (about 102% at 5% to 27–30% at 50–75%) hiew2023 R8, C18, like other HPMCAS loading series xie2016a R4, R17; polyzois2024 R8, R9, and at high loading the surface drug content, not the bulk, separated good from poor release hiew2023 R14.
A F29C F22same mechanismWith short PVP chains clotrimazole droplets clustered into strands in the gel deac2024a R7, R10, and in solution the polymer type decided how long ibuprofen droplets stayed dispersed ueda2020b R15, R7.
A F29B F12same mechanismClotrimazole droplets grew at the same relative rate with PVP K12 or K29/32 in solution deac2024a R5, R10, and PVP droplets from dissolving ritonavir dispersions grew from ≈360 to ≈5590 nm in 120 min ilevbare2013d R5.
A F30C F19same mechanismPVPVA made up 41.9–52.2 wt% of the phenolphthalein-rich phase in measured drug–PVPVA–water diagrams deac2024b R15, R17, the polymer uptake into a drug-rich phase that lowers the amorphous solubility of ibuprofen ueda2020b R1, R13.
A F30C F20extendsPC-SAFT diagrams put the critical point at about 33% loading for MePHPH and 3.7% for PHPH deac2024b R22, R23, R35; in solution the share of polymer in the drug-rich phase depended on its chemistry and amount ueda2021 R5, R10.
A F31D F38conditions differSDS raised the water needed to separate 30% ritonavir films from 14.0 to 24.5% and kept the 40% gel in one phase yang2023 R21, R13, while in solution SDS shortened the atazanavir induction time below its CMC indulkar2019b R3.
A F31B F14same mechanismSDS in 30% ritonavir–PVPVA compacts brought needle crystals to the dissolving surface and release stopped at about 30 min yang2023 R16, C24, and SDS promoted crystallization of ritonavir droplets ilevbare2013d R12.
A F32C F10builds onLipophilic weak bases ionized at the gel pH complexed HPMCAS and released poorly bapat2024 R12, R5; kaur2025 R5, R13, ionization that also raises the total amorphous solubility of weak bases as pH falls indulkar2015 R18, F2.
A F32D F44conditions differWeak bases took up to 70–96% of HPMCAS out of solution at pH 6.0 bapat2024 R12; kaur2025 R5, and with posaconazole the HPMCAS grade that entered its droplets most (about 31 wt%) inhibited nucleation best shah2025 R17, R3.
A F33D F44same mechanismFor loratadine and cinnarizine the grade ranked release LF > MF > HF in the order of acid groups per gram bapat2025a R2, R3, M3, M4, M5, and for posaconazole the HF grade released only about 5 µg/mL at pH 5.5 while inhibiting nucleation longest shah2025 R3, R4, R5.
A F33B F25same mechanismAt pH 6.5 alone 25% delamanid salt dispersions released ≈88% (LF), ≈57.5% (MF) and ≈0% (HF) nguyen2023c R11, the grade order LF > MF > HF of loratadine and cinnarizine bapat2025a R2, R3.
A F34C F12conditions differThe authors read the bedaquiline gain as drug binding to micelles in FaSSIF-V1, micellar solubilization and complex disruption not being separated kaur2025 C39, C49, C50, X13; in the LLPS chapter micelles raise both solubilities together ilevbare2013a R16, C54; lu2017b R1, R2.
A F34B F28conditions differFaSSIF-V1 and FeSSIF-V2 raised bedaquiline release from about 17–30% to 80–97% by suppressing complexation kaur2025 R13, R15, R17, R5, whereas delamanid dispersions released the same in FaSSIF as in buffer and fed fluid lowered praziquantel release duong2022a R13, R1; alvarenga2025 R16, R18.
A F35B F10extendsAt 75% grazoprevir, wettable particles (FaSSIF contact angle 0–52°) released about 37–52% and poorly wettable ones 8–20% hiew2025 R15, R17, an added lever at loadings where HPMCAS dispersions release slowly xie2016a R4, R17; elkhabaz2019a R8, C44.
For the authors: coverage table

Every chapter finding is used in a category finding or in links.md, or is listed as standing alone.

chapterfindings used in a category finding or in links.mdfindings that stand alone
C. Amorphous solubility and LLPSF1–F23 (23 of 23)none
D. Crystallization from solutionF1–F11, F13–F44 (43 of 44)F12 (crystal habit of ritonavir with polymers)
B. Supersaturation from ASD dissolutionF1–F29 (29 of 29)none
A. Release mechanism and LoCF1–F35 (35 of 35)none

Sources: Dissolution

Every paper cited in the category pages findings.md, links.md and index.md of the category Dissolution, with its row taken from the source tables of the four chapters. Keys are first-author surname plus year; a, b, c, d separate papers of the same author and year, as assigned in synthesis/citation_keys.csv and the chapter source tables. The first rows are the papers of the four chapters in chapter order (C. Amorphous solubility and LLPS, D. Crystallization from solution, B. Supersaturation from ASD dissolution, A. Release mechanism and LoC), each in year order, then the papers of other categories that the chapter findings cite, in year order.

keyyeartitleslugcategory / subcategory
ilevbare2013a2013Liquid-Liquid Phase Separation in Highly Supersaturated Aqueous Solutions of Poorly-Water Soluble Drugs – Implications for Solubility Enhancing Formulations2013-ilevbare-llps-supersaturated-poorly-water-soluble-drugsDissolution / C. Amorphous solubility and LLPS
almeidaesousa20152015Assessment of the Amorphous “Solubility” of a Group of Diverse Drugs Using New Experimental and Theoretical Approaches2015-almeida-sousa-amorphous-solubility-diverse-drugs-llps-cp-methodDissolution / C. Amorphous solubility and LLPS
indulkar20152015pH-Dependent Liquid−Liquid Phase Separation of Highly Supersaturated Solutions of Weakly Basic Drugs2015-indulkar-ph-dependent-llps-weak-bases-amorphous-solubilityDissolution / C. Amorphous solubility and LLPS
mosqueragiraldo20152015Glass–Liquid Phase Separation in Highly Supersaturated Aqueous Solutions of Telaprevir2015-mosquera-giraldo-telaprevir-glass-liquid-phase-separationDissolution / C. Amorphous solubility and LLPS
trasi2015a2015Thermodynamics of Highly Supersaturated Aqueous Solutions of Poorly Water-Soluble Drugs—Impact of a Second Drug on the Solution Phase Behavior and Implications for Combination Products2015-trasi-second-drug-supersaturated-solutions-drug-rich-phaseDissolution / C. Amorphous solubility and LLPS
almeidaesousa20162016Supersaturation Potential of Salt, Co-Crystal, and Amorphous Forms of a Model Weak Base2016-almeida-sousa-supersaturation-salt-cocrystal-amorphous-weak-baseDissolution / C. Amorphous solubility and LLPS
indulkar2017a2017Impact of Micellar Surfactant on Supersaturation and Insight into Solubilization Mechanisms in Supersaturated Solutions of Atazanavir2017-indulkar-micellar-surfactant-supersaturation-atazanavir-sdsDissolution / C. Amorphous solubility and LLPS
lu2017b2017Impact of Endogenous Bile Salts on the Thermodynamics of Supersaturated Active Pharmaceutical Ingredient Solutions2017-lu-endogenous-bile-salts-telaprevir-supersaturation-thermodynamicsDissolution / C. Amorphous solubility and LLPS
sugihara20182018Evaluation of Pazopanib Phase Behavior Following pH-induced Supersaturation2018-sugihara-pazopanib-ph-induced-supersaturation-phase-behaviorDissolution / C. Amorphous solubility and LLPS
ueda2020b2020Polymer type impacts amorphous solubility and drug-rich phase colloidal stability: A mechanistic study using nuclear magnetic resonance spectroscopy2020-ueda-polymer-type-amorphous-solubility-drug-rich-phase-colloidal-stabilityDissolution / C. Amorphous solubility and LLPS
ueda20212021Effect of Polymer Species on Maximum Aqueous Phase Supersaturation Revealed by Quantitative Nuclear Magnetic Resonance Spectroscopy2021-ueda-polymer-species-maximum-aqueous-supersaturation-nmrDissolution / C. Amorphous solubility and LLPS
ueda20222022Variable-Temperature NMR Analysis of the Thermodynamics of Polymer Partitioning between Aqueous and Drug-Rich Phases and Its Significance for Amorphous Formulations2022-ueda-polymer-partitioning-ibuprofen-drug-rich-phase-nmrDissolution / C. Amorphous solubility and LLPS
hsieh20122012pH-Induced Precipitation Behavior of Weakly Basic Compounds: Determination of Extent and Duration of Supersaturation Using Potentiometric Titration and Correlation to Solid State Properties2012-hsieh-ph-induced-precipitation-weak-bases-supersaturation-solid-stateDissolution / D. Crystallization from solution
alonzo20122012Characterizing the Impact of Hydroxypropylmethyl Cellulose on the Growth and Nucleation Kinetics of Felodipine from Supersaturated Solutions2012-alonzo-hpmc-felodipine-growth-nucleation-supersaturationDissolution / D. Crystallization from solution
ilevbare2012a2012Effect of Binary Additive Combinations on Solution Crystal Growth of the Poorly Water-Soluble Drug, Ritonavir2012-ilevbare-ritonavir-binary-additive-crystal-growthDissolution / D. Crystallization from solution
ilevbare2012b2012Inhibition of solution crystal growth of ritonavir by cellulose polymers – factors influencing polymer effectiveness2012-ilevbare-ritonavir-cellulose-polymers-supersaturation-growthDissolution / D. Crystallization from solution
ilevbare2012c2012Understanding Polymer Properties Important for Crystal Growth Inhibition—Impact of Chemically Diverse Polymers on Solution Crystal Growth of Ritonavir2012-ilevbare-ritonavir-polymer-properties-crystal-growth-inhibitionDissolution / D. Crystallization from solution
ilevbare2013b2013Impact of Polymers on Crystal Growth Rate of Structurally Diverse Compounds from Aqueous Solution2013-ilevbare-polymers-crystal-growth-structurally-diverse-compoundsDissolution / D. Crystallization from solution
ilevbare2013c2013Maintaining Supersaturation in Aqueous Drug Solutions: Impact of Different Polymers on Induction Times2013-ilevbare-polymers-supersaturation-induction-timesDissolution / D. Crystallization from solution
hsieh20142014Assessing the Impact of Polymers on the pH-Induced Precipitation Behavior of Poorly Water-Soluble Compounds using Synchrotron Wide Angle X-Ray Scattering2014-hsieh-polymers-ph-induced-precipitation-waxsDissolution / D. Crystallization from solution
jackson20142014Impact of Polymers on the Precipitation Behavior of Highly Supersaturated Aqueous Danazol Solutions2014-jackson-polymers-precipitation-supersaturated-danazolDissolution / D. Crystallization from solution
chen20152015Bile Salts as Crystallization Inhibitors of Supersaturated Solutions of Poorly Water-Soluble Compounds2015-chen-bile-salts-crystallization-inhibitors-supersaturated-solutionsDissolution / D. Crystallization from solution
raina2015b2015Trends in the Precipitation and Crystallization Behavior of Supersaturated Aqueous Solutions of Poorly Water-Soluble Drugs Assessed Using Synchrotron Radiation2015-raina-precipitation-crystallization-supersaturated-dihydropyridines-synchrotronDissolution / D. Crystallization from solution
schram20152015Impact of Polymer Conformation on the Crystal Growth Inhibition of a Poorly Water-Soluble Drug in Aqueous Solution2015-schram-hpmcas-conformation-felodipine-crystal-growth-inhibitionDissolution / D. Crystallization from solution
trasi20152015Evaluating the influence of polymers on nucleation and growth in supersaturated solutions of acetaminophen2015-trasi-polymers-nucleation-growth-supersaturated-acetaminophenDissolution / D. Crystallization from solution
jackson20162016Characterization of Supersaturated Danazol Solutions – Impact of Polymers on Solution Properties and Phase Transitions2016-jackson-supersaturated-danazol-polymer-phase-transitionsDissolution / D. Crystallization from solution
li2016a2016A Comparison of the Crystallization Inhibition Properties of Bile Salts2016-li-crystallization-inhibition-properties-bile-saltsDissolution / D. Crystallization from solution
mosqueragiraldo20162016Mechanistic Design of Chemically Diverse Polymers with Applications in Oral Drug Delivery2016-mosquera-giraldo-chemically-diverse-cellulose-polymers-telaprevir-crystallizationDissolution / D. Crystallization from solution
schram20162016Polymer Inhibition of Crystal Growth by Surface Poisoning2016-schram-polymer-inhibition-crystal-growth-surface-poisoningDissolution / D. Crystallization from solution
lu20172017Maintaining Supersaturation of Active Pharmaceutical Ingredient Solutions with Biologically Relevant Bile Salts2017-lu-bile-salts-telaprevir-supersaturationDissolution / D. Crystallization from solution
lu2017a2017Impact of Bile Salts on Solution Crystal Growth Rate and Residual Supersaturation of an Active Pharmaceutical Ingredient2017-lu-bile-salts-telaprevir-crystal-growth-residual-supersaturationDissolution / D. Crystallization from solution
indulkar20182018Crystallization from Supersaturated Solutions: Role of Lecithin and Composite Simulated Intestinal Fluid2018-indulkar-lecithin-composite-sif-crystallization-supersaturationDissolution / D. Crystallization from solution
lu20182018Compositional Effect of Complex Biorelevant Media on the Crystallization Kinetics of an Active Pharmaceutical Ingredient2018-lu-biorelevant-media-telaprevir-crystallization-kineticsDissolution / D. Crystallization from solution
mosqueragiraldo2018a2018Crystallization Inhibition Properties of Cellulose Esters and Ethers for a Group of Chemically Diverse Drugs - Experimental and Computational Insight2018-mosquera-giraldo-cellulose-esters-ethers-crystallization-inhibition-computational-insightDissolution / D. Crystallization from solution
indulkar2019b2019Impact of monomeric vs. micellar surfactant and surfactant-polymer interactions on nucleation-induction times of atazanavir from supersaturated solutions2019-indulkar-sds-polymer-hemimicelle-atazanavir-nucleationDissolution / D. Crystallization from solution
enright20202020Impact of phospholipid digests and bile acid pool variations on the crystallization of atazanavir from supersaturated solutions2020-enright-phospholipid-digests-bile-acid-pool-atazanavir-crystallizationDissolution / D. Crystallization from solution
wilson20212021Interaction of Polymers with Enzalutamide Nanodroplets—Impact on Droplet Properties and Induction Times2021-wilson-enzalutamide-nanodroplets-polymer-interactions-induction-timesDissolution / D. Crystallization from solution
elkhabaz20212021Crystallization Kinetics in Fasted-State Simulated and Aspirated Human Intestinal Fluids2021-elkhabaz-crystallization-kinetics-fasted-simulated-aspirated-human-intestinal-fluidsDissolution / D. Crystallization from solution
duong2022b2022Phase Behavior and Crystallization Kinetics of a Poorly Water-Soluble Weakly Basic Drug as a Function of Supersaturation and Media Composition2022-duong-posaconazole-phase-behavior-crystallization-kinetics-mediaDissolution / D. Crystallization from solution
shah20252025Chemistry and ionization of HPMCAS influences the dissolution and solution-mediated crystallization of posaconazole amorphous solid dispersions2025-shah-hpmcas-ionization-posaconazole-asd-crystallizationDissolution / D. Crystallization from solution
konno2008a2008Effect of polymer type on the dissolution profile of amorphous solid dispersions containing felodipine2008-konno-polymer-type-felodipine-asd-dissolutionDissolution / B. Supersaturation from ASD dissolution
alonzo20102010Understanding the Behavior of Amorphous Pharmaceutical Systems during Dissolution2010-alonzo-amorphous-pharmaceutical-dissolution-crystallization-polymersDissolution / B. Supersaturation from ASD dissolution
alonzo20112011Dissolution and Precipitation Behavior of Amorphous Solid Dispersions2011-alonzo-asd-dissolution-precipitation-nanoparticlesDissolution / B. Supersaturation from ASD dissolution
ilevbare2013d2013Influence of Additives on the Properties of Nanodroplets Formed in Highly Supersaturated Aqueous Solutions of Ritonavir2013-ilevbare-ritonavir-nanodroplets-additives-asd-llpsDissolution / B. Supersaturation from ASD dissolution
raina2014b2014Impact of Polymers on the Crystallization and Phase Transition Kinetics of Amorphous Nifedipine during Dissolution in Aqueous Media2014-raina-polymers-nifedipine-crystallization-phase-transition-dissolutionDissolution / B. Supersaturation from ASD dissolution
jackson20152015Dissolution of Danazol Amorphous Solid Dispersions: Supersaturation and Phase Behavior as a Function of Drug Loading and Polymer Type2015-jackson-danazol-asd-dissolution-llps-drug-loading-polymer-typeDissolution / B. Supersaturation from ASD dissolution
trasi2015b2015Dissolution performance of binary amorphous drug combinations—Impact of a second drug on the maximum achievable supersaturation2015-trasi-taylor-binary-amorphous-drug-combinations-supersaturationDissolution / B. Supersaturation from ASD dissolution
xie20152015Dissolution Performance of High Drug Loading Celecoxib Amorphous Solid Dispersions Formulated with Polymer Combinations2015-xie-taylor-celecoxib-high-drug-loading-asd-polymer-combinationsDissolution / B. Supersaturation from ASD dissolution
chen2015a2015Impact of Surfactants on the Crystallization of Aqueous Suspensions of Celecoxib Amorphous Solid Dispersion Spray Dried Particles2015-chen-surfactants-crystallization-celecoxib-hpmcas-asd-suspensionsDissolution / B. Supersaturation from ASD dissolution
wegiel20152015Phase Behavior of Resveratrol Solid Dispersions Upon Addition to Aqueous media2015-wegiel-resveratrol-solid-dispersions-aqueous-phase-behaviorDissolution / B. Supersaturation from ASD dissolution
trasi20162016Non-Sink Dissolution Behavior and Solubility Limit of Commercial Tacrolimus Amorphous Formulations2016-trasi-commercial-tacrolimus-asd-nonsink-amorphous-solubilityDissolution / B. Supersaturation from ASD dissolution
xie2016a2016Improved Release of Celecoxib from High Drug Loading Amorphous Solid Dispersions Formulated with Polyacrylic Acid and Cellulose Derivatives2016-xie-celecoxib-high-drug-loading-asd-paa-cellulose-derivativesDissolution / B. Supersaturation from ASD dissolution
li2016b2016Leaching of Lopinavir Amorphous Solid Dispersions in Acidic Media2016-li-lopinavir-asd-leaching-acidic-mediaDissolution / B. Supersaturation from ASD dissolution
xie20172017Impact of Eudragit EPO and Hydroxypropyl Methylcellulose on Drug Release Rate, Supersaturation, Precipitation Outcome and Redissolution Rate of Indomethacin Amorphous Solid Dispersions2017-xie-eudragit-epo-hpmc-indomethacin-asd-supersaturation-redissolutionDissolution / B. Supersaturation from ASD dissolution
li20182018Tailoring supersaturation from amorphous solid dispersions2018-li-tailoring-supersaturation-lopinavir-insoluble-polymer-asdDissolution / B. Supersaturation from ASD dissolution
que20182018Paclitaxel Crystal Seeds with Different Intrinsic Properties and Their Impact on Dissolution of Paclitaxel-HPMCAS Amorphous Solid Dispersions2018-que-paclitaxel-crystal-seeds-hpmcas-asd-dissolutionDissolution / B. Supersaturation from ASD dissolution
elkhabaz2019a2019Characterization of Phase Transformations for Amorphous Solid Dispersions of a Weakly Basic Drug upon Dissolution in Biorelevant Media2019-elkhabaz-posaconazole-asd-phase-transformations-biorelevant-mediaDissolution / B. Supersaturation from ASD dissolution
duong2022a2022Combining enabling formulation strategies to generate supersaturated solutions of delamanid: In situ salt formation during amorphous solid dispersion fabrication for more robust release profiles2022-duong-delamanid-in-situ-salt-asd-releaseDissolution / B. Supersaturation from ASD dissolution
nguyen2023b2023Enteric coating of tablets containing an amorphous solid dispersion of an enteric polymer and a weakly basic drug: A strategy to enhance in vitro release2023-nguyen-enteric-coating-delamanid-hpmcp-asd-releaseDissolution / B. Supersaturation from ASD dissolution
nguyen2023c2023Impact of Gastric pH Variations on the Release of Amorphous Solid Dispersion Formulations Containing a Weakly Basic Drug and Enteric Polymers2023-nguyen-gastric-ph-variations-delamanid-enteric-polymer-asdDissolution / B. Supersaturation from ASD dissolution
polyzois20242024Amorphous Solid Dispersion Formation for Enhanced Release Performance of Racemic and Enantiopure Praziquantel2024-polyzois-praziquantel-racemic-enantiopure-asd-releaseDissolution / B. Supersaturation from ASD dissolution
alvarenga20252025Release performance and crystallization of racemic and enantiopure praziquantel amorphous solid dispersion in various media2025-alvarenga-praziquantel-racemic-enantiopure-asd-release-crystallization-mediaDissolution / B. Supersaturation from ASD dissolution
purohit2017b2017Phase Behavior of Ritonavir Amorphous Solid Dispersions during Hydration and Dissolution2017-purohit-ritonavir-asd-hydration-dissolution-phase-behaviorDissolution / A. Release mechanism and LoC
indulkar2017b2017Origin of Nanodroplet Formation upon Dissolution of an Amorphous Solid Dispersion: A Mechanistic Isotope Scrambling Study2017-indulkar-origin-nanodroplet-formation-asd-isotope-scramblingDissolution / A. Release mechanism and LoC
bhardwaj20182018Surface area normalized dissolution to study differences in itraconazole-copovidone solid dispersions prepared by spray-drying and hot melt extrusion2018-bhardwaj-surface-area-normalized-dissolution-itraconazole-pvpva-asdDissolution / A. Release mechanism and LoC
indulkar2019a2019Insights into the dissolution mechanism of ritonavir-copovidone amorphous solid dispersions: importance of congruent release for enhanced performance2019-indulkar-ritonavir-copovidone-asd-congruent-release-locDissolution / A. Release mechanism and LoC
que20192019Insights into the Dissolution Behavior of Ledipasvir-Copovidone Amorphous Solid Dispersions: Role of Drug Loading and Intermolecular Interactions2019-que-ledipasvir-copovidone-asd-loc-interactionsDissolution / A. Release mechanism and LoC
saboo20192019Congruent release of drug and polymer: A “sweet spot” in the dissolution of amorphous solid dispersions2019-saboo-congruent-drug-polymer-release-asd-sweet-spotDissolution / A. Release mechanism and LoC
saboo2020a2020Patterns of drug release as a function of drug loading from amorphous solid dispersions: A comparison of five different polymers.2020-saboo-asd-drug-loading-polymer-hydrophobicity-releaseDissolution / A. Release mechanism and LoC
saboo20202020Congruent release of drug and polymer from amorphous solid dispersions: insights into the role of drug-polymer hydrogen bonding, surface crystallization and glass transition2020-saboo-congruent-release-hbond-crystallization-tg-pvpva-asdDissolution / A. Release mechanism and LoC
yang20212021Drug Release and Nanodroplet Formation from Amorphous Solid Dispersions: Insight into the Roles of Drug Physicochemical Properties and Polymer Selection2021-yang-asd-nanodroplet-release-drug-properties-polymer-selectionDissolution / A. Release mechanism and LoC
saboo20212021Exploring the Role of Surfactants in Enhancing Drug Release from Amorphous Solid Dispersions at Higher Drug Loadings2021-saboo-tpgs-felodipine-pvpva-asd-release-high-loadingDissolution / A. Release mechanism and LoC
que20212021Impact of Drug−Polymer Intermolecular Interactions on Dissolution Performance of Copovidone-Based Amorphous Solid Dispersions2021-que-drug-polymer-interactions-loc-copovidone-asdDissolution / A. Release mechanism and LoC
correasoto2022a2022Impact of Surfactants on the Performance of Clopidogrel-Copovidone Amorphous Solid Dispersions: Increased Drug Loading and Stabilization of Nanodroplets2022-correa-soto-surfactants-clopidogrel-copovidone-asd-nanodropletsDissolution / A. Release mechanism and LoC
indulkar20222022Role of Surfactants on Release Performance of Amorphous Solid Dispersions of Ritonavir and Copovidone2022-indulkar-surfactants-ritonavir-copovidone-asd-release-performanceDissolution / A. Release mechanism and LoC
hiew2022b2022Combining drug salt formation with amorphous solid dispersions – a double edged sword2022-hiew-combining-drug-salt-formation-asd-double-edged-swordDissolution / A. Release mechanism and LoC
correasoto2022b2022Role of surfactants in improving release from higher drug loading amorphous solid dispersions2022-correa-soto-surfactants-higher-drug-loading-atazanavir-pvpva-asdsDissolution / A. Release mechanism and LoC
qi20222022Improved dissolution of an enteric polymer and its amorphous solid dispersions by polymer salt formation2022-qi-enteric-polymer-salt-hp50-miconazole-asd-dissolutionDissolution / A. Release mechanism and LoC
yang2022a2022Release mechanisms of amorphous solid dispersions: Role of drug-polymer phase separation and morphology2022-yang-release-mechanisms-rtv-pvpva-asd-phase-separation-morphologyDissolution / A. Release mechanism and LoC
deac2023b2023Dissolution Mechanisms of Amorphous Solid Dispersions: Role of Drug Load and Molecular Interactions2023-deac-asd-drug-load-molecular-interactions-locDissolution / A. Release mechanism and LoC
yang20232023Drug Release from Surfactant-Containing Amorphous Solid Dispersions: Mechanism and Role of Surfactant in Release Enhancement2023-yang-surfactant-containing-asd-release-enhancementDissolution / A. Release mechanism and LoC
bapat20232023Does Media Choice Matter When Evaluating the Performance of Hydroxypropyl Methylcellulose Acetate Succinate-Based Amorphous Solid Dispersions?2023-bapat-hpmcas-asd-media-choice-buffer-capacity-releaseDissolution / A. Release mechanism and LoC
correasoto20232023Release Enhancement by Plasticizer Inclusion for Amorphous Solid Dispersions Containing High Tg Drugs2023-correa-soto-plasticizer-release-enhancement-high-tg-pvpva-asdsDissolution / A. Release mechanism and LoC
deac2023a2023Dissolution Mechanisms of Amorphous Solid Dispersions: A Close Look at the Dissolution Interface2023-deac-asd-dissolution-interfaceDissolution / A. Release mechanism and LoC
hiew20232023Improving Dissolution Performance and Drug Loading of Amorphous Dispersions Through a Hierarchical Particle Approach2023-hiew-grazoprevir-hierarchical-cpad-surface-drug-releaseDissolution / A. Release mechanism and LoC
bapat20242024Interplay of Drug−Polymer Interactions and Release Performance for HPMCAS-Based Amorphous Solid Dispersions2024-bapat-hpmcas-drug-polymer-complexation-release-performanceDissolution / A. Release mechanism and LoC
deac2024a2024Dissolution mechanisms of amorphous solid dispersions: Role of polymer molecular weight and identification of a new failure mode2024-deac-asd-polymer-molecular-weight-failure-mode-locDissolution / A. Release mechanism and LoC
deac2024b2024Dissolution Mechanisms of Amorphous Solid Dispersions: Application of Ternary Phase Diagrams To Explain Release Behavior2024-deac-asd-ternary-phase-diagrams-releaseDissolution / A. Release mechanism and LoC
hiew20252025The importance of surface composition and wettability on the dissolution performance of high drug loading amorphous dispersion formulations2025-hiew-surface-composition-wettability-high-drug-loading-asdDissolution / A. Release mechanism and LoC
kaur20252025Impact of drug-polymer complexation and media properties on the release performance of amorphous solid dispersions containing a weakly basic drug and hydroxypropyl methylcellulose acetate succinate2025-kaur-bdq-hpmcas-complexation-media-asd-releaseDissolution / A. Release mechanism and LoC
bapat2025a2025Impact of HPMCAS Grade on the Release of Weakly Basic Drugs from Amorphous Solid Dispersions2025-bapat-hpmcas-grade-weak-base-asd-release-complexationDissolution / A. Release mechanism and LoC
rumondor2010c2010Effect of Polymer Hygroscopicity on the Phase Behavior of Amorphous Solid Dispersions in the Presence of Moisture2010-rumondor-polymer-hygroscopicity-moisture-phase-separation-asdSolid state stability / Physical stability
trasi20172017Evaluation of the Crystallization Tendency of Commercially Available Amorphous Tacrolimus Formulations Exposed to Different Stress Conditions2017-trasi-commercial-amorphous-tacrolimus-crystallization-stressSolid state stability / Physical stability
purohit20182018Investigating the impact of drug crystallinity in amorphous tacrolimus capsules on pharmacokinetics and bioequivalence using discriminatory in vitro dissolution testing and PBPK modeling and simulation2018-purohit-tacrolimus-crystallinity-dissolution-pbpk-bioequivalenceBioperformance / Bioperformance
elkhabaz2019b2019Interplay of supersaturation and solubilization: Lack of correlation between concentration-based supersaturation measurements and membrane transport rates in simulated and aspirated human fluids2019-elkhabaz-supersaturation-solubilization-activity-flux-biorelevant-mediaBioperformance / Bioperformance
hate20192019Absorptive dissolution testing: An improved approach to study the impact of residual crystallinity on the performance of amorphous formulations2019-hate-absorptive-dissolution-residual-crystallinity-amorphous-formulationsBioperformance / Bioperformance
purohit20192019Assessing the impact of endogenously derived crystalline drug on the in vivo performance of amorphous formulations2019-purohit-endogenous-crystallinity-in-vivo-amorphous-tacrolimusBioperformance / Bioperformance
trasi20192019Amorphous solid dispersion formation via solvent granulation – A case study with ritonavir and lopinavir2019-trasi-solvent-granulation-ritonavir-lopinavir-asdASD process / ASD process
li20202020Water-induced phase separation of spray dried amorphous solid dispersions2020-li-water-induced-phase-separation-spray-dried-asd-ritonavir-pvpvaASD process / ASD process
moseson2020a2020Amorphous Solid Dispersions Containing Residual Crystallinity: Influence of Seed Properties and Polymer Adsorption on Dissolution Performance2020-moseson-residual-crystallinity-seed-properties-polymer-adsorptionASD process / ASD process
que20202020Evidence for Halogen Bonding in Amorphous Solid Dispersions2020-que-halogen-bonding-amorphous-solid-dispersionsSolid state stability / Miscibility and drug-polymer interactions
moseson20212021Amorphous Solid Dispersions Containing Residual Crystallinity: Competition Between Dissolution and Matrix Crystallization2021-moseson-residual-crystallinity-dissolution-matrix-crystallizationASD process / ASD process
hiew2022a2022Balancing Solid-State Stability and Dissolution Performance of Lumefantrine Amorphous Solid Dispersions: The Role of Polymer Choice and Drug−Polymer Interactions2022-hiew-lumefantrine-asd-stability-dissolution-polymer-choiceSolid state stability / Miscibility and drug-polymer interactions
shah20242024Orthogonal Analytical Methods to Elucidate How Low Levels of Residual Crystallinity in Posaconazole Amorphous Solid Dispersions Impact Phase Behavior during Release2024-shah-posaconazole-asd-residual-crystallinity-release-phase-behaviorASD process / ASD process
bapat2025b2025Modification of Peptide and Permeation Enhancer In Vitro Release Rates by Dispersion with a Gel-Forming Polymer2025-bapat-peptide-permeation-enhancer-pvpva-synchronous-releasePeptide permeability / Peptide permeability
benson20252025Dissolution of copovidone-based amorphous solid dispersions: Influence of atomic layer coating, hydration kinetics, and formulation2025-benson-alc-coated-rtv-pvpva-asd-hydration-releaseASD process / ASD process
← Concepts and formulas

concept · as used in Dissolution

absorptive sink

A membrane compartment that removes dissolved drug from the dissolution medium while dissolution and phase change go on, as the intestinal wall does in vivo; the test that couples a dissolving donor to such a compartment is called absorptive dissolution testing hate2019 C9, C31, P4. The sink changes concentration–time profiles: it lowers the supersaturation reached in the donor and so the driving force for crystal growth on residual seeds hate2019 C15, C35. In vivo, absorption keeps depleting the lumen after gastric emptying and may lower the driving force for secondary nucleation and growth, and may let a crystalline fraction dissolve once luminal concentrations fall low enough purohit2019 C41. It differs from a sink in the compendial sense, where the medium is large enough to dissolve the dose (sink conditions).

Findings

F14, F28, F29.

Related concepts

contrasts with sink conditions and non-sink dissolution; acts on desupersaturation and crystal seeding; measured with the membrane mass transfer coefficient.

Formulas

hollow-fibre donor depletion, power-law crystal growth rate, mass transferred from receiver AUC.

How it is measured or obtained

A cellulosic hollow-fibre module (100 cm² and 15 nm pores in the tacrolimus study) fed from the dissolution vessel, donor and receiver pumped co-currently at 2 mL/min, receiver read by in-line UV and donor by HPLC; total dissolved drug in donor plus receiver follows crystallization hate2019 P4, P8, C19. Receiver AUC and a test-to-reference ratio with 80–125% limits summarize the result hate2019 P9, E6. The module is described as having 115 cm² of membrane in the nevirapine study [hate2017 M10].

Values in the library
materialvalue or classconditionspaper ids
tacrolimus generic capsule, freshreceiver AUC0–120 about 362, 682 and 992 µg/mL·min in 240, 100 and 40 mLhollow fibre, 37 °Chate2019 R12, C24
tacrolimus crystalline suspensionAUC about 87 µg/mL·min at every volumesamehate2019 R12
tacrolimus generic, freshdid not crystallize at 240, 100 or 40 mL, unlike in an earlier closed vesselsamehate2019 R11, C35
tacrolimus generic, 20% crystallineat 40 mL only: total dissolved drug fell from about 2.35 to 1.9 mg after 60 min5 mg in 40 mLhate2019 R11, C20
nevirapine tablet donorabout 253 µg/mL after 270 min with absorption against about 525 in a closed vessel0.05% HPMC-AS[hate2017 R15, R7]
atazanavir 50% ASDstotal release at 120 min 6200, 6300, 5000 µg with absorption against 4200, 4600, 3600 closed (HPMCAS, HPMC, PVPVA)200 µg/mL dose[hate2018 R18]
Pitfalls and disagreements

The absorption rate is a property of the apparatus: a closed vessel may overstate crystallization, and an absorptive test may understate it if absorption in vivo is slower hate2019 C12, C35. Two explanations for the missing crystallization of fresh tacrolimus capsules, the polymer and the lower supersaturation from absorption, were not separated, because no run without the sink at the same volume exists hate2019 X15, C22. The area of the same module is 100 cm² in one card and 115 cm² in another [hate2019 P4; hate2017 M10]. The fitted model constants are not reproducible from the printed values (F29) hate2019 X1, X3, X4.

← Concepts and formulas

concept · as used in Dissolution

activity coefficient

The ratio of the ideal solubility to the real solubility of a drug in a solvent, \gamma_d; a value below 1 means that the drug dissolves better than ideal, far above 1 that it mixes much worse [baird2011 E7, C23; marsac2008b E2, C14]. If the entropy of mixing is close to ideal, \gamma < 1 points to exothermic mixing and favourable drug–solvent interactions and \gamma > 1 to endothermic mixing [baird2011 C23; marsac2008a C34]. New aspect (C. Amorphous solubility and LLPS): the activity coefficient γ of the drug in the dilute aqueous solution links concentration to activity, a = C\gamma or a = x\gamma; the amorphous solubility estimate assumes that γ in the bulk is the same at the crystalline and at the amorphous solubility, a "reasonable assumption" for dilute solutions of poorly soluble compounds ilevbare2013a E7, C55; indulkar2015 C43; mosqueragiraldo2015 E5. Micelles break the assumption of equal activity coefficients at the crystalline and the amorphous concentration: for atazanavir in 3.6 mg/mL SDS the slope of free against total drug, labelled γ, was 0.047, so the concentration ratio is about half the activity ratio indulkar2017a R11, E8, C44. For telaprevir the ratio of flux slopes below the plateau gives the ratio of activity coefficients (Eq. 7) lu2017b E7. New aspects (Miscibility and drug-polymer interactions): For a drug in a polymer the activity coefficient γ carries any non-ideal entropy or heat of mixing, and the mole-fraction solubility of the crystal is its ideal value divided by γ [marsac2009 E1, C4]. It splits into a combinatorial (entropy) part and a residual (enthalpy) part; exothermic mixing lowers γ and endothermic mixing raises it [marsac2009 C10]. In a polymer γ is much higher than in a small-molecule analogue because the polymer contributes less mixing entropy [marsac2006b C50; marsac2009 C33]. Estimating the solubility of a drug in a liquid is essentially the problem of determining γ, which is exceedingly difficult for drugs in viscous glassy polymers [marsac2009 C4]. New aspect (Bioperformance): γ appears in a = \gamma C for the donor and as γm for the membrane in the flux equation, and additives change the donor value [raina2015c E3, E4, C35]. The concentration-based supersaturation ratio assumes \gamma/\gamma_{eq} = 1; this holds in simple buffers, where the dilute solution is nearly ideal, and fails in media with micelles, where the solubilized fraction differs between the saturated and the supersaturated solution elkhabaz2019b E2, C28, C42. New aspect (Physical stability): the activity coefficient of water in an amorphous drug, from water uptake by Raoult's law a_{water} = \gamma_{water} X_{water}, and of the drug in water, from aqueous solubility; both were tested as predictors of moisture-induced separation and showed no trend [rumondor2009c E1, E2, C29].

Findings

PEG dispersions: F3, F11. C. Amorphous solubility and LLPS: F5, F12, F16. Miscibility and drug-polymer interactions: F8, F9. Bioperformance: F3, F6, F18. Physical stability: F2, F13.

Related concepts

depends on ideal solubility; measured by drug solubility in polymer; indicates enthalpy of mixing; related to Flory-Huggins interaction parameter and drug-polymer interactions, and chemical potential; part of thermodynamic activity; depends on combinatorial entropy of mixing.

Formulas

activity coefficient from solubility, Flory-Huggins melting point depression, activity from concentration, binodal condition, solid-liquid equilibrium solubility equation; Flory-Huggins activity equation.

How it is measured or obtained

From the mole-fraction solubility in a liquid analogue of the polymer, PEG 400, after 24 h at 25 °C with a UV assay, and the ideal solubility from the melting point and heat of fusion, \gamma_d = \frac{1}{x_d}\exp\left(\frac{-\Delta H_{fus}(T_m - T)}{R\,T_m^{2}}\right) [baird2011 P5, P9, E7; marsac2008b P5, P9]. PEG 400 is used because activity coefficients in viscous, semicrystalline PEG 3350 are hard to determine [baird2011 C21]. In the amorphous solubility papers it is not measured; in the liquid–liquid equilibrium form x_{L_1}\gamma_{L_1} = x_{L_2}\gamma_{L_2} it links the water-phase and drug-rich-phase compositions ilevbare2013a E12. For the PVP dispersions, from the solubility of the crystalline drug in 1-ethyl-2-pyrrolidone (excess drug, 25 °C, at least 24 h, UV–Vis, or HPLC with refractive-index detection for sucrose) and the ideal solubility from the melting point, heat of fusion and heat capacities; Eq. 8 then scales γ to PVP, assuming ideal entropy with EP, equal contacts and equal γ at both solubility limits [marsac2009 P2, P7, E1, E8, C11]. In the Bioperformance papers it was not measured; the slope of free against total drug is taken from atazanavir–SDS work indulkar2017a R11, E8, and the solubility split into a crystal term and an activity-coefficient term was used to compare ritonavir and atazanavir [alhalaweh2016 E3, E4, E5]. In the moisture study, the water activity coefficient from the uptake of the amorphous drug at 95% RH and the drug activity coefficient from mole-fraction solubility [rumondor2009c P13].

Values in the library
materialvalue or classconditionspaper ids
chlorpropamide; aceclofenac; loratadine; haloperidol in PEG 4000.614; 0.121; 2.369; 0.84225 °C[baird2011 R9.a, R9.b, R9.c, R9.d]
acetaminophen, ketoprofen, naproxen, ibuprofen, felodipine, ketoconazole in PEG 4000.06, 0.31, 0.02, 0.64, 0.14, 0.0925 °C[marsac2008b R14.a, R14.b, R14.c, R14.d, R14.e, R14.f]
the same six drugs in water1.2 × 10¹, 1.4 × 10⁴, 3.8 × 10³, 3.1 × 10⁴, 2.4 × 10⁵, 5.3 × 10⁵cited aqueous solubilities[marsac2008b R14]
nifedipine; felodipine in water1.89 × 10³; 2.43 × 10⁵25 °C[marsac2008a R10.c, R10.d]
five compounds in an ethyl-pyrrolidone analogue of PVPbelow 1 for all25 °C[marsac2009 C23, R9]
felodipine, nifedipine, ketoconazole, sucrose, indomethacin in EP0.89, 0.26, 0.68, 0.37, 0.1525 °C[marsac2009 R9]
same five in PVP K123.94, 1.18, 5.04, 1.76, 0.50scaled with Eq. 8[marsac2009 R9]
same five in PVP K29/324.34, 1.30, 5.92, 1.93, 0.54scaled with Eq. 8[marsac2009 R9]
nifedipine, felodipineχ-based activity from melting depression; no direct γFlory–Huggins[marsac2006b E6]
ritonavir, atazanavirlog γ ordering RTV > ATV (recomputed 4.65 against 3.01)pH 6.8[alhalaweh2016 X1, X2]
felodipine / nifedipine fluxγ/γ* assumed 1 for dilute solutionsbuffer[raina2015c C32]
atazanavir, posaconazoleconcentration-based and activity-based ratios agree in the two buffers and differ in the four micellar mediasix media, 37 °Celkhabaz2019b R8, R9, C42
water in nifedipine, felodipine, droperidol, pimozide, indomethacin, ketoprofen3.19, 4.13, 3.00, 4.65, 2.54, 3.3525 °C, 95% RH[rumondor2009c R24]
same drugs in water4.95 × 10⁵ to 8.88 × 10⁶; ketoprofen 9.85 × 10⁴from solubility[rumondor2009c R24]

The amorphous solubility chapter prints no activity coefficient value.

Pitfalls and disagreements

The conversion from mg/mL to mole fraction is not printed in Baird and Taylor; the printed values equal moles of drug per mole of PEG 400 in 1 mL, and a true mole fraction would give 0.766, 0.149, 2.49 and 0.856 instead of 0.614, 0.121, 2.369 and 0.842, leaving the split at 1 unchanged [baird2011 X4]. Loratadine, grouped with haloperidol as close to ideal, dissolves at about 0.42 of its ideal solubility [baird2011 X13]. Several rows of the Marsac and co-workers table are not internally consistent, aqueous solubilities come from three cited sources at unstated temperatures and the ideal solubility temperature is not stated, so the coefficients in water serve only as orders of magnitude [marsac2008b X5, X18]. Activity coefficients in PEG 400 were measured at 25 °C, far below the 52–61 °C of the molten dispersions, and are not values for molten PEG 3350 [baird2011 X16]. A value below 1 in PEG 400 did not separate the crystalline from the transforming drugs in PEO under humidity: all six were below 1 [marsac2008b R14, R16]. Ketoconazole has 0.09 in PEG 400 but a positive interaction parameter in PEG 3350 [marsac2008b R14.f; zhu2011 R5.f]. In the amorphous solubility papers the constancy of γ underlies the claim that a solubilizer leaves the maximum supersaturation unchanged, while a later study found the concentration ratio falling [ilevbare2013a C54; raina2015c C29]. There γ is estimated with the ideal dilute solution as standard state, from a buffer calibration indulkar2017a R11, and is the factor in a = C\gamma; the PEG dispersions chapter defines \gamma_d instead as the ratio of ideal to real solubility in a liquid polymer analogue, so the values tabulated above are not those of the aqueous solutions. The predicted γ in PVP exceeds 1 for four of five compounds (1.18–5.97), so the compounds that dissolve better than ideal in the analogue are predicted to dissolve worse than ideal in the polymer; only indomethacin stays below 1 [marsac2009 R9]. Lattice volume, heat capacities, ideal solubilities and the mole-fraction basis in PVP are not printed [marsac2009 X4, X13]. The value of indomethacin in K29/32 differs between table and text [marsac2009 X2]. In the Bioperformance papers γ/γ* = 1 breaks down with solubilizers [raina2015c C36]; the plotted log γ in the ritonavir–atazanavir figure does not match the recomputation [alhalaweh2016 X1, X2]. The value of \gamma/\gamma_{eq} is not measured; its departure from 1 is read from the gap between the flux ratio and the concentration ratio (F18) elkhabaz2019b C21, C28. In the 2009 moisture study the drug-in-water column of the table equals the inverse mole-fraction solubility rather than the printed equation, so it ranks drugs by solubility alone [rumondor2009c X1]; two text rankings disagree with the table [rumondor2009c X2, X3].

← Concepts and formulas

concept · as used in Dissolution

additive cases for amorphous solubility

A classification of drug/additive pairs by where the additive acts on the amorphous solubility S_a (Ueda 2024, review, pp. 28–40). Case I: the additive forms a complex with the drug in the aqueous phase; S_c and S_a rise, the free drug at the limit stays at S_a^0 and the maximum supersaturation ratio stays at S_a^0/S_c^0. Case II: the additive distributes into the drug-rich phase; S_c is about unchanged, and S_a and the maximum supersaturation ratio fall. Case III: both; S_c rises, the free drug at the limit and the maximum supersaturation ratio fall, and S_a/S_c does not give the maximum. The case belongs to the pair, not the additive: ketoprofen is listed with EUD-E (I), PVP (II) and CTAB (III) (pp. 29, 40–41).

Findings

Amorphous solubility: F11, F12, F19. Crystallization from solution: F19. Bioperformance: F4, F7, F18, F19.

Related concepts

acts on amorphous solubility; Case I relates to micellar solubilization; Case II relates to polymer partitioning into the drug-rich phase and drug-rich phase; decides how free drug concentration and the supersaturation ratio move.

Formulas

Case I (Eq. 6) and Case II for a small-molecule additive and a polymer (Eqs. 9 and 10), as printed in the review; the equations page gives the steps between them:

S_a=\frac{S_a^0}{1-f^a_{com}}

S_a=S_a^0\cdot x_{\mathrm{drug}}\cdot e^{\chi(1-x_{\mathrm{drug}})^2}

S_a=S_a^0\cdot\Phi_{\mathrm{drug}}\cdot e^{(1-\frac{1}{r})(1-\Phi_{\mathrm{drug}})+\chi(1-\Phi_{\mathrm{drug}})^2}

How it is measured or obtained

The review assigns the case from reported solubility, flux and phase composition data (Table 1, p. 29). Two measurements separate the cases (synthesis): S_c with the additive, and the maximum flux or free drug with the additive. S_c up and maximum flux unchanged is Case I; S_c unchanged with S_a and flux down is Case II; S_c up with flux down is Case III.

Values in the library
caseS_cS_afree drug at S_amaximum supersaturation ratioS_a/S_c gives the maximum?
no additiveS_c^0S_a^0S_a^0S_a^0/S_c^0yes
Case IrisesrisesS_a^0S_a^0/S_c^0no; generally smaller
Case IIabout S_c^0fallsS_a^0X(S_a^0/S_c^0)Xyes
Case IIIrisesfalls then rises, or risesS_a^0X(S_a^0/S_c^0)Xno

X is the term of the drug-rich phase in Eqs. 9 and 10 below. The table is taken from the review's text and Figs. 6 and 7, with the Case III formulas added (equations page, W7).

case in the review's Table 1system in the libraryvaluesids
Case Ifelodipine, 0.04% vitamin E TPGSonset 10.4 → 177.3 µg/mL; concentration ratio 9.2 → 4.5; maximum flux in the buffer band[raina2015c R9, R11]
Case Iatazanavir, 3.6 mg/mL SDScrystalline 1.1 → 45.6 µg/mL; amorphous 70 → about 1450 µg/mL; concentration ratio about 65 → about 33; flux-derived ratio about 65indulkar2017a R7, R13
Case Iibuprofen, EUD-Ecrystalline 29.8 → 42.1 µg/mL; amorphous 177.1 → 256.3 µg/mL; ratio 5.94 → 6.09ueda2020b R1
Case IIibuprofen, HPMC; PVP-VAcrystalline 29.8 → 30.0; 30.1 µg/mL; amorphous 177.1 → 96.9; 90.7 µg/mL; ratio 5.94 → 3.23; 3.01ueda2020b R1
Pitfalls and disagreements

The classification comes from a review; the library has not tested it as a whole, and no paper in the library sets out Case III values for one of the pairs listed there. Atazanavir with STC is listed under Case I, yet with 3 mM STC alone the amorphous solubility fell from 65 to 38 µg/mL and the flux-based maximum was about 40 against about 63 in buffer, returning to about 63–66 from 0.075 mM lecithin indulkar2018 R6, R10, so the assignment holds for STC with lecithin and not for STC alone (synthesis). The same additive can change class with the drug or the medium: EUD-E stays in the water with ibuprofen at pH 2.0 and associates with enzalutamide droplets at pH 6.5 (F19). In Case III S_a depends on the amount of drug-rich phase, so the measured value depends on dose (pp. 39–40). The review gives no partition equation, so x_{\mathrm{drug}} and \Phi_{\mathrm{drug}} must be measured and cannot be predicted from it (equations page).

← Concepts and formulas

concept · as used in Dissolution

amorphous-crystalline free energy difference

The Gibbs free energy of converting the crystal to the amorphous drug (supercooled liquid or glass) at the test temperature; it fixes the factor e^{\Delta G/RT} of the amorphous solubility almeidaesousa2015 E1, E11. It is estimated from Tm and ΔHf by the Hoffman equation or from temperature-dependent heat capacities by a thermodynamic cycle (the Cp method), to the supercooled liquid or, below Tg, to the glass almeidaesousa2015 E2, E9, E10, E14.

Findings

F5, F7.

Related concepts

estimated by the Hoffman equation; depends on degree of supercooling; sets the amorphous solubility advantage; reference state discussed under structural relaxation.

Formulas

Hoffman equation, amorphous-crystalline free energy difference from heat capacity, Gibbs free energy relation.

How it is measured or obtained

DSC melting data and modulated-DSC reversing heat capacities fitted linearly in T for crystal, glass and supercooled liquid; the Cp method needs an un-ionized, non-solvated crystal that melts without degradation almeidaesousa2015 P5, P6, C11; mosqueragiraldo2015 P3.

Values in the library
materialvalue or classconditionspaper ids
ibuprofen, phenylbutazone, tolnaftate3.24/3.56; 4.84/4.59; 5.69/6.13 kJ/mol (Hoffman / Cp, to supercooled liquid)25 °Calmeidaesousa2015 R11
diclofenac; sorafenib; griseofulvin8.51/9.99; 10.33/10.34; 9.69/9.39 kJ/mol25 °Calmeidaesousa2015 R11
sorafenib; griseofulvin, to the glass11.37; 10.38 kJ/mol25 °Calmeidaesousa2015 R12
CRH15.68 (Hoffman); 5.85 (Cp, supercooled liquid); 5.95 kJ/mol (Cp, glass)25 °Calmeidaesousa2016 M1
telaprevir, Hoffman13.31 kJ/mol (extractor recomputation)37 °Cmosqueragiraldo2015 E1
atazanavir14.55 kJ/mol, Hoffman, recomputed from the printed Table I inputs (ratio about 62, as printed, with 0.22 read as exp[−I(a)]; about 228 read as I(a))310 Kindulkar2017a E2, X1; indulkar2015 M2
Pitfalls and disagreements

The Cp parameters are not printed, so the Cp values cannot be recomputed almeidaesousa2015 E9, E10. The claim that the Cp method is more accurate presupposes that the onset equals the supercooled-liquid solubility almeidaesousa2015 X4. The glass carries more free energy than the supercooled liquid below Tg almeidaesousa2015 C29. For atazanavir (undercooling 171 K, synthesis: 481 − 310 K) the Hoffman inputs printed give the printed ratio of 62 only with 0.22 read as exp[−I(a)], not I(a) as Table I heads the column (synthesis) indulkar2017a X1; indulkar2015 M2; for pazopanib the cycle cannot be run because it degrades on melting sugihara2018 C17.

← Concepts and formulas

concept · as used in Dissolution

amorphous salt

The amorphous form of a drug salt; salt formation adds an ionic interaction between the protonated base and the counterion, taken to dominate over hydrogen bonding in setting Tg [towler2008 C23]. Combining salt formation and amorphization "may be desirable", for example for a lyophilized product [towler2008 C18].

Findings

F20.

Related concepts

depends on glass transition temperature; related to crystallization tendency and physical stability.

Formulas

none in this chapter (counterion descriptors listed in the chapter table).

How it is measured or obtained

Prepared by freeze-drying or melt quenching and checked by DSC [towler2008 P3, P5, R1]; Tg, recrystallization on heating, moisture sorption and storage at high humidity are then measured [towler2008 P6, P8, P9]; later by open-dish storage at 40 °C/75% RH hiew2022b R7; duong2022a C32.

Values in the library
materialvalue or classconditionspaper ids
propranolol saltsTg 9.0–35.9 °C against −9.3 °C for the baseDSC[towler2008 R4]
nicardipine saltsTg 28.5–81.0 °C against 3.2 °C for the baseDSC[towler2008 R5]
20 salts of both bases11 amorphous after freeze-dryingDSC[towler2008 R1]
propranolol salts0.39–61.90% water uptake at 75% RHvapour sorption[towler2008 R8]
lumefantrine saltsbenzoate, PEG 250 diacid, besylate crystallized within 4 weeks; HCl and sulfate not for at least 16 weeks40 °C/75% RHhiew2022b R7
delamanid saltsstable 2 weeks; salt formation raised Tg40 °C/75% RHduong2022a C32, C47
Pitfalls and disagreements

Stoichiometry and ionization state of the amorphous salts were not reported [towler2008 X8]. Crystallization and moisture uptake did not follow counterion pKa [towler2008 C14, C34]; drug or salt Tg appeared an important predictor for lumefantrine hiew2022b C37, yet the highest-Tg propranolol salt crystallized [towler2008 R12]. Salt formation did not change delamanid crystallization in dispersion films at pH 3.0 nguyen2023b C17.

← Concepts and formulas

concept · as used in Dissolution

amorphous solubility advantage

The factor by which the amorphous drug is more soluble than the crystal, e^{\Delta G/RT} from the crystal–amorphous free-energy difference, reduced by the activity of the water-saturated amorphous drug ilevbare2013a E1, C60; almeidaesousa2015 E1. In the amorphous solubility and LLPS papers the measured counterpart is the supersaturation ratio at the LLPS onset (F6). The papers of 2017–2022 add measured values of the ceiling ratio of 63.6 (atazanavir, synthesis: 70 ÷ 1.1), 28.5 (telaprevir, synthesis: 148 ÷ 5.2), about 600 (pazopanib) and 2.5–5.9 (ibuprofen, falling with temperature), and that micelles lower the concentration-based advantage (atazanavir 65 → 33) without lowering the activity-based one indulkar2017a R4, R6, R13; lu2017b R2, R1; sugihara2018 R4; ueda2022 R16. New aspect (ASD process): it is the supersaturation an ASD can reach if it stays amorphous and dissolves; crystals in the dispersion "directly" lose their share of it ("potency") and may also consume what is generated moseson2020a C3. For bicalutamide the maximum advantage over the stable form is 35-fold moseson2021 R2. In the pH-shift test of posaconazole the dose was set at about 10 times the amorphous solubility in the intestinal medium (19.1 µg/mL), that is about 191 µg/mL, and 200 µg/mL at full release shah2024 P11, X9. New aspect (Bioperformance): the ratio is computed by the Hoffman estimate with water correction or taken as the LLPS onset over the crystalline solubility [raina2014a R7; raina2015c E8]. New aspect (Crystallization from solution): in the solution-crystallization papers the advantage fixes the highest supersaturation tested: the calculated amorphous solubility over the crystalline solubility gives S 15.3–15.4 for ritonavir and about 14.7 for celecoxib, and the "amorphous benchmark" S of about 10 for felodipine ilevbare2012b R3; ilevbare2013c E1, R2; alonzo2012 C42. The measured counterpart is the plateau after a pH shift or the onset of phase separation (F2). For six dihydropyridines the estimated ratios of amorphous to crystalline solubility in buffer were 16.1 (cilnidipine), 9.03, 8.42, 23.0, 11.7 and 22.9, not reproducible from the printed inputs (felodipine 5.93 recomputed against 6.68 µg/mL); for danazol the recalculated estimate of 7.8 µg/mL is a ratio of 8.7 against the earlier 19.6 raina2015b X2; jackson2016 R3, R4. New aspect (Supersaturation from ASD dissolution): the calculated advantage is the yardstick for what a dissolving amorphous solid or dispersion should reach, and the question is whether a dispersion can exceed that of the pure amorphous drug: by flux it did not for felodipine, and the authors add that thermodynamics gives "no reason to expect" the two to be equal alonzo2011 C22, C45. The advantage is "rarely achieved" because the solid or the solution crystallizes konno2008a C4; alonzo2010 C2. For six marketed tacrolimus capsules the advantage of about 35-fold was "sustained throughout" a 2 h non-sink test trasi2016 C44, C16; mixing the drug with a polymer that does not dissolve lowers the advantage a dispersion can realize li2018 C67.

Findings

Amorphous solubility and LLPS: F5, F6, F7, F12, F14, F16, F21. ASD process: F23, F26, F27, F28, F39, F41. Bioperformance: F1, F4, F18. Crystallization from solution: F2, F9, F14, F19, F21, F22, F34. Supersaturation from ASD dissolution: F1, F5, F7, F18, F22, F23, F28, F29.

Related concepts

same as the ceiling supersaturation ratio; built from amorphous-crystalline free energy difference and water sorption correction of amorphous solubility; gives the amorphous solubility. Realised in non-sink dissolution; lost to residual crystallinity and matrix crystallization; lowered by mutual amorphous solubility reduction. Depends on Hoffman equation; estimated with the Gibbs-Duhem equation water correction; depends on crystalline solubility; related to free drug concentration.

Formulas

amorphous solubility advantage with water-sorption correction, amorphous solubility advantage from free energy difference, supersaturation ratio. Amorphous-to-crystalline solubility ratio, Hoffman equation.

How it is measured or obtained

By calculation (Hoffman or heat-capacity free energy, sorption isotherm) and by the onset almeidaesousa2015 P9, P10; also by dissolving an amorphous film ilevbare2013a P4. In the ASD process papers: crystalline solubility by 72 h shake flask; amorphous solubility as the onset of light scattering during solvent-shift addition (liquid–liquid phase separation), in some cases only with a polymer present because the drug crystallised too fast without it moseson2020a P7, P8; moseson2021 R1, R27. In the Bioperformance papers it is estimated from melting data or as onset ÷ crystalline solubility [raina2015c P3, P6]. In the crystallization-from-solution papers: calculated with the Hoffman equation and a water-sorption correction; measured by dissolving a spin-coated film (ritonavir), by pH-induced precipitation, and by the onset of phase separation of a solvent-shifted solution ilevbare2012b P4–P6; hsieh2012 P11; jackson2014 P6, P7. In the ASD dissolution papers: calculated from melting data with the Hoffman equation and the measured crystalline solubility konno2008a P7; alonzo2010 P12; alonzo2011 P8; tested against flux relative to the crystal alonzo2011 R14.

Values in the library
materialvalue or classconditionspaper ids
ibuprofen to griseofulvinpredicted 3.7/4.2, 7.0/6.4, 9.8/11.7, 28.9/52.5, 48.4/48.6, 34.8/30.9 (Hoffman / Cp method)25 °Calmeidaesousa2015 R13
clotrimazole; atazanavirpredicted about 9.2 and 62; measured about 13 and about 6337 °Cindulkar2015 R3, R10
felodipine, buffer; with 0.04% vitamin E TPGS; in FaSSIFabout 9.2; 4.5; 5.0 (concentration-based)37 °C[raina2015c C29]
tacrolimusabout 35 (49/1.4), about 33–36 by method; other drugs 5–65amorphous solubility by ultracentrifugation, pH 4.5, 37 °Ctrasi2016 R16, R17, X9
IDM, pH 4.5 acetatecrystalline about 8, amorphous about 80 µg/mL (about 10-fold, synthesis); unchanged by 50 µg/mL PVPVA37 °Cmoseson2020a R1
BCL, pH 6.8 phosphateform 1 4.3, form 2 15, amorphous 150 µg/mL; 35-fold37 °Cmoseson2021 R1, R2
RTV and LPV, pH 6.8crystalline 1.8 and 2.9, amorphous 31 and 19 µg/mL10 mM phosphate, 37 °Ctrasi2019 M1, M2
IDM–PVPVA with 25% residual crystalsC720 about 28.8 against about 43.1 µg/mL: the share of the advantage lost with the crystals50 µg/mL total dosemoseson2020a R6
posaconazole in FaSSGF and FaSSIF V2LLPS concentration (taken as the amorphous solubility) 2326 and 19.1 µg/mL against crystalline 86.5 and 1.2 µg/mL, ratios about 27 and 16 (arithmetic on the cited values)37 °Cshah2024 R11, C14
ritonavir / atazanavir / lopinavirabout 14 / 83 / 6pH 6.8[alhalaweh2016 R6]
clotrimazole15pH 8[indulkar2016 R3]
atazanavirobserved ratio in SDS about half that in buffer, with unchanged activityindulkar2017a C64, C45
atazanavir, posaconazoleconcentration ratio about 55 and 36 in the buffers, about 14 and 5 in pooled human fluid; flux ratio 50–56 and 29–37six mediaelkhabaz2019b R8, R9
atazanavir, darunavir58 and 1.37 from the printed solubilities (printed "almost 82-fold" and "1.30")pH 6.8, 37 °C[alkalla2026 R3, R6, X1]
pretomanid8–10 in buffers37 °C[nguyen2023a R1]
tacrolimusabout 33pH 4.5purohit2019 C30
enzalutamideabout 14.5 (42/2.9); S "approximately 13" is the theoretical 39/2.9pH 6.5[wilson2018 R1, R3, X2]
felodipineS of about 10 over the crystal (theoretical and measured)benchmark for the supersaturation range S 3–12alonzo2012 M1, C42
ritonavir20.6 µg/mL calculated, 19.8 measured; S 15.3–15.4 over 1.3 µg/mL37 °Cilevbare2012b R1, R2, R3
efavirenz; celecoxib19.8 and 22.6 µg/mL calculated against 12.3 and 2.5 measured37 °Cilevbare2013c R2
five weak basesratios 22.2, 11.9, 20.4, 54.6, 7.0 without and 12.3, 9.8, 16.7, 15.3, 4.3 with water correction37 °Chsieh2012 R10
glyburide; warfarinabout 60 and 4825 °Chsieh2014 R16
danazol19.6 printed (15.4 recomputed); earlier estimates 13.7 and 26.525 °Cjackson2014 R2, R3, X1
six dihydropyridinesestimated amorphous solubility 0.5, 6.68, 48, 20, 6.3, 19.0 µg/mLbuffer, Hoffman with water correctionraina2015b R10
danazol7.8 µg/mL with heat-capacity data and the water correction; onset 8 µg/mL25 °C, pH 6.8jackson2016 R3, R8
posaconazolemeasured amorphous/crystalline 33.6 at pH 7.0 (32.4–37.3 from pH 2.0 to 7.0); estimate 37.9 printed37 °Cduong2022b R1, R6, R7, X5
felodipineabout 10 times the crystal, about 9.5 µg/mL37 °C, pH 6.8 test fluidkonno2008a R17
felodipineabout 9.1 µg/mL at 37 °C; 5–6 µg/mL at 25 °CpH 6.8alonzo2011 M1
felodipine, flux ratio to the crystal8.5 (pure amorphous), 9.5 (50:50), 10.5 (90:10 HPMC dispersion)dialysis, 37 °Calonzo2011 R14
indomethacinabout 21 µg/mL (crystal about 1.2 µg/mL)pH 2.0alonzo2011 M2
ritonavir; lopinavir (cited)25 and 17 µg/mL against 1.7 and 2.7 µg/mL crystallinepH 6.8trasi2015b M1, M2
lopinavirabout 5.6 (17.4/3.1)pH 3, 25 °Cli2018 E2, R1
indomethacin with 100 µg/mL HPMC36 µg/mL against 1.61 (γ) and 2.8 µg/mL (α)pH 2.2, 37 °Cxie2017 R3, R1
paclitaxel31.6 against 0.36 µg/mL, a ratio of about 88pH 6.8, 37 °C, three methodsque2018 R1, R2
delamanid0.76 against 0.018 µg/mL at pH 6.5, a measured ratio of 42.3 against 31.8 from the Hoffman free energy37 °Cduong2022a R1, R27
praziquantel, racemate and R-enantiomerratios 5.6–7.7 and 4.0–5.8 across nine media; amorphous 1.17–1.74 and 1.20–1.70 mg/mL37 °Calvarenga2025 R1
posaconazoleabout 20 against 1.69 µg/mL in FaSSIF; 115.1 µg/mL crystalline in FaSSGF37 °Celkhabaz2019a R2, R1
Pitfalls and disagreements

The calculated advantage fails for high-melting drugs when the Hoffman free energy is used (F7) mosqueragiraldo2015 C23, C24. When additives raise crystalline solubility more than the LLPS concentration, the concentration-based ratio falls (felodipine, about 9.2 in buffer to 4.5 in 0.04% vitamin E TPGS and 5.0 in FaSSIF), while the maximum flux stays in the buffer band, so the advantage in activity is retained [raina2015c R9, R11, C29]. In dispersions, a dose below the amorphous solubility (IDM 50 against about 80 µg/mL) can still lose most of the advantage to crystals; a crystal-free bicalutamide dispersion never reached 40 µg/mL against 150 µg/mL moseson2020a X17; moseson2021 C41. The amorphous solubility of ritonavir alone is reduced to about 4 µg/mL in a co-amorphous granule trasi2019 R4. In the Bioperformance papers the ratio from concentrations falls with solubilizers although the flux advantage does not [raina2015c C43]; the atazanavir ratio differs between cards because the crystalline solubility differs (F1). In human fluid the flux of a solution at the amorphous solubility was about 30 times that of a crystalline suspension for posaconazole, so the advantage was not lost although the concentration ratio fell to about 5 (F18) elkhabaz2019b C30, C45. The printed atazanavir and darunavir ratios do not follow from the printed solubilities [alkalla2026 X1]. With a polymer in the medium the same ratio applied to the polymer-containing solubility overestimates the ceiling (danazol: 43 against an onset of 8–9 µg/mL) jackson2014 X9. Celecoxib's measured 2.5 µg/mL is far below the calculated value and is not discussed ilevbare2013b X9. The efavirenz run started at S about 2.3, the ratio of calculated amorphous to crystalline solubility being 2.4 ilevbare2013c X4. The printed estimates for the dihydropyridines differ between media in ways the equation does not allow raina2015b X2. Felodipine dispersion and solution readings of 14.1 and about 11 µg/mL exceed the 9.5 µg/mL estimate of the 2008 paper, measured by UV through a 70-µm filter konno2008a X5. The 25 °C indomethacin range (17–25 µg/mL) does not reproduce from its printed inputs (15.8–23.6) alonzo2010 X2. That a dispersion reached the same activity as the pure amorphous drug "may be purely coincidental" alonzo2011 C48. The tacrolimus ratio uses an ultracentrifugation value measured with 10 µg/mL HPMC in the buffer trasi2016 X9. For praziquantel the ratio is lower for the enantiomer because its crystal is more soluble, not because its amorphous solubility is lower alvarenga2025 R1.

← Concepts and formulas

concept · as used in Dissolution

amorphous solubility

The concentration of dissolved drug at which a supersaturated aqueous solution is in apparent, metastable equilibrium with the amorphous drug, more rigorously with the water-saturated supercooled liquid or glass; it is not a true thermodynamic solubility, which is why the authors keep it in quotation marks almeidaesousa2015 C3, C39. In this chapter it is operationally the concentration at which a drug-rich phase first separates (the LLPS or GLPS onset), and the free-drug ceiling above which added drug only makes more drug-rich phase ilevbare2013a C3, C5; mosqueragiraldo2015 C34. It exceeds the crystalline solubility by e^{\Delta G/RT} and is lowered by the water the amorphous drug absorbs ilevbare2013a C60. The papers of 2017–2022 add that the dissolved-drug concentration in the presence of a drug-rich phase can be read directly by NMR (ibuprofen 154 µg/mL in buffer against 151 µg/mL calculated) ueda2021 R5, R6, C10, and that the value changes when a second component enters the drug-rich phase or the water phase: a dissolved polymer that enters the droplets lowers it (ibuprofen 177.1 → 96.9 and 90.7 µg/mL with 300 µg/mL HPMC and PVP-VA) and a polymer that complexes the drug in water raises it (256.3 µg/mL with EUD-E) ueda2020b R1; micelles raise the total concentration at the amorphous solubility but not its activity indulkar2017a R13; STCDC and SGCDC lower the activity at which it is reached lu2017b R18. New aspect (Bioperformance): the highest free-drug concentration that an amorphous (supercooled-liquid or glassy) drug can produce in a medium; above it a second, drug-rich phase separates and the free concentration stays at this value [raina2014a C24, C27; alhalaweh2016 C1; hate2018 C5]. Several papers treat the concentration at which the second phase appears (the LLPS or glass–liquid onset) as the amorphous solubility [indulkar2016 R2; hate2018 R2; alhalaweh2016 R6]. In ASD work it is the ceiling of the free concentration a dispersion can give, and the concentration at which flux stops rising (F2). Enzalutamide, atazanavir, darunavir, clozapine, ketoconazole, nifedipine and pretomanid all take the UV-extinction onset as the amorphous solubility, with the polymer or medium of the test present [wilson2018 R2, C16; ueda2020a R1; alkalla2026 R3; nguyen2023a R1, P2]. In rats the enzalutamide dispersions that reached the ceiling gave several times the exposure of the crystalline drug (F23) [wilson2018 R16, R18].

Findings

Amorphous solubility and LLPS: F3, F4, F5, F6, F7, F8, F9, F10, F11, F12, F13, F14, F15, F16, F17, F18, F19, F20, F21, F23. Bioperformance: F1, F2, F4, F6, F7, F8, F15, F18, F19, F20, F23, F27, F30.

Related concepts

depends on crystalline solubility and water sorption correction of amorphous solubility; measured as the onset of liquid-liquid phase separation; sets the ceiling of supersaturation; lowered by a second component in the drug-rich phase; gives the amorphous solubility advantage. Papers of 2017–2022: lowered by a dissolved polymer that enters the drug-rich phase (polymer partitioning into the drug-rich phase); not raised in activity terms by micelles (activity-based supersaturation); its upper limit on the activity scale is the maximum achievable supersaturation. Depends on Hoffman equation inputs; related to thermodynamic activity.

Formulas

amorphous solubility advantage with water-sorption correction, amorphous solubility advantage from free energy difference, Hoffman equation, amorphous-crystalline free energy difference from heat capacity. Amorphous-to-crystalline solubility ratio, ideal-mixing reduction of amorphous solubility.

How it is measured or obtained

(1) As the onset of scattering during slow addition of a drug stock, confirmed by a polarity probe ilevbare2013a P5; almeidaesousa2015 P1, P2. (2) As the drug concentration in the supernatant after ultracentrifugation of a phase-separated solution trasi2015a P2; almeidaesousa2016 P7. (3) By dissolving an amorphous film under non-sink conditions ilevbare2013a P4; indulkar2015 P13. (4) As the break point of flux against donor concentration trasi2015a P6. (5) By calculation from the crystalline solubility, the free-energy difference and the water activity of the amorphous drug ilevbare2013a E1. The papers of 2017–2022 add quantitative ¹H NMR of the dissolved drug beside the drug-rich phase ueda2021 P3, P4, ultracentrifugation and the flux plateau in bile-salt media lu2017b P3, P4, and an in-situ UV probe after a pH shift sugihara2018 P6. In the Bioperformance papers: (1) solvent-shift UV extinction, a methanol stock pumped into stirred buffer and the onset of scattering read at 350–455 nm [raina2014a P7; alhalaweh2016 P9; indulkar2016 P3; hate2018 P2; elkhabaz2017 P4]; (2) ultracentrifugation or centrifugation of a supersaturated solution and assay of the supernatant [mosqueragiraldo2018b P8; alhalaweh2016 P10]; (3) the flux plateau in a diffusion cell [raina2014a R16]; (4) estimate from the crystalline solubility with the Hoffman free-energy difference and a water-sorption correction [raina2014a E3, E5]; (5) the drug's own fluorescence, whose emission intensity rises, and whose peak may shift to shorter wavelengths, when the drug-rich phase forms, at the concentration found by ultracentrifugation in buffers and in pooled human intestinal fluid elkhabaz2019b R3, C17; (6) a solvent-shift or antisolvent addition into buffer with the polymer already dissolved, which gives the value in the presence of that polymer [ueda2020a R1; alkalla2026 R3, P7]; (7) for tacrolimus the value of about 50 µg/mL is taken from earlier work and used to define the dose-to-volume conditions of a dissolution test hate2019 R7, C16; purohit2019 C15.

Values in the library
materialvalue or classconditionspaper ids
ritonavir37.2 µg/mL (onset); 39.2 predicted; 34.2 from filmwater, 37 °Cilevbare2013a R8, R13
ritonavir; lopinavir; paclitaxel hydrate26–28; 16–17.3; 27.2–30.1 µg/mL100 mM phosphate pH 6.8, 25 °C, four methodstrasi2015a R1
telaprevir90–92 µg/mL (UV, NMR, fluorescence)pH 6.8, 37 °Cmosqueragiraldo2015 R13
clotrimazole; atazanavir7.7; 65.1 µg/mL (un-ionized)37 °C, 0.1 M bufferindulkar2015 R2
ibuprofen; sorafenib; griseofulvin125.74; 0.532; 355.96 µg/mLpH 2 or 6.8, 25 °C; griseofulvin with HPMCAS-HFalmeidaesousa2015 R5, R6
CRH1 free base12.49–13.73 µg/mLpH 4.6 citrate + 20 µg/mL HPMC, 25 °Calmeidaesousa2016 R4
atazanavir70 µg/mL (onset); 68 predicted; with 3.6 mg/mL SDS about 1450 µg/mL total but 65–70 µg/mL freepH 6.8 buffer, 37 °Cindulkar2017a R5, R6, R11, R13
telaprevir146–149 µg/mL by three methods; 311–360 with 12 mM STDC or SGDC50 mM pH 6.5 buffer, 37 °Clu2017b R2
pazopanib19.8 µg/mL at pH 6.5; 9.2 at pH 8.4; 60 at pH 50.1 M buffers with 5 µg/mL HPMC, 37 °Csugihara2018 R1
ibuprofen177.1 (buffer); 96.9 (HPMC); 90.7 (PVP-VA); 256.3 µg/mL (EUD-E)pH 2.0 (D2O), 300 µg/mL polymer, 37 °Cueda2020b R1
ibuprofen154 µg/mL (buffer) → 89–131 µg/mL with 1000 µg/mL of six polymersNMR, pH 2.0 (D2O), 37 °Cueda2021 R5
ibuprofen in bufferabout 127 µg/mL at 15 °C, about 284 at 60 °CNMR, pH 2.0 (D2O)ueda2022 R9
felodipine5.99 / 8.70 µg/mL predicted; onset 6.01 / 8.70pH 6.8 buffer, 25 / 37 °C[raina2014a R16]
nifedipine72.09 µg/mL predicted; onset 72.85buffer with 1 mg/mL HPMC, 37 °C[raina2014a R16, X3]
felodipine, FaSSIFonset 214.6 µg/mL; estimate 308.037 °C[raina2015c R1]
ritonavir / atazanavir / lopinavir45.2 / 132.1 / 27.2 µMpH 6.8, 37 °C[alhalaweh2016 R6]
clotrimazole7.5 µg/mL (ratio 15)pH 8, 37 °C[indulkar2016 R2, R3]
atazanavir78 µg/mL (94 with 1.8 mg/mL PVPVA)pH 6.8, 1 mg/mL HPMCAS[hate2018 R2, R3]
ezetimibe21.0 µg/mL buffer; 123 µg/mL FeSSIF37 °C[elkhabaz2017 R3]
telaprevir96–111 µg/mL with 1.05 mg/mL polymerpH 6.8, 37 °C[mosqueragiraldo2018b R13]
tacrolimusabout 50 µg/mL (cited), ratio about 35USP medium Ipurohit2018 R4; trasi2016 C16
enzalutamideonset about 42 µg/mL (crystalline 2.9); the printed estimate of about 39 is not reproduced50 mM phosphate pH 6.5, 37 °C[wilson2018 R1, R2, R3, C16]
atazanavir, clozapine, ketoconazole81.5 / 233.0 / 75.0 µg/mL without polymer; with AS-HF 35.5 / 95.0 / 56.0; with AS-LF 75.8 / 219.0 / 71.2buffer, 37 °C, 1000–2700 µg/mL polymer[ueda2020a R1, C13]
nifedipine123 µg/mL with AS-HF against 221 with AS-LFbuffer, 37 °C, 1000 µg/mL polymer[ueda2020a R1]
atazanavir, darunavir93.1 ± 1.5 (crystalline 1.6) and 363.8 ± 2.1 µg/mL (hydrate 265.6)pH 6.8, 37 °C, antisolvent[alkalla2026 R3]
atazanavir, posaconazole79–102 and 8.1–43.3 µg/mL in six media (crystalline 1.4–7.1 and 0.22–3.2)FaSSIF-type media and human intestinal fluid pool, 37 °Celkhabaz2019b R1, R2, C15, C16
pretomanidabout 166 µg/mL in buffer, 226 with SLS, 275 with TPGS, 308 in FaSSIF; crystalline 15–18, ratio 8–10pH 6.5, 37 °C[nguyen2023a R1, R2]
tacrolimusabout 50 µg/mL, crystalline 2.5 µg/mL, ratio about 33used to fix the dose-to-volume conditionshate2019 R7; purohit2019 C30
Pitfalls and disagreements

The onset depends on the method by up to about 25% (ritonavir in water at 37 °C, 34–40 µg/mL) and on the medium (water against 100 mM buffer, twofold), so values are comparable only within one medium ilevbare2013a X14, X16, C40. Four of the eight 2013 predictions cannot be recomputed from the printed inputs ilevbare2013a X1. The claim that the onset equals the amorphous solubility is partly circular in the free-energy comparison almeidaesousa2015 X4. For ionizable drugs the value is for the un-ionized form indulkar2015 C47. For ibuprofen the same medium gave 177.1 µg/mL by extinction and 154 µg/mL by NMR, with crystalline solubilities of 29.8 and 43.1 µg/mL, in two papers of one group ueda2020b R1, X1; ueda2021 R5, R2. In SDS a prediction from the crystalline solubility overshoots about twofold indulkar2017a C16. For a drug that degrades on melting (pazopanib) the calculation cannot be made sugihara2018 C17. In the Bioperformance papers the onset depends on stirring, addition rate and polymer [raina2014a X15]. The estimate fails in FaSSIF and for high-melting telaprevir [raina2015c C18; mosqueragiraldo2015 C24]; the nifedipine prediction cannot be reproduced [raina2014a X3]. The atazanavir crystalline solubility is 5 µg/mL in one card and about 1.1 µg/mL in two others, so ratios differ [hate2018 R1; alhalaweh2016 R6; indulkar2017a E3]. A second drug or a polymer in the drug-rich phase lowers it (F6, F7). The value depends on the medium and on the polymer in it: the more hydrophobic HPMCAS grade AS-HF lowered it for four drugs by a quarter to well over half, and a co-dissolved crystalline drug lowered it too (F19, F20) [ueda2020a R1, C13; alkalla2026 C1, C39]. In simulated and human intestinal fluids the amorphous solubility rose much less than the crystalline solubility, so the ratio of the two fell from about 36 to about 5 for posaconazole (F18) elkhabaz2019b R1, R2. The printed enzalutamide estimate cannot be reproduced from its inputs [wilson2018 R3, X1]. The amorphous solubility of atazanavir at 37 °C is 75 (cited), 79, 81.5 and 93.1 µg/mL in four later papers, with crystalline values of 1.4, 1.14 and 1.6 µg/mL, so the ratio is 56, 71 or 58 depending on the paper [hate2022 M1; elkhabaz2019b R1, R2; ueda2020a R1; alkalla2026 R3] (synthesis: 79/1.4, 81.5/1.14, 93.1/1.6).

← Concepts and formulas

concept · as used in Dissolution

amphiphilicity

The presence of both hydrophobic and hydrophilic parts in one molecule. For the cellulose ω-carboxyalkanoate esters the hydrophobic ester chains and the ionized terminal carboxyls (pKa about 4.43, nearly fully ionized at pH 6.8) make the polymer amphiphilic, which the authors think "may influence" its adsorbed conformation and so its growth inhibition ilevbare2012c C40, R15. CA 320S Sub, a relatively hydrophilic cellulose acetate backbone with an ionizable suberate chain, is said to have a structure that "may promote" interaction with drugs ilevbare2013b C46. For telaprevir the ionized carboxylate makes a cellulose polymer amphiphilic, with a free energy of solvation of −86 kcal/mol for ionized adipate against −33 for protonated adipate, but charged long side chains (A5b, A6, A7) fold onto the backbone and are "not truly amphiphilic" mosqueragiraldo2016 R16, C37, C55.

Findings

F8, F11, F25, F37, F44.

Related concepts

related to polymer hydrophobicity, polymer ionization and degree of substitution.

Formulas

none.

How it is measured or obtained

Not measured; it follows from the polymer structure and the degree of ionization at the test pH ilevbare2012c R15; ilevbare2013b R18.

Values in the library
materialvalue or classconditionspaper ids
CA 320S Sub 0.90; 0.63growth ratio 12.6; 10.8 on ritonavir; 7.2; 6.1 on celecoxib5 µg/mLilevbare2013b R9
adipate esters, ionizedratio 2.98 (CAP Adp 0.85) at pH 6.8, 1.12 at pH 3.8ritonavirilevbare2012b R7
hydrophobicity, rigidity and amphiphilicity"appear to be jointly responsible" for the advantage of the cellulose estersritonavir growthilevbare2012c C49, C50
CA-A5a-079 (short spacer, COOH branch); CA-A5b-067 (long spacer)induction time about 90 against about 12 mintelaprevir 150 µg/mL, 5 µg/mL polymermosqueragiraldo2016 R6
HPMCAS L, M, Hamphiphilic; affinity for posaconazole rises with A/S ratio and lower pH, for water the reversepH 5.5–7.5shah2025 C48
HPMCAS against Eudragit E POboth amphiphilic; HPMCAS "should" be drawn to enzalutamide dropletspH 6.5wilson2021 C50, C51, C52
Pitfalls and disagreements

Amphiphilicity, solubility parameter and carboxyl content are interrelated in the new esters and cannot be separated by the data ilevbare2012c C42, X10. PAA, with many ionized carboxyls but no hydrophobic part, failed for all three drugs ilevbare2013b R9.b. Amphiphilicity was inferred, not measured, and the simulations omit the ester groups of the real polymers mosqueragiraldo2016 X10, X15.

← Concepts and formulas

concept · as used in Dissolution

antiplasticization

The rise of the Tg of a drug on mixing in a polymer of higher Tg, and with it a lower mobility, proposed as a reason for the stabilization of amorphous dispersions [taylor1997 C4; kestur2011 M3]. PVP, with a Tg of 177 °C, "has been suggested" to raise the Tg of the mixture and lower the mobility [taylor1997 C4, M4]. For indomethacin, inhibition by PVP at relatively low levels was already known to be too large to be explained by antiplasticization alone [taylor1997 C5]. In the growth studies of this chapter, antiplasticization is ruled out as the cause at 3–5 wt% polymer, since the dispersion Tg changes by 2.2 °C or less [kestur2010a C32; kestur2011 C12]. New aspect (Physical stability): water undoes it: after 75% RH every felodipine dispersion with up to 25% polymer had a Tg below the dry drug [konno2008 C16].

Findings

Miscibility and drug-polymer interactions: F11, F1. Physical stability: F5, F6.

Related concepts

depends on and is measured by glass transition temperature; contrasts with drug-polymer interactions as an explanation of crystallization inhibition; related to supercooled liquid; contrasts with plasticization and plasticization by water.

Formulas

Gordon-Taylor equation.

How it is measured or obtained

By onset Tg of dispersions by DSC at 10 °C/min after erasing thermal history, against the drug alone and the pure polymer [kestur2010a P8; kestur2011 P5]. Growth rates may be normalized to Tm − T and T − Tg to separate driving force and mobility [kestur2010a C31, E2]. DSC Tg against polymer content, dry and after humid storage [konno2008 P6; marsac2006a R17].

Values in the library
materialvalue or classconditionspaper ids
felodipine with 3% PVP, PVP/VA, HPMCAS, PVAcTg 44.1, 43.7, 42.7, 43.5 °C against 43.3 °Conset DSC[kestur2010a R1]
bifonazole with 5% polymersTg 16.4–17.4 °C against 15.2 °Conset DSC[kestur2011 R6]
nimesulide with 5% polymersTg 19.9–20.8 °C against 19.5 °Conset DSC[kestur2011 R6]
felodipine with PVP, HPMC, HPMCAS (other chapter)PVP raised Tg by 10 °C at 25 wt%; HPMC and HPMCAS no change up to 25 wt%onset DSC[konno2006 R6, C25]
felodipine with PVP (other chapter)Tg largely unaffected (43.4–44.1 °C against 43.3 °C at 0.5–4.5 wt% PVP); antiplasticization not the cause, yet growth slowedPVP grades, 3–4.5 wt%; dry[kestur2010b R1, C34]
felodipine–PVP 10 wt%Tg 40.5 °C, below pure felodipine 43.1 °Cdry[marsac2006a R8, C22]
felodipine with ≤ 25% polymerTg ≈30–35 °C after 75% RH25 °C[konno2008 R7, C16]
celecoxib with 40% PVP K12 or PVPVA vs HPMCAS or HPMCdry Tg 84.4 and 81 °C vs 64 and 71 °C, although neat PVP K12 and PVPVA have lower Tg (97, 102 °C) than HPMCAS and HPMC (117, 140 °C)DSC, dry[xie2016b R17, R14, C27]

Evidence table: antiplasticization.

Pitfalls and disagreements

For nimesulide the inhibition order follows the polymer Tg, and the rank of dispersion Tg matches the inhibition rank for both drugs, within about ± 1 °C [kestur2011 X8]. At higher polymer contents the Tg does rise, and PVP is the strongest antiplasticizer of the three polymers in another study [konno2006 C25]. The authors conclude that Tg is not a good predictor of crystallization tendency in multicomponent amorphous systems [kestur2010a C33]. PVP raised felodipine Tg only from about 15% polymer, although the authors write "at all concentrations" [konno2006 X15]. The dry Tg gain did not carry over to humid storage: after 3 days at 94% RH four celecoxib dispersions had Tgs of 37.4–42.1 °C and very different stability [xie2016b R17, C46].

← Concepts and formulas

concept · as used in Dissolution

atomic layer coating

Deposition of a thin metal-oxide film on the surface of powder particles by repeated, self-limiting vapour-phase reactions in a rotating reactor. For Al2O3, trimethylaluminum reacts with surface hydroxyl groups and water regenerates them, giving overall 2 Al(CH3)3 + 3 H2O → Al2O3 + 6 CH4 [duong2022c E5, E6, E7]. In the ASD process papers it is applied at 35 °C to amorphous solid dispersion (ASD) particles made by spray drying, by rotary evaporation or by extrusion and milling, with Al2O3 in all four coating papers and ZnO in one [duong2022c P2, P4; moseson2022a P1, P2, P3; benson2025 P3]. The growth per cycle was varied from slow (under 0.4 nm per cycle) to average and fast, and thickness is reported in nm [moseson2023 P3, P4; benson2025 P3]. The coating was introduced to stop surface crystallization of ASD powders; it also changes flow, water uptake and release.

Findings

F42, F43, F44, F45, F46, F47, F48, F49.

Related concepts

characterised by coating conformality and coating defect density; acts through surface molecular mobility and the moisture barrier effect; targets surface crystallization; sized with the specific surface area; changes powder flowability.

Formulas

coating thickness from oxide content and specific surface area.

How it is measured or obtained

Thickness: residual oxide after heating the coated powder in dry air (800–850 °C, thermogravimetry, TGA) converted with the BET area (see coating thickness from oxide content and specific surface area), and cross-sectional TEM of focused-ion-beam lamellae of about 100 nm [moseson2022a P9, P10, R2; duong2022c P5, P10, R2]. Effects: SEM, XRPD and DSC of powders stored open at 40 °C; dynamic vapour sorption; shear-cell and tapped-density flow tests; release in non-sink tests; SEM/EDX of particles incubated in medium [moseson2022a P11, P12, P14; duong2022c P8, P9, P15, P16; moseson2023 P10, P13, P15].

Values in the library
materialvalue or classconditionspaper ids
ezetimibe–HPMCAS 50 and 70% DL, spray dried, thin and thick Al2O3about 12–40 nm by TEM (six places in one cut); oxide residue 1.7–9.2%rotating-tube reactor, 35 °C[duong2022c R2, R12]
erlotinib–HPMCAS, erlotinib–PVPVA, naproxen–HPMCAS, lumefantrine–PVPVA7.4–24 nm by TGA and BET; 4.4–37.7 nm by TEM; Al2O3 and one ZnOrotary reactor, 35 °C[moseson2022a R2]
posaconazole–HPMCAS 25 and 50% DL, twelve samples11–39 nm (oxide 0.40–3.68%); one slow-deposited 26 nmslow, average, fast growth[moseson2023 R1]
ritonavir–PVPVA 10 and 20% DL, nine coated samples9.3–28.3 nm; oxide 0.92–5.30%; BET 0.22–0.76 m²/gbenson2025 R1
stored powders, uncoated → coatedcrystals by SEM within 1–3 weeks → 3–24 weeks, or none within 48 weeks to 2 yearsopen dishes, 40 °C, 31–75% RH[moseson2022a R11; duong2022c R16, R17]
tablets of coated ritonavir–PVPVA particlesabout 35–75% of the dose at 60 min against about 95% uncoatedpH 6.8, 37 °Cbenson2025 R10
Pitfalls and disagreements

The thickness label is a mass-balance estimate and differs from TEM by up to a factor of two inside one paper [moseson2022a X10]. The number of cycles is not printed in the coating papers [moseson2023 P3; moseson2022a P3; duong2022c X2; benson2025 M11]. The coating delays crystallization and does not stop it, and it can slow or block release depending on defects, not thickness (see coating defect density) [moseson2022a R11; moseson2023 C53; benson2025 C21]. Evidence is for Al2O3 on six drug–polymer pairs; other oxides, polymers and dosage forms were not tested [duong2022c C60; moseson2022a X20].

← Concepts and formulas

concept · as used in Dissolution

bile salt micelles

Aggregates of bile salt above its critical micelle concentration; in the telaprevir studies 1.86 mM is nominally the monomer and 12 mM the micellar level, with micelles of the dihydroxy salts STDC, SGDC and STCDC opposing the monomer effect on nucleation and those of STCDC and SGCDC on growth lu2017 C14, C41; lu2017a C13, C33.

Findings

F32, F33.

Related concepts

part of critical micelle concentration; related to mixed micelles.

Formulas

none.

How it is measured or obtained

CMC by surface tension (Wilhelmy plate, 37 °C) for STC (about 4 mM) and SGDC (about 2 mM) only; the states of the other salts are cited from companion work lu2017 R5, X7; lu2017a C13.

Values in the library
materialvalue or classconditionspaper ids
telaprevir δ 11.5, 12 mM STDC, SGDC, STCDCinduction time about 140, 125, 180 min against >960 at 1.86 mMpH 6.5, 37 °Clu2017 R3
telaprevir δ 12.5, 12 mM STCDC, SGCDC15 h residual 4.0 of 145.2 and 11.5 of 95.2 µg/mL against 60.5 and 91.7 at 1.86 mMpH 6.5, 37 °Clu2017a R12
ternary STC–STDC–STCDC at 5.58 mMabout 254 min against >960 for 12 mM STC; STC protection "reduced by the presence of the other bile salts"δ 11.5, 37 °Clu2018 R4, C18
Pitfalls and disagreements

The monomer share was not measured, 1.86 mM is close to the SGDC CMC, and the 18 mM evidence is given in words only lu2017 X7, X8.

← Concepts and formulas

concept · as used in Dissolution

binodal

The coexistence curve of the water-rich and the drug-rich liquid phases: beyond it two liquid phases can coexist, and at a fixed temperature its concentration is the LLPS (coexistence) concentration CL-L; the spinodal lies inside it ilevbare2013a C30, C32. The drug concentration in the continuous phase after complete phase separation (the ultracentrifuge supernatant) is one binodal point trasi2015a C10; jackson2016 C7. New aspect (ASD process): in drying and humid films it is the boundary of the two-phase region on a phase diagram. In the evacetrapib (ECP)–methanol–water picture the drying path crosses the binodal while solvent is still present, and the drug leaves as droplets [li2017 C38, C42]. In the drying model of the ritonavir–PVPVA spray solution the two-phase region is computed from the minima of a four-component Flory–Huggins free energy along the drying path, and drug above its solubility marks a path inside it li2020 P12, R17. The papers of 2017–2022 add that for telaprevir the ultracentrifuge and flux onsets are read as the coexistence (binodal) concentration of the continuous phase lu2017b C15, C16. New aspect (Release mechanism and LoC): in a hydrating dispersion the binodal is crossed when the local water content is high enough. In dissolving ritonavir–PVPVA compacts at 10% droplets formed near the gel–solution interface once the drug–polymer–water system exceeded its binodal composition, rather than throughout the gel, because a certain water content must be reached first; since droplets formed deeper at 20% than at 10%, the water content needed to cross the binodal is higher at 10% yang2022a C34, C35, C36. For the phenolphthalein analogues PVPVA diffused out of the 10% PHPH and 70% MePHPH particles until the hydrophobic binodal composition was reached deac2023b C52, and the binode closer to the initial composition is the majority phase deac2023b C34. Measured in 2024 for two drug–PVPVA–water systems at 37 °C from equilibrated mixtures, with the condition \mu_i^{(1)} = \mu_i^{(2)} used for the PC-SAFT binodal deac2024b R15, R22, R23, E20. For MePHPH–PVPVA the binodal at low water lies between the film compositions at 75 and 80% RH, under 15 wt% water deac2024b C13.

Findings

Amorphous solubility and LLPS: F3, F9, F4. ASD process: F2, F6, F20. Release mechanism and LoC: F5, F25, F27, F30.

Related concepts

boundary of liquid-liquid phase separation; inside it lies the spinodal decomposition region; its concentration is the amorphous solubility. In films it is drawn on a ternary phase diagram. Joined by tie lines ending at the critical point; read with the local equilibrium assumption in the gel layer.

Formulas

binodal condition.

How it is measured or obtained

Cloud point on cooling at 0.5 °C/min and clear point on heating at a known concentration (90° scattering at 474 nm), taking their mean as TL-L; or titration onset at a fixed temperature, which agrees closely with it ilevbare2013a P12, C30. For ECP films the phase boundaries of the ECP–methanol–water diagram were not determined and Fig. 12 is a schematic [li2017 C38, X9]. For the ritonavir–PVPVA spray solution the region is computed along the trajectory, not mapped: pseudo-ternary sections (total solvent, PVPVA, ritonavir) at 11.5:88.5, 15:85 and 30:70 show the region growing with the water content of the feed li2020 R18. In the release-mechanism papers: Position of droplet formation in time-lapse confocal images yang2022a R10, R11; polymer content of particles held in buffer with PVPVA deac2023b R4, R5.

Values in the library
materialvalue or classconditionspaper ids
ritonavirTL-L about 11.4, 15.7, 20.0, 24.7 °C at about 58, 50, 46.5, 42.7 µg/mLbuffer or water (medium unresolved), 0.5 °C/minilevbare2013a R11, X6
ritonavirLLPS concentration about 57.9 at 10 °C, 37.1 at 35 °C, 54.8 µg/mL at 65 °Cwaterilevbare2013a R11
ECP–methanol–waterdrying path B → D crosses the binodal at C with less water than the spiking path B → E needsschematic[li2017 C38]
ECP–water–polymer (storage)high-DL films absorb little water and stay in the one-phase region; low-DL films cross the binodalschematic[li2017 C42]
drug–polymer mixturesbinodal points are the two minima of the free energy of mixing against compositionargument[rumondor2009a E6, C35]
MePHPH–PVPVA–waterexperimental binodes and tie lines at 37 °CPC-SAFTdeac2024b R15, R22
ritonavir–PVPVA–methanol–water (25% and 50% DL)the 25% DL path enters the two-phase region from about 12.5:87.5 water:methanol; the 50% DL path from about 11.5:88.5droplet modelli2020 R17, R19, C50, C53
ritonavir–PVPVA 10%; 20% compactsdroplets near the gel–solution interface; deeper in the gelreal-time confocal, pH 6.8yang2022a R10, R11
PHPH–PVPVA; MePHPH–PVPVA hydrophobic binodalabout 72% PVPVA; below 5% PVPVAparticles, 48 h in bufferdeac2023b C52
MePHPH–PVPVA films 10–50%binodal between 75 and 80% RH (≈4.9–9.4 and 9.6–14.6 wt% water)37 °Cdeac2024b R1, R2
Pitfalls and disagreements

The binodal was measured on the low-temperature branch only, four concentrations, and the scan direction on that branch is unresolved ilevbare2013a X6, X7, X17. Raina and co-workers describe the binodal points as the theoretical onset of LLPS in a partially miscible drug–buffer system [raina2014a C27]. In the film papers the quaternary system with polymer is "much more complex" than the ternary one drawn, and Fig. 12B lacks the letters that the text uses [li2017 C36, X9]. The computed binodal depends on χ values that are partly assumed and inconsistently described, and keeps the 10:90 path outside the region although the powders separate li2020 X10, X12. The binode drug loads stated in the 2023 text do not exactly match the nanoparticle data deac2023b X18. MePHPH films separated at 80% RH where the computation predicts one phase, and single-phase PHPH mixtures lie inside the computed gap deac2024b C34.

← Concepts and formulas

concept · as used in Dissolution

biorelevant media

Dissolution media that simulate gastrointestinal fluids (FaSSIF, FeSSIF, Ensure Plus for the fed stomach) [raina2015c M5; elkhabaz2017 C7]. Later papers add FaSSIF V1 and V2, a composite FaSSIF with the six main human bile salts, pooled fasted duodenal aspirates (pH 7.3), and FeSSIF V2 at pH 5.0–6.0 for an enteric-polymer ASD [elkhabaz2019b M14, P1, X5; nguyen2023a R1, R17, R19]. New aspect (Crystallization from solution): in the bile-salt papers the media are characterized mainly through their bile salt; STC is the only bile salt in common recipes (FaSSIF 3 mM, FeSSIF 15 mM), against 1.40–5.90 mM of mixed conjugated bile salts in human duodenum and jejunum li2016a R29; lu2017 R14. From 2018 the library compares the media themselves: taurocholate-only FaSSIF against media with the six main human bile salts, lecithin against its digestion products, synthetic media from single volunteers' bile acid pools, and pooled aspirated human fluid indulkar2018 P1; lu2018 P5; enright2020 P2, P5; elkhabaz2021 P2.

Findings

Bioperformance: F4, F11, F12, F18, F26, F27. Crystallization from solution: F29, F32, F34, F39, F40, F41, F42, F43.

Related concepts

relates to in vitro–in vivo correlation and micellar solubilization, food effect; contains mixed micelles and bile salt micelles; related to bile salt hydroxylation pattern.

Formulas

none.

How it is measured or obtained

Powder-based FeSSIF (version 1) and commercial Ensure Plus; phases of Ensure Plus separated by centrifugation [elkhabaz2017 M7, M8, P2]. In the bile-salt papers the recipes are compared with the bile salt content of human fluid, and single or blended bile salts replace STC in buffer to test the effect of composition li2016a R29, P5; lu2017 R14.

Values in the library
materialvalue or classconditionspaper ids
ezetimibecrystalline 0.97 (pH 2 buffer), 18.6 (FeSSIF), 48 and 162 µg/mL (Ensure Plus aqueous, oily)37 °C[elkhabaz2017 R1]
felodipineFaSSIF solubility about 40-fold buffer37 °C[raina2015c R1]
atazanaviramorphous 71.4 / 75.9 / 61.1 µg/mL in three media with equal lipid; induction 39 / 74 / 23 minenright2020 R13, R14
celecoxibinduction longer in a six bile-salt blend than in 0.1% taurocholate: 210 ± 21 against 103 ± 35 min0.1% bile salt, pH 6.5, 37 °Cli2016a R6, R28, C63, C69
posaconazole, atazanavirsix media including a pool of aspirates; solubilities in the other rows of this chapterpH 6.5 (simulated), 7.3 (aspirates)elkhabaz2019b R1, R2, X5
pretomanidequilibrium solubility 15–18 µg/mL in buffers, about 3 times that in FaSSIF V1 and about 6 times that in FeSSIF V2; reference tablet reached 110 µg/mL in FeSSIF V237 °C[nguyen2023a R1, C33]
FaSSIF; FeSSIF; fasted FaSSGFSTC 3 mM (1.613 mg/mL); 15 mM (8.065 mg/mL); 0.08 mMstandard recipesli2016a R29
human jejunum; duodenumbile salts 1.52–5.30 mM; 1.40–5.90 mMliteratureli2016a R29
atazanavir, ritonavir, tacrolimus, cilnidipineComposite-SIF against FaSSIF-V1: 120 / 43, 740 / 240, 101 / 53, 330 / 330 minamorphous solubility of each medium, pH 6.5, 37 °Cindulkar2018 R20
telaprevirbuffer about 29, FaSSIF 21, two six-bile-salt lecithin media >960 minδ 11.5lu2018 R6
atazanavirbuffer 253 ± 65; FaSSIF about 48; Composite-SIF about 81; FaSSIF-V3 23 ± 6 minpH 6.5, 37 °Cenright2020 R2
atazanavir, posaconazoleaspirated fasted human fluid about 141 and 18 min, latest of six media; FaSSIF-V1 earliest37 °Celkhabaz2021 R6, R7
posaconazoleFaSSIF V1 2.23 and 46.18; FeSSIF V1 7.80 and 160.89 µg/mL (crystalline, amorphous)37 °Cduong2022b R8
Pitfalls and disagreements

Media differ in pH, salts and lipid at once; single components were not varied [elkhabaz2017 X9]. The authors state that the pretomanid results show the limits of in vitro assessment in standardized media: additives that helped in FaSSIF did not help in monkeys, and the ASD fell below the crystalline reference in the fed state (F26, F27) [nguyen2023a C57, C73]. An STC-only medium sat in the middle of the 3 min to more than 16 h range of the six main human bile salts for celecoxib, and ranked bile salts differently with and without a drug-rich phase li2016a R6; lu2017 R3, R4. No simulated medium with lecithin was tested in the bile-salt papers of 2016–2017 li2016a C64; from 2018 lecithin and its digests were found to shorten induction times (see F39) indulkar2018 R16; enright2020 R10. FaSSIF-V1 and V2 differ in buffer as well as lecithin, and aspirated fluid was at pH 7.3 against 6.5 for the simulated media elkhabaz2021 X12, X19. A six-bile-salt medium matched human fluid for atazanavir but not for posaconazole elkhabaz2021 C27.

← Concepts and formulas

concept · as used in Dissolution

buffer capacity

Evidence table: buffer capacity. Content from the release-mechanism chapter (2022–2025), with a note from the Peptide permeability chapter.

The ability of a medium to take up acid or base with little change of pH, given in mM per pH unit (mM/ΔpH). For an enteric polymer it measures how many buffer species are available to carry away the protons that the polymer releases as it ionizes at the dissolving surface. That the dissolution rate of enteric polymers depends on buffer capacity is described as "well known" (cited) qi2022 C20. For HP-50 in four pH 6.8 buffers the rate "appears to trend" with buffer pKa and buffer capacity: slow buffers had higher pKa and lower capacity, fast buffers higher capacity and a pKa near the dissolution pH qi2022 C14. HPMCAS-MF dissolution depends strongly on buffer capacity in pH 6.8 phosphate, particularly at low capacity, and "may be approaching" a plateau at higher capacity bapat2023 C9. A pre-ionized polymer salt keeps its rate whatever the buffer capacity qi2022 C4. In 2024 a stronger buffer (100 against 50 mM pH 6.8 phosphate) sped a 25% loratadine–HPMCAS dispersion about 2.5-fold but neat HPMCAS only about 1.1-fold, and neat HPMCAS dissolved more slowly in 50 mM pH 9.0 glycine (about 0.63 against 0.90 mg/min/cm²), put down to the low buffer capacity of that buffer at the acidic surface bapat2024 R6, X3, R4, C13.

Findings

Release mechanism and LoC: F23, F24, F32.

Related concepts

sets the microenvironmental pH at the dissolving surface; depends on buffer pKa; acts through the unstirred water layer; its effect is removed by polymer salt formation; related to critical ionization for polymer dissolution and the gel layer of enteric polymers.

Formulas

boundary-layer diffusion flux (film model).

How it is measured or obtained

Phosphate buffers of the same pH at different concentrations: 50 and 5 mM at pH 6.8, given as 29 and 3 mM/ΔpH, the 29 measured by a co-worker with the method not printed qi2022 R12, M16, M17; 5, 10, 25, 50 and 100 mM pH 6.8 phosphate given as 3, 5, 13, 26 and 51 mM/ΔpH bapat2023 A1. Rates are surface-normalized polymer release rates of compacts on a rotating disk qi2022 P10; bapat2023 R5.

Values in the library
materialvalue or classconditionspaper ids
HP-50; HP-50-Na compacts≈0.92 → 0.14; ≈2.80 → 2.45 mg/min/cm² from 29 to 3 mM/ΔpHpH 6.8 phosphate, 37 °Cqi2022 R12, C4
HP-50 in BIS-TRIS, phosphate, Tris, TEA buffers≈44.8 / 28.4 / 6.6 / 1.8% dissolved at 60 min (buffer pKa 6.5 / 7.2 / 8.1 / 10.2)50 mM, pH 6.8qi2022 R2, C14
neat HPMCAS-MF≈0.16 / 0.26 / 0.59 / 0.89 / 1.01 mg/min/cm² at 3 / 5 / 13 / 26 / 51 mM/ΔpHpH 6.8 phosphate, 100 rpmbapat2023 R5
neat HPMCAS-MFno gel at 5 mM/ΔpH; gel 3 ± 1 µm at 13 and 19 ± 5 µm at 51 mM/ΔpHconfocal, 60 minbapat2023 R14
neat HPMCAS-MF; 25% loratadine dispersion≈0.91 → 1.00; ≈0.10 → 0.25 mg/min/cm² (50 → 100 mM)compacts, pH 6.8 phosphatebapat2024 R6
Pitfalls and disagreements

The same nominal medium, 50 mM pH 6.8 phosphate, is given 29 mM/ΔpH in the HP-50 paper and 26 mM/ΔpH in the HPMCAS paper (synthesis: from qi2022 M16 and bapat2023 A1), so the two series compare by trend only. The composition and pH of the 5 mM buffer of the HP-50 paper are not printed qi2022 M17. In the Peptide permeability chapter a table row labelled "buffer capacity (Osm/L)" carries osmolality values and the buffer capacity is unreported [fagan2025 X1]. In 100 mM phosphate loratadine complexation also fell from about 70 to 48%, a second route for the buffer effect bapat2024 X11, R16.

← Concepts and formulas

concept · as used in Dissolution

chemical potential

The partial molar free energy of the drug in a phase

The amorphous drug, treated as a supercooled liquid, has a higher chemical potential than the crystal, so its solubility is higher by \exp(\Delta\mu/RT); in an equilibrated two-phase system the chemical potential of the drug is the same in both phases, so transport driven by chemical potential responds non-linearly to total concentration and peaks where the drug-rich phase first forms trasi2015a E1, C36, C5. With ideal mixing in the drug-rich phase the chemical potential of each component falls by RT\ln x trasi2015a E2, E3. The papers of 2017–2022 add that a dissolved polymer which enters the drug-rich phase lowers the chemical potential of the drug there by dilution (and, for PVP-VA, by interaction), so the drug in the water is lowered to match: ibuprofen 154 → 89–131 µg/mL ueda2021 R5, C11, C42; and the fundamental supersaturation is defined by \ln\delta = (\mu - \mu^{\circ})/RT lu2017b E3. New aspect (Bioperformance): it is the driving quantity of passive transport; it is higher in a supersaturated solution than in a saturated one, and lowered by solubilizers and by a second component in the drug-rich phase [raina2014a C6, E8; raina2015c C7; alhalaweh2016 C25, C26]. Polymer or a second drug in the drug-rich phase dilutes the drug and lowers its chemical potential, and with it the amorphous solubility: HPMCAS-HF for four drugs, darunavir for atazanavir [ueda2020a C36; alkalla2026 C7, C12, C37]. The Crystallization from solution papers add that solubilization raises the solubility without raising the chemical potential, whereas supersaturation raises it, and derive the activity-based supersaturation δ = a/a° from the same relation jackson2016 C31; raina2015b C2; lu2017 E1. New aspect (Supersaturation from ASD dissolution): once a drug-rich phase forms in metastable equilibrium with the water-rich phase, the free drug is fixed at the amorphous solubility, so dispersions cannot raise it further jackson2015 C31, C32; mixing two drugs in the drug-rich phase lowers the chemical potential of each and with it each amorphous solubility, "as long as" they are miscible there trasi2015b C36, C53. Membrane flux into a sink follows the activity of the free drug, so the tacrolimus flux levelling off at the amorphous solubility marks the maximum chemical potential, which six marketed capsules reached trasi2016 C23, C36, C38. Complexed drug raises the total concentration without raising the free drug, so complexed solutions are thermodynamically "quite different" from supersaturated ones wegiel2015 C23, C44. Mixing an amorphous drug with a polymer that stays undissolved, and the water the dispersion takes up, lower the drug's chemical potential and with it the maximum concentration the dispersion can reach li2018 C1, C2, C43.

Findings

Amorphous solubility and LLPS: F8, F11, F12, F15, F17, F19, F20, F21. Bioperformance: F6, F7, F19, F20. Crystallization from solution: F22, F31, F37, F44. Supersaturation from ASD dissolution: F7, F11, F17, F18, F25.

Related concepts

related to thermodynamic activity; lowered by ideal mixing in the drug-rich phase; determines the amorphous solubility advantage. Related to drug–drug miscibility and polymer partitioning into the drug-rich phase; related to supersaturation; related to amorphous solubility; lowered by mixing in solubility suppression.

Formulas

amorphous solubility advantage from free energy difference, ideal-mixing reduction of amorphous solubility, activity-based supersaturation ratio, Huang model of drug solubility in an ASD, Flory-Huggins activity equation.

How it is measured or obtained

Not measured; derived from solubility ratios and used to reason about the effect of a second component on the amorphous solubility (F11) trasi2015a E1, E4. In the Bioperformance papers it is inferred from flux or from the shift of the LLPS concentration [alhalaweh2016 R12, R13; mosqueragiraldo2018b C37]. Through the membrane flux ratio, which follows the activity lu2017 E2. In the ASD dissolution papers it is inferred from flux plateaus and from the fit of ideal mixing jackson2015 R9; trasi2015b R5.

Values in the library

None printed in the amorphous solubility and LLPS chapter; the Bioperformance, Crystallization from solution and ASD dissolution papers give the following.

materialvalue or classconditionspaper ids
telaprevir with CA Sublowered in the drug-rich phase by polymer (fraction 0.90)inferred[mosqueragiraldo2018b C37, R14]
ritonavir, atazanavir mixtureeach drug's amorphous solubility times its mole fractionideal mixing[alhalaweh2016 E7]
ritonavir, lopinavir, paclitaxelmax flux drops with a second componentdiffusion celltrasi2015a C35, E3
ibuprofenpolymer dilution, extra water and interactions lower itdrug-rich phaseueda2021 C42
atazanavir, clozapine, ketoconazole, nifedipine with AS-HFamorphous solubility lowered by a quarter to well over half; AS-LF by under a tenth for threebuffer, 37 °C[ueda2020a R1, C36]
atazanavir with darunaviratazanavir ceiling and flux plateau lowered, darunavir partitioning into the atazanavir-rich phaseinferred from supernatant depletion and flux[alkalla2026 R9, R11, C37]
telaprevir with six bile saltsδ 11.5 and 28.8 set from the flux ratiopH 6.5, 37 °Clu2017 R1
enzalutamide above 42 µg/mLequal chemical potential in droplets and water; crystals can start in either phase or at the interfacepH 6.5wilson2021 C3
posaconazole droplets with HPMCASpolymer mixed into the droplets "serves to" lower the drug's chemical potential (not measured)pH 6.5shah2025 C46
ritonavir + lopinavir mixed drug-rich phasesfree RTV 14.2–15.8 and LPV 7.0–7.5 µg/mL at once and twice the single-drug onsets5 htrasi2015b R16
ritonavir with 180 µg/mL PVP, PAA, HPMC, HPMCASLLPS concentration unchanged, read as no change of the phase's activity37 °Cilevbare2013d R10, C22
tacrolimus solutions, 20–100 µg/mLflux plateau ≈0.0050–0.0055 µg/min from 60 µg/mLpH 4.5, 37 °Ctrasi2016 R14
resveratrol–HPMCAS solutionsup to ≈1610 µg/mL with flux ≈2.6–4.4 against 2.0 µg/min for the crystalpH 6.8, 37 °Cwegiel2015 R19, R20
lopinavir with undissolved HPMCP, 15–85% drug≈0.6–10.5 against 17.4 µg/mLpH 3, 25 °C, 48 hli2018 R3
delamanid edisylate in HPMCP-55 against HPMCP-50, pH 1.6release ≈9% against ≈30% of the dose, polymer release ≈1–2% in both25% drug, 37 °Cnguyen2023c R11, R12
Pitfalls and disagreements

A polymer mixing into the drug-rich phase is later reported to lower the drug's chemical potential and hence the amorphous solubility, as does a second drug in a co-amorphous system [ueda2020a C36; trasi2015b C36; alkalla2026 C12]. Ideal mixing was tested for one pair only trasi2015a X9. The chemical potential of the drug in the polymer-containing droplets was not measured in any of the polymer papers ueda2020b X4; ueda2021 X5, X6. The activity of telaprevir in the CA Sub-rich phase was not measured, so mixing and complexation are not separated [mosqueragiraldo2018b X12]. For the darunavir case the mixing is inferred; the centrifuged drug-rich phase was not analysed and the light-scattering onset with darunavir present was not measured (F20) [alkalla2026 X6]. A higher concentration is not a higher chemical potential in micellar media jackson2016 C31. In the two-drug dispersions the lower chemical potential is inferred, not measured trasi2015b C36. CAAdP 0.85 raised the ritonavir LLPS concentration by about 17%, unlike the other polymers ilevbare2013d X7. The lower chemical potential in the lopinavir dispersions is inferred from concentrations; χ was not measured and the model is used qualitatively li2018 C46. For delamanid in HPMCP-55 the authors invoke stronger or more extensive drug–polymer interactions lowering the chemical potential of the drug, which were not measured nguyen2023c C41, C42.

← Concepts and formulas

concept · as used in Dissolution

classical nucleation theory

The theory that writes the nucleation rate as a pre-exponential factor times \exp\left[-\frac{W^* + \Delta G_\eta}{kT}\right], with a thermodynamic barrier W^* = \frac{16\pi\sigma^3}{3\,\Delta G_v^2} for a spherical nucleus and an activation energy for viscous flow [baird2012 E1, E2; vaneerdenbrugh2010a E3]. Its main factors are driving force, interfacial energy and mobility, and the library adds molecular recognition [trasi2012a C48; konno2006 C33]. In this chapter it is used qualitatively; solution papers fit it to induction times. New aspect (Crystallization from solution): For nucleation from supersaturated aqueous solution the papers use the form J = A\exp(-\Delta G_{crit}/kT) with a barrier that falls steeply with supersaturation, \Delta G^{*} \propto 1/(\ln S)^{2} (a pre-exponential factor A that depends on molecular mobility); the induction time is then inversely proportional to J if growth is fast hsieh2012 E7, E8; ilevbare2013c E3, E4. Two further elements are added: the polymer's effect through the interfacial tension or the cluster reorganization, and the two-step picture in which a disordered solute cluster forms first and then reorganizes, the reorganization being taken as rate-limiting ("we assume") ilevbare2013c C5, C15. The acetaminophen study prints J = A\exp[-16\pi\gamma^3 v^2/(3k^3T^3(\ln S)^2)] to say that temperature, supersaturation and interfacial tension set J, and fits a Poisson model to induction-time distributions for J trasi2015 E6, C20, E5. From 2018 the theory is also used to read medium effects: a lower interfacial energy for lecithin, SDS hemimicelles and phospholipid digests, a lower attachment rate in the pre-exponential factor for human fluid, and a fit of \ln(J/S) = \ln A - B/\ln^{2}S to posaconazole induction times in buffer and four media indulkar2018 C40; indulkar2019b C33; enright2020 C26; elkhabaz2021 C22; duong2022b E7. New aspect (Physical stability): the physical-stability papers use the theory to sort possible polymer effects into the thermodynamic barrier (driving force, interfacial energy) and the kinetic barrier, and conclude that a few percent of polymer acts on the kinetic barrier [konno2006 C34, C36, C40; marsac2006a C44, C48]. New aspect (Supersaturation from ASD dissolution): used qualitatively for dissolving dispersions: nucleation rises steeply with supersaturation, so amorphous–crystalline systems with a high theoretical solubility ratio are expected to nucleate readily konno2008a C20; at equal supersaturation in two coexisting phases nucleation is favoured in the drug-rich droplets, where the drug concentration is higher and the crystal–liquid interfacial tension lower ilevbare2013d C40, E1. A celecoxib paper of 2015 prints the classical rate with (\ln S)^2 and argues from it that the polymer differences come neither from supersaturation, taken as similar in all polymer solutions, nor from interfacial tension, which adsorbed polymer would lower and so speed nucleation; the theory therefore "does not readily allow for obvious mechanistic insights", and two-step nucleation through dense liquid clusters is offered instead (cited) xie2015 E3, C43, C44, C45. The longer celecoxib induction time at 11 than at 22 µg/mL is read as in agreement with the theory xie2016a C13.

Findings

Crystallization tendency: F3, F6. Crystallization from solution: F1, F5, F13, F14, F27, F34, F39, F42. Physical stability: F2, F4, F17. Supersaturation from ASD dissolution: F4, F5, F9, F13, F22.

Related concepts

models nucleation; depends on thermodynamic driving force for crystallization and melt viscosity; contrasts with heterogeneous nucleation; related to prenucleation clusters; governs nucleation rate and nucleation induction time; depends on interfacial tension; related to crystal-solution interfacial free energy; includes kinetic barrier to nucleation and interfacial free energy; depends on supersaturation.

Formulas

classical nucleation barrier, critical cooling rate to avoid nucleation, classical nucleation theory, induction time decomposition.

How it is measured or obtained

Not fitted for melts in this subcategory: the classes are read through it, a more negative ΔGv giving a lower barrier [baird2010 C61], interfacial energy differences being assumed small [vaneerdenbrugh2010a C39], and a steeper viscosity rise lowering the rate [baird2012 C32]. In solution, the barrier and interfacial energy are fitted from induction times against supersaturation duong2022b E7, E8. Most of the solution-crystallization papers do not fit it; they use it qualitatively to explain why induction times fall with rising supersaturation and why a polymer gains more at a lower one (celecoxib 27.5 min at S 7.3 against 2.4 min at S 14.7) ilevbare2013c R15, R9.a, C45. The posaconazole paper converted induction times into nucleation rates (conversion not stated) and fitted the high-supersaturation points of each medium with ν = 920 ų and T = 310 K duong2022b P15, X10. In the 2006 felodipine and nifedipine film papers it is used as a framework only; no parameter was fitted [konno2006 E8; marsac2006a E9]. In the ASD dissolution papers no rate was computed; the expression is printed in two papers and stated in words in a third konno2008a E3; alonzo2010 E4; ilevbare2013d E1.

Values in the library
materialvalue or classconditionspaper ids
posaconazoleinterfacial energy 3.52 mJ/m²; ΔG* ≈2.73 × 10⁻²¹ JPBS, 310 K, fit to induction timesduong2022b E7, E8
classes I against IIIlower barrier inferred for class I from more negative ΔGvmelt classes, γ assumed similar[baird2010 C61]
felodipine filmsrate described by driving force, kinetic barrier and molecular recognition; nucleation most likely heterogeneous0% RH films[konno2006 C33]
celecoxibinduction time 27.5 ± 0.7 min at S 7.3; about 2.4 min at S 14.737 °Cilevbare2013c R15, R9.a
danazol with HPMC-AS516, 365, 277 min at 10, 15, 20 µg/mL25 °Cjackson2014 R17
type 1 weak basesprecipitate only after a supersaturation of 1.4–26.7 times the titration solubilitypH shift, 37 °Chsieh2012 R5, C3
celecoxib dispersions (ASD dissolution chapter)nucleation-rate expression with \ln S and interfacial tension \gamma used to read induction times37 °Cxie2015 E3, C42
acetaminophen, S 1.5, 20 °CJ 1465 (none), 3820 (PAA), 81.86 (HPMCAS), 40.68 (HPMC) # m⁻³ s⁻¹ for V = 1.2 mL10 µg/mL polymertrasi2015 R3, X1
posaconazole, PBS, FaSSIF V1, FaSSIF V2, FeSSIF V1γ 3.52, 2.61, 2.73, 3.24 mJ/m²; A 2.44, 5.14, 4.98, 9.87; R² 0.84–0.9737 °C, high-S points (3–9 per medium)duong2022b R15, R16, X11
posaconazole, PBS, S 13 → 33.6ΔG* about 5.11 → 2.72 × 10⁻²¹ J; r* about 5.89 → 4.29 × 10⁻¹⁰ m310 Kduong2022b R17
seven other drugs (cited)γ 0.60–2.80 mJ/m²literatureduong2022b R18
felodipine with 3–25% polymerthermodynamic route "probably cannot account" for the drop; kinetic barrier speculatedargument[konno2006 C35, C40]
nifedipine vs felodipinelarger enthalpic driving force and lower barrier below Tg for the faster nucleatorTable II, Table I[marsac2006a C49]
flutamideprenuclei redissolve unless they exceed a critical radius, the volume free energy against the interfacial termframework[trasi2012b C46]
felodipine (argument)dissolution of the amorphous drug "will be accompanied by rapid crystallization"37 °Ckonno2008a C21
felodipine 90:10 dispersion (argument)almost all drug enters a highly supersaturated state that immediately crystallizes ("We speculate")37 °Calonzo2011 C29
celecoxib, no polymer, 22 against 11 µg/mLonset within 5 min against about 20 minpH 6.8, 37 °Cxie2016a R2
celecoxib 22 µg/mL, 5 µg/mL PVP-K12 / PVP-K29/32 / HPMCAS or HPMConset ≈1 h / ≈2 h / more than 8 hpH 6.8, 37 °Cxie2015 R1
paclitaxel, critical radius of a two-dimensional nucleus5.4–7.0 nm at S = 88 with three stand-in interfacial tensions; ≈6.8–8.8 nm at the residual supersaturation after 16 hpH 6.8, 37 °Cque2018 R15, R17
Pitfalls and disagreements

Pharmaceutical films are not completely described by homogeneous nucleation theory, which ignores stresses and heterogeneous nucleation [marsac2006a C32]. It does not readily explain polymer effects on nucleation or encompass molecular recognition [trasi2012a C49; xie2015 C44]. In the melt papers neither γ nor nucleation rates were measured, so the barrier argument is an inference [vaneerdenbrugh2010a C39; baird2010 C61]. The proportionality of induction time to 1/J assumes nucleation is much slower than growth to detectable size, which was not tested ilevbare2013c X14. The two-step model is assumed, not shown, for these systems ilevbare2013c C5. The critical supersaturation at which precipitation is seen depends on the compound and the conditions and is somewhat variable hsieh2012 C3. The printed sample volume (0.0012 m³) and the sign of the exponent in Eq. 5 are misprints trasi2015 X1, X2. The human-fluid paper prints the rate equation without the minus sign in the exponent elkhabaz2021 X1. In the posaconazole fits γ and A both differ between media and the critical free energy in the FaSSIF media is less than half the buffer value at equal S, so the assignment of the medium effect to A alone is not secure duong2022b X12. In the felodipine films the homogeneous theory is applied to nucleation that is "most likely heterogeneous" [konno2006 C33; marsac2006a C32]. The reduced-temperature form printed for acetaminophen has typesetting errors (r³ for γ³, a positive kinetic term) [trasi2012a X1]. The 2008 and 2010 dissolution papers print ln S without the square of the classical form konno2008a X8; alonzo2010 X3. The celecoxib supersaturation argument uses crystalline solubilities measured with 22 µg/mL polymer, not the 5 µg/mL of the induction tests, and these differ by 26–43% from the polymer-free value xie2015 X9; the text refers to the wrong equation for interfacial tension xie2015 X1. The paclitaxel values use interfacial tensions of other compounds, and with the printed units the equation gives a dimensionless number que2018 C37, X7.

← Concepts and formulas

concept · as used in Dissolution

competitive adsorption

Two additives competing for the same adsorption sites on a crystal, so that the pair does no better than the stronger one, or a surfactant displacing a polymer so that the polymer's inhibition is lost. Ilevbare and co-workers read the lack of any gain from adding HPMCAS or CAPh to CAP Adp 0.85 as competition for the same sites ("may compete"), and the loss of CAP Adp effectiveness with Tween 80 "most likely" as reduced polymer adsorption ilevbare2012a C39, C53. For felodipine, polymer in solution must compete with growth units for the active sites of the steps, and HPMCAS still adsorbed (phase images) when 100 µg/mL SDS had removed most of its inhibition schram2016 C14, R17, R16. New aspect (Mesoporous silica): two species competing for the same sites on a silica surface, so that one displaces the other. On silica the papers write three such exchanges: water against drug (adsorbed drug + solvent ⇌ adsorbed solvent + drug in solution), surfactant against drug, and a cation against a cationic drug at SiO⁻ sites; urea is used as a competitor for hydrogen bonds [dening2019 E9, E10, C5, C55; hate2020b C19, C21; dening2019 C16; mccarthy2020 C28]. Hate and co-workers explain the low uptake of atazanavir from water by water competing with drug for the surface [hate2020a C41]. The silica papers also note that in crystallization studies additives are described as competing for adsorption sites on a growing crystal ilevbare2012a C33, C39; lu2018 C20.

Findings

Crystallization from solution: F17, F18, F24, F33, F43. Mesoporous silica: F5, F6, F9, F12.

Related concepts

related to synergistic crystallization inhibition, polymer-surfactant interaction and polymer adsorption; acts on drug-silanol hydrogen bonding and ionic interactions; part of the dynamic adsorption-desorption equilibrium; combined with micellar solubilization above the critical micelle concentration; reduces drug adsorption onto silica.

Formulas

none in the crystallization-from-solution papers; in the Mesoporous silica papers competitive solvent-drug adsorption equilibrium.

How it is measured or obtained

Not measured; it is inferred from growth-rate ratios of single additives and of pairs: a pair ratio at or below that of the better component points to shared sites, a pair above both to different sites or a complex ilevbare2012a R11, R17, C33. On silica it is measured directly, as adsorption or release with and without the competitor at fixed drug concentration: 5 M urea, 0.5 M urea, 50 mM triethylamine, Vit E TPGS or SDS below and above their CMC [dening2019 P4, P9; mccarthy2020 P9; hate2020b P3, P7].

Values in the library
materialvalue or classconditionspaper ids
CAP Adp 0.85 + HPMCAS; + CAPhpair 2.7; 2.85 against 3.0 for CAP Adp 0.85 aloneritonavir, S 7.6ilevbare2012a R11.j, R11.k
Tween 80 + CAP Adp 0.33; + CAP Adp 0.850.70; 0.83 against 1.64; 2.97 for the polymers alone and 0.53 for Tween 80 alone5 µg/mL each, S 7.6ilevbare2012a R17
HPMCAS 5 µg/mL ± SDS 100 µg/mL on felodipine seedsgrowth ratio 2.7 (HPMCAS), 1.07 (both), 0.81 (SDS)S 4, rotating diskschram2016 R16
telaprevir seeds with STDC and STCDC monomersboth adsorb with different effectiveness ("we can speculate"), giving intermediate growth inhibitionδ 7.9lu2018 C20, C21, R5
HPMC-AS in bile salt mediabile salts and lecithin "may" reduce polymer–drug interactionsix mediaelkhabaz2021 C32
ritonavir on SBA-15 + 5 M urea259 → 169 mg/gpH 6.8, initial 27.5 µg/mL[dening2019 R8]
indomethacin; methyl ester + 5 M urea12.4 → 6.1; 14.2 → 5.8 mg/gpH 2.2, activity about 0.2[mccarthy2020 R14]
ketoconazole; clozapine + 50 mM triethylamineabout 66 → 8.6; 53 → 25 mg/gpH 6.8[hate2020b R14]
ritonavir release + Vit E TPGS (28; 500 µg/mL)maximum 61; 69% against 50%; bound drug 90; 72 against 146 mg/gpH 6.8[dening2019 R17, R18, R19]
ritonavir release + SDS 28 µg/mLabout 50%; bound 135 mg/gpH 6.8[dening2019 R17, R19]
Pitfalls and disagreements

Two independent opposing effects (surfactant acceleration and polymer inhibition) would give the same pair ratios, so competition is untested ilevbare2012a X15. CAP Adp 0.85 with HPMCAS and CAPh lies in the SP range of HPMC, which did add to CAP Adp 0.85, so hydrophobicity does not explain the difference ilevbare2012a X8. Coverage with SDS was not quantified and the interfacial energy was not measured schram2016 X8. Mesoporous silica: the adsorption of the competitor itself (Vit E TPGS, triethylamine) on the silica was not measured [dening2019 C55; hate2020b X7]. Urea may lower adsorption by changing the drug's solubility and activity rather than by competing [dening2019 X12]. The "below monolayer" bound drug with Vit E TPGS depends on the drug load assumed [dening2019 X7]. The anionic SDS did not compete, which the authors attribute to repulsion from the negatively charged silica ("unlikely") [dening2019 C56]. The chapters differ in method: competition is inferred from growth-rate ratios on crystals ilevbare2012a X15 but measured as adsorbed amount on silica [dening2019 R8; hate2020b R14].

← Concepts and formulas

concept · as used in Dissolution

congruent release

Drug and polymer leave a dispersion at the same normalised rate, so release is governed by the polymer; typical of low drug loading, and the condition for fast, complete release of a copovidone dispersion li2020 C63. Above a drug-specific loading release becomes incongruent and falls to roughly that of the neat amorphous drug (see limit of congruency). In the bicalutamide dispersion, congruent release at 5 and 10% DL went with escape from matrix crystallization; the authors conclude that it "may be a strategy to avoid" it, yet a congruently releasing dispersion with 3% SDS still lost one of three replicates [moseson2022b C36, C48, C51]. In the Peptide permeability papers: The criterion extends from two components to three, and from a small molecule to a peptide with its permeation enhancer: in an octreotide–SNAC–copovidone dispersion all three components released at one normalized rate, which the authors call synchronous release bapat2025b C3, C15. It also survives a component that is not amorphous: both enhancers stayed crystalline in the dispersions and were still carried out with the polymer, which the authors attribute "likely" to the gel-forming properties of copovidone bapat2025b R17, C44. A second usage appears in the same subcategory under the name corelease, judged not by rates but by the times at which each component reaches its maximum release from a tablet, which were about 30 min for insulin and about 10–20 min for the enhancer [fagan2025 R20, C44, C46]; see peptide-enhancer co-release. New aspect (Release mechanism and LoC): in the release-mechanism papers of 2017–2020 congruent release is read from drug and polymer assayed separately from a compact of constant area, as equal rates normalized to each component's weight fraction (no significant difference by t-test) or as overlapping percent-release curves saboo2019 R8, E4; indulkar2019a R3. Congruent dispersions keep releasing into a medium presaturated with drug, which the authors take as proof of polymer control indulkar2019a R12, C43; indulkar2017b C35. The 2017 ritonavir study ties the colloid to release that is "congruent or close to congruent" purohit2017b C52, and the 2019 dihydropyridine study calls congruent release the "sweet spot" of dispersion dissolution because only it gave drug-rich droplets ("a clear link") saboo2019 C30. Congruent release ends at the limit of congruency, which lay between 5 and 30% drug in PVPVA, and with HPMCAS or Eudragit S 100 it lasted to 50% felodipine que2019 C10; indulkar2019a C2; saboo2020a R15. The papers of 2020–2022 add that congruent release can end after minutes when crystals form on the dissolving surface (indomethacin methyl ester–PVPVA congruent at 5 min up to 25%, over 30 min only at 5%) saboo2020 R3, R8, C17, that at the limit the polymer controls release whatever the compound que2021 C39, and that congruent release at a limit raised by a surfactant is slower than at lower loadings (≈1.8 against ≈2.95–3.2 mg/min/cm² for felodipine with 5% TPGS) saboo2021 X3. For ritonavir at 30%, one loading above its limit, every surfactant built into the dispersion removed the lag phase and gave congruent release for at least 20 min, but only Span 85 and TPGS kept it congruent to about 87–95% at 90 min indulkar2022 C31, X14. For two phenolphthalein analogues in PVPVA the morphology of the two phases after separation "appears" to differentiate congruent from incongruent release; during congruent release the drug is carried into the diffusion boundary layer by swelling and release of the polymer chains deac2023a C46, C47. Below the limit the surface drug/polymer ratio of PHPH (5%) and MePHPH (30%) compacts stayed constant during dissolution, as it must if both components release in the dispersion ratio deac2023b C24, C58. The papers of 2023–2025 extend the reading to HPMCAS, where indomethacin, its ester and four weak bases released drug and polymer at matching normalized rates, so that release "appear[s] co-dependent" bapat2024 C10, C23, and to PVP, where congruency was counted as more than 80% of both components and congruent dispersions released more slowly with higher-molecular-weight grades deac2024a C36, C19. In the PVP paper droplets in the gel are held until the polymer is dilute enough to leave and then leave with it, so congruent release is limited by water penetration and the release of chains deac2024a C34.

Findings

ASD process: F21, F24, F38, F40, F48. Peptide permeability: F4, F5, F6. Release mechanism and LoC: F1, F2, F3, F4, F6, F11, F12, F13, F15, F17, F19, F21, F23, F24, F25, F26, F27, F29, F31, F32, F33.

Related concepts

ends at the limit of congruency; the opposite is incongruent release; belongs to polymer-controlled release; the three-component case for a peptide plus an enhancer is peptide-enhancer co-release; still bounded by the limit of congruency and opposed by incongruent release; the accelerating effect of a co-formulated enhancer connects it to water sorption of the excipient blend. Read by the intrinsic dissolution rate of each component; contradicts the Higuchi two-component dissolution model at low loading; the condition for drug-rich nanodroplets to form; ended early by surface crystallization; coupled to the polymer's own dissolution rate, which a cationic drug can lower through drug-polymer ionic interactions.

Formulas

The same surface-normalized rate is used, printed here as Eq. 1 with the medium volume in the numerator; see surface-normalized release rate bapat2025b E1. Also congruent release relation and saturated-medium condition.

How it is measured or obtained

Constant-area dissolution of compacts with drug and polymer both assayed, expressed as normalised release rates or as fractions released; in the ASD process papers the surface-normalised dissolution rate of ritonavir–PVPVA was used and the congruent boundary of 25% DL was cited from earlier work li2020 P9, E13, R23. In the Peptide permeability papers: As before by constant-area dissolution with every component assayed and converted to a normalized rate, here at 0.5 cm² in 100 mL of 50 mM pH 6.8 phosphate buffer at 37 °C, with reversed-phase HPLC for peptide and SNAC and aqueous size-exclusion chromatography for copovidone bapat2025b P4, P2, E1. The new practical limit is analytical: sodium decanoate could not be quantified at all, so in every decanoate dispersion congruence rests on the peptide and the polymer and the enhancer's co-release is inferred ("presumably") bapat2025b R6, C19, X1. In the release-mechanism papers: Wood's apparatus or a die with one face of about 0.5 cm², drug by HPLC or UV, polymer by size-exclusion chromatography, light-scattering detection or colorimetry, and the rate A = kV/(SN) for each component indulkar2019a P2, P3, P4; saboo2019 P9, P10; saboo2020a E3, P7; bhardwaj2018 P6, P7, E4. Later variants: 5-min rates sampled every minute saboo2020 P5; the last loading with simultaneous release and at least 80% of the drug in 90 min que2021 P9; t-tests of normalized rates yang2021 P17; drug release alone hiew2022b X6.

Values in the library
materialvalue or classconditionspaper ids
ritonavir–PVPVAcongruent up to 25% DL; at 40–50% DL drug release like neat amorphous drugcitedli2020 R23, C63
ritonavir–PVPVA spray-dried, 25% DLrate about 3.5 mg·min⁻¹·cm⁻¹ from methanol, falling to about 0.90 with 60:40 water:methanolpH 6.5, 100 rpmli2020 R10
ritonavir–PVPVA, 50% and 75% DLabout 0.003–0.006 mg·min⁻¹·cm⁻¹, near neat amorphous drug (about 0.0026)sameli2020 R10
ritonavir–PVPVA (outside)congruent up to 25% DL; polymer leaves first above ittabletsindulkar2019a C2
felodipine ASDs (outside)PVP and HPMC congruent to 10% DL, PVPVA to 15%; HPMCAS and EUDS congruent to 50% DL37 °Csaboo2020a C12, C14
BCL–PVPVA 5 and 10% DL, solvent evaporateddrug about 91 and 96% and polymer about 90 and 97% of the dose at 10 min; ends about 91 and 96%dose of at most 30 µg/mL, pH 6.8[moseson2022b R6, R7]
BCL–PVPVA 30% DL with 1.5% SDScongruent; more than 80% in 30 min, about 90–94% at 4 hsame[moseson2022b R9, R13]
RTV–PVPVA 10 and 20% DL powders (below the limit of 25%)seven of eight coated powders about 94–97% at 60 minpH 6.8benson2025 R4
SNAC:copovidone 50:50congruent; ≈7.9 and ≈8.7 mg min⁻¹ cm⁻², about 4.4 and 2.7 times the neat rates; complete 25–30 minpH 6.8, 0.5 cm² compact, 37 °Cbapat2025b R2.d–e, R3, X18
octreotide:SNAC:copovidone, 1.6% peptidecongruent in three components; ≈8.1 / ≈8.4 / ≈8.9 mg min⁻¹ cm⁻²samebapat2025b R2.f–h, R5
octreotide:sodium decanoate:copovidone, 1.6% peptide≈23 and ≈25 mg min⁻¹ cm⁻² (peptide, polymer); complete in about 10 min; enhancer not assayedsamebapat2025b R2.j–k, R9, X1
SNAC:copovidone ratio seriescongruent within 30 min from 20:80 upward; 10:90 slower, complete within 40 minsame (SI, text only)bapat2025b R4, C14
sodium decanoate:copovidone ratio seriespolymer complete within about 10 min from 20:80 upward, by 25 min at 10:90same (SI, text only)bapat2025b R8, C18
cyclosporine:copovidone ± enhancer, 1.6% peptidepeptide follows polymer: about 50 min (binary), about 10 min (decanoate), ≈95% at 60 min (SNAC)samebapat2025b R10, C21
cyclosporine ternaries, 10–20% peptidenot congruent: polymer complete while peptide reaches ≈54.5% and ≈16% with decanoatesamebapat2025b R12.i, R13.i, C23
nifedipine 10 and 20% with HPMC-E5 or PVPVAcomplete release in ~20 and < 5 min, also into water saturated with drug5 °C, D2Oindulkar2017b R8, R9, C35
ritonavir 10:90 films, PVP, PVPVA, HPMCASdrug and polymer dissolved at the same rate; the polymer almost completely in < 10 min25 °C, pH 6.8purohit2017b C52, R15, R16, R17
ritonavir 50:50 HPMCAS filminitially congruent (≈32–34 µg/mL drug within 5 min)samepurohit2017b R17, C38
ITZ–PVPVA 10% spray-driednormalized drug ≈2000 against polymer ≈2265 µg/min/cm²0.1 N HCl, 37 °Cbhardwaj2018 R11
ritonavir–PVPVA 10, 20, 25% tablets≈97–100% of both by 60 minpH 6.8, 37 °Cindulkar2019a R3, R11
ledipasvir–PVPVA 2 and 5%about 100% of both by 60 minpH 6.8, 37 °Cque2019 R3, R4
ledipasvir–PVPVA with 5 parts SDS, 7.5–30%congruent to 30%; fails at 40%sameque2019 R7, R8, R9
nilvadipine 5–10%, cilnidipine 5–15% in PVPVAdrug 2.13–2.53 = polymer 2.35–2.76 mg/min/cm² (ns)pH 6.8, 37 °Csaboo2019 R5, R6, R8
felodipine with HPMCAS (10–50%) and EUDS (10–50%)drug = polymer at every loading; HPMCAS ≈0.13–0.93 mg/min/cm²pH 6.8; EUDS pH 7.4saboo2020a R14
nilvadipine, felodipine, cilnidipine 40% in HPMCAS0.42/0.42, 0.34/0.32, 0.26/0.24 mg/min/cm²samesaboo2020a R16
indomethacin; its methyl ester in PVPVAIND 5, 10%: ≈3.44/3.47, 3.14/3.19; INDester 5–25%: ≈3.3–4.2 mg/min/cm² (drug/polymer, 5 min)pH 2.1 / 6.8, 37 °Csaboo2020 R3, M5, M6
indomethacin methyl ester–PVPVA 10–25%congruent at first, drug levels off after 7.5–20 min30 min, 37 °Csaboo2020 R8
four phenolphthalein analogues at their limitsdrug ≈2.9–3.7, polymer ≈2.8–3.4 mg/min/cm² (p = 0.022–0.67)pH 6.8 (TIPP 2.5)que2021 R21, P9
felodipine–PVPVA with 2, 5, 10% TPGScongruent to 25, 35, 45%pH 6.8, 37 °Csaboo2021 R12, P6
loratadine–PVPVA; –HPMCASto 30% and 20% at 37 °C; 2% and 5% at 5 °Ccompacts, t-testyang2021 R22
clopidogrel–PVPVAclose to congruent to 40%; 50% with SDScompactscorreasoto2022a C46, C55
atazanavir–PVPVA5%; 10% with SDS or CTAB; 15% with Span 80compactscorreasoto2022b C12
ritonavir–PVPVA 30:70 with 5 parts Span 85, TPGS; SDS; Span 20; Tween 80congruent for at least 20 min with every surfactant; ≈87–89% (Span 85, TPGS), ≈78% (SDS), ≈41%, ≈25% of the drug at 90 minpH 6.8, 37 °Cindulkar2022 C31, R8, R9, R5, R7, R6
miconazole 20% on HP-50; on HP-50-Na; on PTEAincongruent and slow, drug ≈8.6% at 60 min; drug ≈89.5 and 83.7% at 60 min with the polymer aheadcompacts, 50 mM pH 6.8 phosphate, 37 °Cqi2022 R14, C22
ritonavir–PVPVA 20%; 30%; 40–50%congruent and complete; drug ≈35% with the polymer ahead; drug ≤3% at 90 mincompacts, pH 6.8, 37 °Cyang2022a R2, C12, C13
indomethacin–HPMCAS-MF 10%; its methyl ester 10%drug and polymer at the same normalized rate within error, ≈0.12 → 0.82 mg/min/cm² over 3–51 mM/ΔpH; rates comparablepH 6.8 phosphate and FaSSIFbapat2023 R9, R10, R13, C16
atazanavir–PVPVA 20% with TEAC, TBC, TBAC; at the limit, 25%drug ≈4.6–5.1 mg/min/cm²; ≈2.0–3.1 against neat PVPVA ≈2.7compacts, pH 6.8, 37 °Ccorreasoto2023 R6, R7, C13
MePHPH–PVPVA 20, 40, 50, 70%; PHPH–PVPVA 5, 20%drug ≈96 / 61 / 15 / 0%; ≈75 / 0% at 30 mincompacts, pH 6.8, 37 °Cdeac2023a R1, R2
PHPH–PVPVA 5%; MePHPH–PVPVA 30% compactssurface drug content constant over 60 minATR-FTIR of dried surfacesdeac2023b R6, R7
indomethacin, indomethacin methyl ester–HPMCAS-MF 5–60%drug ≈0.85 → 0.50 and 0.66 → 0.39 mg/min/cm² with the polymer alongsidecompacts, pH 6.8 phosphate, 37 °Cbapat2024 R2, R3, C10
loratadine 25% in HPMCAS LF, MF, HFdrug/polymer ≈0.25/0.27, 0.10/0.12, 0.01/0.02compacts, pH 6.8bapat2025a R2, C13
clotrimazole–PVP K25 20%, K29/32 30%, K60 35%, K90 38%congruent (>80% of both components)compacts, pH 8.0, 90–120 mindeac2024a R1, R2
ritonavir–PVPVA 30% + Span 20congruent for 20 min (≈48% drug, ≈50% polymer), then ≈92–97% drugcompacts, pH 6.8yang2023 R2, R3, C13
Pitfalls and disagreements

No numerical criterion is given for "congruent" in the ritonavir study indulkar2019a X7. Phase separation can raise or lower release depending on loading regime and on where the drug-rich phase ends up li2020 C64. The limit of the bicalutamide pair was not located and lies between 10 and 20% DL [moseson2022b X15]. A congruent SDS dispersion failed after milling [moseson2022b C51]. Peptide permeability: The loading boundary for a peptide is far lower than the values recorded for small molecules on this page: for cyclosporine in copovidone it lies between 1.6% and 5% peptide, and the paper gives neither a threshold nor a mechanism for the change bapat2025b C5, C22, C45. Congruence was asserted for systems where it was not computed: no normalized rate exists for any cyclosporine dispersion, and at 1.6% loading with SNAC the peptide in fact lagged (≈75.5% against ≈85% enhancer and ≈89.5% polymer at 30 min) bapat2025b X2, R10.f. The claim that a low peptide fraction removes the effect of peptide solubility holds for the decanoate ternaries but not for the SNAC ternaries bapat2025b C41, X3. The rates of the fastest systems rest on two or three points, because the compacts were nearly empty by the second sample bapat2025b X8. Several profiles plateau at ≈100–110% without a compact assay bapat2025b X9. Finally, congruent release of peptide and enhancer has not been shown to improve anything downstream: no permeability or absorption was measured [bapat2025b C6; fagan2025 C45]. In congruent dispersions the polymer still left more slowly than from a neat compact (2.35–2.76 against 3.49 mg/min/cm² for PVPVA; 0.22–0.29 of the neat rate for 10% ITZ), which the authors put "most likely" down to the drug's hydrophobicity or drug–polymer interactions saboo2019 R8, C13; bhardwaj2018 R12, C49. The link between congruency and droplets partly follows from how much drug had been released at the time of sampling saboo2019 X14. The neat PVPVA compact of the ledipasvir study weighed 250 mg against 100 mg for the dispersions que2019 X13. A congruency read-out over 5 min can miss later surface crystallization saboo2020 X7, and the criteria for the limit differ between papers que2021 P9; hiew2022b X6. For the miconazole dispersion on HP-50-Na the authors state polymer release "at the same normalized rate as the drug", but polymer percent release runs above drug release from 20 min (≈40.8 against ≈31.6%) qi2022 C22, X4. In the slowest HPMCAS-HF systems the drug left at about half the polymer's rate although the authors call release approximately congruent bapat2025a X6, C13. With SDS at 40% ritonavir release was already incongruent at 15 min, against the authors' "congruent" for the first 30 min yang2023 X4, C4.

← Concepts and formulas

concept · as used in Dissolution

critical entanglement molecular weight

Evidence table: critical entanglement molecular weight (names merged there: critical entanglement molecular weight, critical molecular weight for entanglement). Content from the release-mechanism chapter (2023–2025).

The molecular weight above which chains of a polymer entangle. Polymers above it are expected to form a gel layer in a good solvent because solvent penetrates faster than the chains disentangle; polymers near or below it may still form a swollen gel through viscosity effects (cited) bapat2023 C34. HPMCAS-MF, of about 18,000 Da, is below the critical values estimated for other polysaccharides, which with the rotation data led the authors to judge it "unlikely" to entangle bapat2023 C45. The 2024 PVP paper computes M_c \approx 30\,C_\infty M_0 = 46,620 g/mol for PVP (C_\infty = 14, M_0 = 111 g/mol), between K25 and K29/32, and places the rise of the clotrimazole limit from 20 to about 33% close to it deac2024a E1, C16, C37.

Findings

Release mechanism and LoC: F23, F29.

Related concepts

threshold for polymer chain entanglement; decides whether dissolution goes through polymer chain disentanglement in a gel layer.

Formulas

critical molecular weight for chain entanglement.

How it is measured or obtained

Taken from estimates for other polysaccharides, without a reference bapat2023 R27.

Values in the library
materialvalue or classconditionspaper ids
pullulan; curdlan; xanthan≈22; 24; 34 kDa (estimates, no reference given)bapat2023 R27
HPMCAS-MF≈18 kDabapat2023 C45
PVPM_c = 46,620 g/molWool estimatedeac2024a E1
Pitfalls and disagreements

The polysaccharide values carry no reference, and no value for HPMCAS itself is given bapat2023 R27. K25, below M_c, already reached a limit of 20%, so the rise spans K17 to K29/32 deac2024a X9.

← Concepts and formulas

concept · as used in Dissolution

critical ionization for polymer dissolution

Evidence table: critical ionization for polymer dissolution (names merged there: critical ionization, critical ionization extent, critical ionization fraction, polymer ionization threshold). Content from the release-mechanism chapter (2022–2025), with rows from the Miscibility and drug-polymer interactions chapter.

The minimum fraction of the acid groups of an enteric polymer that must be ionized before its chains dissolve; below it the polymer does not dissolve, or dissolves slowly, whatever the bulk pH. In the Miscibility chapter it was written with the Willson model, dissolution rate ∝ [A⁻]/[HA], and used to explain why CAP and HPMCP dispersions with a basic drug that ties up some acid groups release poorly or slowly hiew2022a E2, C57. For HP-50 the critical ionization of about 83% taken from that work "may explain" the almost 2-fold drop of the dissolution rate of BIS-TRIS salts from 100 to 80% ionization, "perhaps" because hydrophobic ionizable polymers need a minimum ionization to dissolve qi2022 C36, R19. For HPMCAS-MF no polymer dissolved in FeSSIF V1 at pH 5.0, "presumably" because the threshold ionization was not reached, and near the threshold pH (FeSSIF-V2, pH 5.8) dissolution was slower than in phosphate of corresponding buffer capacity bapat2023 C14, C12. The 2025 papers apply the model to drug–polymer complexes: a drug that binds the carboxylates and blocks their hydration "can impact" dissolution, the more succinoylated HPMCAS-LF is proposed to need less ionization to dissolve by analogy with maleic anhydride copolymers, and about 77% ionization is estimated for HPMCAS from a threshold pH of 5.5 bapat2025a C2, C3, C25; kaur2025 C28, C46.

Findings

Release mechanism and LoC: F23, F24, F32, F33.

Related concepts

a threshold of polymer ionization and of ionization; reached or not according to the microenvironmental pH and the polymer pKa; bypassed by polymer salt formation; behind the pH-dependent polymer solubility of enteric polymers.

Formulas

The Willson relation is printed only in the Miscibility chapter hiew2022a E2; no shared formula page.

How it is measured or obtained

By extrapolating literature dissolution data of the neat polymer against the ionized fraction or pH hiew2022a R27; indirectly, from dissolution of partially neutralized salts against the amount of base added qi2022 R13 or from media of different pH bapat2023 R5, R8.

Values in the library
materialvalue or classconditionspaper ids
CAP; HPMCP (Miscibility chapter)≈0.94; slightly less than 0.83extrapolated from literature datahiew2022a R27
HP-50 (HPMCP)≈83% (cited)qi2022 R19
HP-50-BIS-TRIS salts, 20–100 mol% baserate ≈1.22 → 2.93 mg/min/cm², largest step from 80 to 100%50 mM pH 6.8 phosphateqi2022 R13
neat HPMCAS-MF in FeSSIF V1no dissolutionpH 5.0bapat2023 R8
HPMCAS (pKa ≈5.0), threshold pH 5.5≈77% ionization to start dissolvingestimatekaur2025 C28
HPMCAS LF, MF, HF1.52, 1.19 (cited), 0.76 mmol/g COOH; pKa 4.91, 4.97, 5.06titrationbapat2025a M3, M4, M5
Pitfalls and disagreements

The ionization of the partial BIS-TRIS salts was not measured: the axis is mol% base added, read as % ionization, and the 0% point is HP-50 in sodium phosphate buffer, not a salt qi2022 X9. The HPMCP value comes from an extrapolation whose relation is not printed hiew2022a R27. The critical ionization of the grades was not measured; the LF argument is an analogy bapat2025a X11. The acid content of HPMCAS-LF is 1.52 ± 0.03 mmol/g as titrated in the grade paper and 1.54 mmol/g (printed as mM per gram) as cited in the bedaquiline paper bapat2025a M3; kaur2025 M2.

← Concepts and formulas

concept · as used in Dissolution

critical micelle concentration

The surfactant concentration above which micelles form; Tween 80 was used above its CMC of 23.6 µg/mL (0.018 mM) ilevbare2013a M11. The authors also invoke the U-shaped temperature dependence of surfactant CMCs (minimum typically at 20–40 °C) as an analogy for the U-shaped LLPS concentration of ritonavir ilevbare2013a C47. The papers of 2017–2022 add that the CMC of SDS in 50 mM pH 6.8 phosphate at 37 °C was 0.5 mg/mL against 2.4 mg/mL in water, attributed to ionic strength, with aggregation numbers of 60, 58 and 65 at 1, 2 and 3.6 mg/mL indulkar2017a R1, R2, R3, C10. The six bile salts have reported CMCs of 2–12 mM, and 1.86 and 12 mM were taken as monomeric and micellar levels, assuming telaprevir does not shift the CMC lu2017b C42, M3. New aspect (Bioperformance): above the CMC the micelles begin to solubilize drug, so the CMC marks where solubilization starts [raina2015c A2]. New aspect (Crystallization from solution): the binary-additive study kept both surfactants far below their CMC so that micellar solubilization was excluded and any effect on growth had to come from adsorption at the crystal interface: Tween 80 at about 0.018 mM (about 24 µg/mL) and TPGS at 0.02 wt% (printed as about 212 µg/mL) against 5 µg/mL used ilevbare2012a M16, M17, C52. Other CMCs used: STC 0.97% and SDS 0.24% in water (cited); STC 0.48% and SGC 0.46% w/v in the presence of celecoxib (about 8.9 and 9.4 mM by the card's conversion) chen2015 M1, M4; li2016a R12, X16. New aspect (Supersaturation from ASD dissolution): in the celecoxib suspension study the CMC is read with the drug present at saturation, because a drug can shift it: the break point where two straight lines of solubility against surfactant concentration meet chen2015a P8, E2. With lopinavir at saturation in pH 3 citrate buffer the CMCs were lower than with celecoxib in pH 3 HCl (SDS 0.050 against 0.23%), and dissolved polymer moved them: HPMCP shifted the SDS break to about 0.1%, and with PVPVA and HPMCAS-HF the lopinavir solubility rose from about 0.025% SDS li2016b R1, R11, R18, X9; chen2015a R4. New aspect (Release mechanism and LoC): for surfactants built into a dispersion, the CMC is the reference for whether the released surfactant can solubilize drug in the bulk medium; in the ledipasvir study the surfactant concentration after complete release stayed below the reported CMCs, so bulk solubilization is taken as negligible que2019 C51. With TPGS in felodipine dispersions and four surfactants with clopidogrel the CMC was measured in the release medium with and without dissolved polymer saboo2021 R1; correasoto2022a R1; 2% TPGS raised the felodipine limit while the released TPGS stayed below the CMC, so micelles play "a negligible role" saboo2021 C33.

Findings

Amorphous solubility and LLPS: F9, F12, F17, F18. Bioperformance: F3, F9, F22. Crystallization from solution: F18, F28, F29, F31, F32, F38, F39. Supersaturation from ASD dissolution: F14, F19. Release mechanism and LoC: F13, F21.

Related concepts

defines micellar solubilization; analogy used for liquid-liquid phase separation of ritonavir. Limits the micelle-water partition coefficient. Related to polymer-surfactant interaction, interfacial tension and hemimicelle; related to surfactant-induced crystallization; related to the hydrophilic-lipophilic balance of the surfactants.

Formulas

CMC from the solubilization break point (printed in words; no shared page) chen2015a E2.

How it is measured or obtained

The Tween 80 value is a footnote of Table 7 and not measured in the paper ilevbare2013a M11. Emission maximum of pyrene carboxaldehyde against SDS concentration, and static quenching of pyrene by dodecyl pyridinium chloride for the aggregation number indulkar2017a P1, P2; in a companion paper surface tension with 60 µg/mL telaprevir gave about 4 mM for STC and about 2 mM for SGDC lu2017 R5. In the additive study the CMC was taken from the literature [raina2015c A2]; elsewhere it was read from pyrene emission, surface tension or solubility breaks indulkar2017a R1, R2. In the PAMPA study of hate2022 it was measured by pyrene fluorescence for SDS and CTAB in a buffer at 37 °C [hate2022 R12]. In the binary-additive study not measured; the CMC values are literature values at 37 °C ilevbare2012a M16, M17. In the bile-salt papers from celecoxib solubility against bile salt concentration (intercept of two lines) or surface tension against log concentration li2016a P7; lu2017 P5. In the celecoxib suspension study: from Form III solubility at a series of surfactant levels in pH 3 HCl, 25 °C chen2015a P6, P8. In the release-mechanism papers: Cited CMCs compared with the surfactant delivered by the dose que2019 C51, X19. Drug solubility against surfactant level and the pyrene I1/I3 ratio, with 900 µg/mL PVPVA giving a critical aggregation concentration saboo2021 P1, P2; pyrene and Wilhelmy surface tension correasoto2022a P4, P5.

Values in the library
materialvalue or classconditionspaper ids
Tween 80CMC 23.6 µg/mL (0.018 mM)used at 500 µg/mLilevbare2013a M11, R16
SDSCMC 0.5 mg/mL (buffer); 2.4 mg/mL (water, cited); Nagg 58–6550 mM pH 6.8 phosphate, 37 °Cindulkar2017a R1, R2, R3
STC; SGDCCMC about 4 mM; about 2 mMpH 6.5 buffer, 37 °C, with and without 60 µg/mL telaprevirlu2017 R5
Vit E TPGS / Cremophor EL / RH40 / Tween 200.02 / 0.01 / 0.03 / 0.009%levels C1–C3 chosen around it[raina2015c A2]
SDS in the telaprevir ASDfinal about 15 µg/mL, far below CMC37 °C[mosqueragiraldo2018b R21, C48]
taurocholate, glycocholate0.48% and 0.46% (w/v)pH 6.5li2016a R12
SDS; CTABSDS 0.5 mg/mL (0.05% w/v); CTAB 0.05 mg/mLpyrene fluorescence, 37 °C, buffer[hate2022 R12]
SDS in the PAMPA receiversink effect from 0.15%, no further rise up to 2%atazanavir 150 µg/mL[hate2022 R13, C29]
Tween 80CMC 0.018 mM, about 24 µg/mL5 µg/mL used (about a fifth)ilevbare2012a M17, R17
TPGSCMC 0.02 wt%, printed as about 212 µg/mL (about 200 µg/mL at unit density)5 µg/mL usedilevbare2012a M16, X16
TPGS with and without 900 µg/mL PVPVA (ASD dissolution chapter)about 50 µg/mL; about 40 µg/mL with PVPVA (49 ± 4 and 41 ± 3 µg/mL as printed)pH 6.8, 100 mM buffer, 37 °Csaboo2021 R1
SDS in 50 mM phosphate pH 6.8CMC 0.5 mg/mL (cited); induction-time effect from about 0.075 mg/mL, none further above the CMCatazanavir, 37 °Cindulkar2019b M2, R3
SDS with 1 mg/mL polymercritical aggregation concentration 0.1 (PVPVA), 0.2 mg/mL (HPMC-606, HPMCAS-MF)pyrene I1/I3, no drugindulkar2019b R8
lyso-PC against PClower CMC and higher surface activity (cited)reasoning for faster nucleation with digestsenright2020 C22
SDS with celecoxib at saturation0.23%pH 3, 25 °Cchen2015a R4
STC0.69% in the text, 0.668% on the figuresamechen2015a R4, X1
polysorbate 80; Poloxamer 188; Triton X1000.0058%; 0.16%; 0.022%samechen2015a R4
SDS / Poloxamer 188 / polysorbate 80 / STC with lopinavir0.050 / 1.40 / 0.020 / 0.73%pH 3 citrate, 25 °Cli2016b R1
SDS with lopinavir and HPMCPbreak near 0.1%pH 3, 25 °Cli2016b R11
ledipasvir–PVPVA with 5 parts surfactant per 100at most ≈0.048 mg/mL surfactant in the medium after complete release (synthesis: 0.048/0.5 ≈ 0.1 of the SDS CMC in buffer indulkar2017a R1)100 mg compacts, pH 6.8que2019 X19
SDS, CTAB, TPGS, Tween 80487 ± 34, 50, 40, ≈14 µg/mL50 mM pH 6.8, 37 °Ccorreasoto2022a R1
SDS, CTAB, TPGS, Tween 80, Span 20, Span 80, Span 85500, 50, 40, 14, 7.3, 14, 5–50 µg/mLas listedcorreasoto2022b M3, M4, M5, M6, M7, M8, M9
Pitfalls and disagreements

The micelle-like origin of the ritonavir profile is "surmised", with no structural data ilevbare2013a C47. The CMC of the other four bile salts in the telaprevir medium was not measured, and the CMC of SDS in buffer is lower than in water lu2017 C14; indulkar2017a C10. The CMC basis (w/v or w/w) and source are not printed in Table I of the additive study [raina2015c A2]. In the PAMPA study the receiver sink effect is said to be available at 0.15% SDS, three times the CMC read by pyrene (0.05%); whether 0.15% is a tested level or a misprint is unclear [hate2022 R12, R13, X6]. The two printed TPGS values (212 and about 200 µg/mL) agree only at unit density; both are far above the 5 µg/mL used ilevbare2012a X16. Ritonavir solubility in 5 µg/mL Tween 80 was 1.3 ± 0.02 µg/mL, so no solubilization is expected below the CMC ilevbare2012a R1.g. Most dihydroxy conjugates and SLC have literature CMCs at or below the 1.86–2.51 mM used, so the monomer assumption is uncertain; CMCs were measured for two bile salts only in the telaprevir study li2016a X16; lu2017 X7. The Poloxamer 188 CMC rests on solubility changes of 0.1–0.2 µg/mL and is weakly determined chen2015a X20. The test levels lie 6–14% above the printed CMCs, not exactly 11% chen2015a X2. SDS and STC acted below their CMC as well chen2015a C6. The authors place an aggregation onset with PVPVA below 0.01% SDS, whereas the plotted rise begins between 0.01 and 0.025% li2016b X9. Below the CMC in the bulk, the surfactant concentration at the dissolving surface was not known que2019 C53. Only about half the TPGS had been released at 60 min, so the bulk stayed below the CMC in every felodipine case saboo2021 X14; one paper prints the TPGS CMC as 40 and as about 50 µg/mL correasoto2022a X1.

← Concepts and formulas

concept · as used in Dissolution

critical point

Evidence table: critical point (names merged there: critical point, plait point). Content from the release-mechanism chapter (2023–2025).

The point on the binodal of a ternary diagram at which the two coexisting phases have the same composition; the 2023 dissolution papers call it the plait point. Because the volume of the hydrophobic phase decides whether it forms a network, a hydration path entering the two-phase region on the high-drug side of the plait point (through the hydrophobic binodal) makes the hydrophobic phase the majority and "should" give a continuous network, one entering on the other side a discrete phase; the plait point position therefore approximates the maximum limit of congruency of a system deac2023a C68. Associative systems have the plait point on the low-drug side and can have a low maximum limit, segregative systems on the high-drug side and a higher one, and a smaller miscibility gap also favours a higher maximum limit deac2023a C69. Strong drug–polymer interactions are proposed to lower the limit by shifting the plait point to a lower drug/polymer ratio, which raises the polymer content of the hydrophobic binode and the hydrophobic-phase volume at a given load deac2023b C63, C49. In 2024 the critical point was computed for the four analogues, the drug-rich fraction jumping across it, and its loading followed the cited limits in order, so the authors propose it as "a surrogate" for phase inversion and the limit deac2024b R35, R37, C64.

Findings

Release mechanism and LoC: F27, F30.

Related concepts

end point of the binodal and of the tie lines on the ternary phase diagram; sets the step of the lever rule; shifted by associative phase separation; approximates the maximum limit of congruency.

Formulas

none.

How it is measured or obtained

Not measured in these papers; placed on schematic diagrams deac2023b X14. Computed in 2024 with PC-SAFT for four drug–PVPVA–water systems; not measured deac2024b P19, X7.

Values in the library
materialvalue or classconditionspaper ids
associative phenolphthalein analogues (PHPH, TIPP)plait point on the low-drug side, low limit (5, 10%, cited)schematicdeac2023b C49, R8
segregative analogues (MeTIPP, MePHPH)plait point on the high-drug side, higher limit (30, 40%, cited)schematicdeac2023b C48, R8
MePHPH–PVPVA–water≈29 wt% drug, 59 wt% PVPVA, 12 wt% water (≈33% loading)PC-SAFT, 37 °Cdeac2024b R22, R35
PHPH–PVPVA–water≈2.6 wt% drug, 59.5 wt% PVPVA, 38 wt% water (≈4.2% loading read from the diagram, synthesis: 2.6/(2.6 + 59.5) ≈ 0.042; 3.7% as the paper states)samedeac2024b R23, R35
four analogues≈33.2 / 32.6 / 13.7 / 3.7% loading against cited limits 40 / 30 / 10 / 5%samedeac2024b R37
Pitfalls and disagreements

The central mechanism of the 2023 paper is drawn on schematic diagrams, one with horizontal tie lines; no diagram, tie line or plait point was measured and the link to the limit rests on the rank order of four analogues deac2023b X14. For PHPH the computed critical point (3.7%) lies below the film switch (10–15%) of the same paper deac2024b X5. Two values stand for the PHPH critical point: the paper states 3.7% loading, while the point read from its PHPH–PVPVA–water diagram (about 2.6 wt% PHPH, 59.5 wt% PVPVA) corresponds to about 4.2% (synthesis: 2.6/(2.6 + 59.5) ≈ 0.042), a difference within the precision of reading the plot deac2024b R23, R35, R37.

← Concepts and formulas

concept · as used in Dissolution

crystal defects

Imperfections in a crystal (vacancies, impurities, dislocations, grain boundaries, growth irregularities) that are higher-energy, more mobile sites, may start phase transformations, have been linked to faster dissolution and impose local stress [moseson2019 C3]. In HME residual crystals they appear as edge dislocations, bend contours and lattice planes sheared into several orientations [moseson2018a R12, R13, R15, R16]. In the dissolution papers defects are used to explain why residual crystals seed more strongly than bulk crystals: cryomilled crystals and residual crystals grow needle-like crystallites from all surfaces with PVPVA, "suggesting underlying disorder", but no defect measurement is made moseson2020a C23, C40; moseson2021 C66. Defect density of input crystals was proposed as a critical material attribute for the speed of amorphization but was inferred, not measured, from the order of dissolution of lots with the same median size: the agglomerated lot dissolved faster than a lot with a near-identical size distribution [moseson2022c C44, C46, X6]. Crystals with rough surfaces or grain boundaries are said to dissolve first at high-energy sites and to split [moseson2022c C45, C51].

Findings

F12, F13, F26, F36.

Related concepts

includes bend contours and grain boundary; start fragmentation-based dissolution.

Formulas

none.

How it is measured or obtained

Not measured quantitatively in the library: defects are inferred from Fourier-filtered TEM images (inverse FFT of one spot pair), from TEM contrast of grain boundaries, and from SEM and PLM of growth irregularities [moseson2018a P8; moseson2019 R1, R2, R3].

Values in the library
materialvalue or classconditionspaper ids
IDM crystals, unheatedgrowth irregularities, surface imperfections; grain boundaries dividing one crystal into three regions; surface crystallites and bend contoursSEM, PLM, TEM[moseson2019 R1, R2, R3]
IDM residual crystals in an extrudateedge dislocations, bend contours, one lattice spacing in three orientationsTEM, inverse FFT[moseson2018a R12, R13, R15]
tacrolimus crystals from amorphous powderhigh defect level suspected because the sample stays above the crystalline solubilitydissolutionpurohit2019 C38, C47, C48
cryomilled IDM crystals and HME 117-2 residual crystals grown 24 h with 50 µg/mL PVPVAneedle-like γ crystallites 170 ± 60 and 230 ± 80 nm wide from all surfaces; bulk crystals grow smooth or striated platesSEMmoseson2020a R14, R15, R13
residual crystals in BCL–PVPVA extrudatescalled "highly defective" and "commonly more potent" than bulk seeds, from the literature and growth ratescitedmoseson2021 C66, C74
BCL lots L37 (agglomerated), L38 (rough), L42 (milled), L93 (smooth)defect density not measured; ranking inferred from PXRD at Tc30% BCL–PVPVA, 145 °C[moseson2022c X6, R10]
Pitfalls and disagreements

Defect density was not quantified, and bending or beam damage of thin organic crystals is not excluded as a source of bend contours [moseson2018a X5, X6]. The cited faster dissolution of crystals with higher defect density is not a measurement made in the ASD process papers [moseson2019 R23, X6]. The surface area and defect density of the residual crystals were not measured moseson2020a X9; moseson2021 X10. The inference for the agglomerated lot rests on the 5 min point; at 4 min L37 was still higher than L38 and their coarse tails differ [moseson2022c R10, R1, X5].

← Concepts and formulas

concept · as used in Dissolution

crystal dissolution into a polymer melt

The process by which drug crystals suspended in a softened polymer dissolve into it, below the drug's melting point and above the polymer Tg, forming the homogeneous melt that becomes an ASD on cooling. It is usually described by the Noyes–Whitney equation with a diffusion boundary layer [moseson2018 C50, C52; moseson2019 C39, C40]. Crystals also break up while dissolving (fragmentation-based dissolution), which the diffusion picture does not contain [moseson2019 C43, C44]. A crystalline physical mixture lags a dispersion in thermogravimetry when the crystals are large, because the crystals must first dissolve at a rate set by particle size and the drug then diffuse through the viscous melt; in DSC of miscible extrudates this process appears as a dissolution endotherm instead of a melting peak [moseson2020 C33, R13; moseson2021 C12]. At Tc the melt is most viscous, diffusion slowest and the gradient smallest, so differences between lots of input crystals show most there [moseson2022c C37, C39, C40]. A model with dissolution alone cannot finish within 20 min, whereas one with breakage scaled by the share of agglomerates fits four lots [moseson2022c R12, R16].

Findings

F9, F11, F12, F13, F10, F31, F36, F37.

Related concepts

limited by the diffusion boundary layer; includes fragmentation-based dissolution; governed by the HME operating design space; leaves residual crystallinity.

Formulas

Noyes–Whitney equation, Stokes–Einstein equation.

How it is measured or obtained

Isothermal hot-stage microscopy without mixing (time to loss of birefringence), variable-temperature XRD, SEM-EDX chlorine maps of drug in the polymer and TEM of films held at temperature [moseson2018 P10, R13; moseson2019 P3, P4, P5, P6, P7]. Nonisothermal TGA of a dispersion against crystalline physical mixtures with micronized (3.5 µm) or large (93 µm) crystals [moseson2020 P3, R13]; the broad endothermic shift of the non-reversing heat flow over 120–170 °C of a 30% crystalline extrudate moseson2021 R7. Residence-time series in a 5 mL recirculating micro-extruder (50 rpm, 145 ± 1 °C, 2–20 min) read by PXRD, with a population balance model fitted to the crystallinity [moseson2022c P15, P16, P18, P19].

Values in the library
materialvalue or classconditionspaper ids
IDM in PVPVA (117-2 powder, no mixing)≈0.01 h at 161 °C; ≈0.32 h at 138 °C; ≈1.86 h at 131 °C; ≈7.8 h at 126 °C; ≈20.2 h at 121 °Chot stage, n = 3[moseson2018 R13]
IDM crystals in copovidone 1:5 at 130 °Cgradient about 7–9 µm after 1 h; plateau about 2.8–3.1 atomic % Cl over about 31–73 µmSEM-EDX[moseson2019 R9]
IDM extrudate at Tcdefective crystals <100 nm, amorphous channels, a dissolution frontTEM[moseson2018a R9, R13, R14]
30/70 BCL–PVPVA, mixtures against the dispersion3.5 µm mixture tracks the dispersion; 93 µm mixture lags by about 10 °C at 1–10 °C/minnonisothermal TGA[moseson2020 R13]
diffusion layer of an IDM crystal in a polymer film (cited)on the order of 8 µmhigh temperature, quiescent[moseson2020 R21]
30:70 BCL–PVPVA extrudates at 155 °C from 3.5, 38 and 93 µm crystalsbelow 1%, 3.5% and 30% crystals left5 mL extrudermoseson2021 R6, M2, M3
30% BCL–PVPVA at Tc = 145 °C, lots of D50 3.51 / 37.0 / 38.0 / 42.2 / 92.7 µmbelow the limit of detection at 2 / 5 / 6 min; about 2.5% and 15.0% at 20 min for the last twoPXRD[moseson2022c R10, R1]
population balance model, dissolution only26–73% crystallinity left at 20 min with 0.5 µm/s; 3–61% with 4 µm/sfour lots[moseson2022c R12]
same with breakage scaled by % agglomeratesdissolution rate constant 0.1002 ± 0.0511 µm/s; breakage rate constant 0.355 ± 0.111fitted to PXRD[moseson2022c R16]
BCL crystals in PVPVA film, 170 °C, no mixingthe rough-surfaced crystal splits at 10–15 min; the agglomerate breaks apart; fines of the milled lot vanish while a large crystal barely changeshot-stage PLM[moseson2022c R11]
Pitfalls and disagreements

The hot-stage sample was a partly dissolved extrudate, not a physical mixture [moseson2018 X8]. Between Tc and Tm dissolution was slower than melting because of lower thermal input, higher viscosity and no mixing [moseson2018 C33]. The nanoscale sequence of fragmentation is assembled from different particles [moseson2019 X11]. In DSC of miscible extrudates the crystals dissolve during the scan, so DSC under-reads them moseson2021 C12, C36. The fitted dissolution rate constant lies 5–40 times below the assumed values (0.5 and 4 µm/s), which the authors relate to melt viscosity; the printed sign conventions disagree and the size-dependence parameters are undetermined [moseson2022c R16, C30, X11, X21]. The supporting images are quiescent PLM at 170 °C, 25 °C above the melt temperature of the extrusions [moseson2022c X18].

← Concepts and formulas

concept · as used in Dissolution

crystal growth inhibition

Reduction of the crystal growth rate by an additive, here dissolved PVPVA or HPMCAS, expressed as the effectiveness ratio E_G=R_{G,np}/R_{G,p}, the growth rate without polymer over the rate with it moseson2020a E2; moseson2021 E1. The mechanism proposed is surface poisoning: polymer globules adsorb on the crystal face and the adsorbed network "appears to limit the sites available for molecular integration" moseson2020a C48, C50. HPMCAS at nine times the drug concentration slowed seeded growth of posaconazole in FaSSIF V2 but did not stop it at 100 µg/mL drug: 10 µg/mL seeds left 43.5% at 30 min against 4.5% without polymer shah2024 R22. New aspect (Crystallization from solution): The slowing of the growth of drug crystals in a supersaturated aqueous solution by a dissolved additive, usually a polymer, expressed as the ratio of the initial growth rate without additive to that with it, E_g = R_{g0}/R_{gp}; above 1 the additive inhibits growth, below 1 it accelerates it ilevbare2013b E5; ilevbare2012a E3, E4. In these papers it is a kinetic effect at constant solubility, shown by solubility controls with the polymer ilevbare2012c R1, C16. It is the solution counterpart of the growth inhibition in supercooled liquids described below and is one of two steps of crystallization inhibition, the other being nucleation inhibition. Seeded growth ratios now include HPMCAS on felodipine (2.29 at pH 6.8, 1.28 at pH 3, and 2.7 to 12 depending on how the seeds were made) and bile salts on telaprevir seeds (E_G 1.0–4.6; complete stop with monomeric STCDC) schram2015 R4; schram2016 R2; lu2017a R7, R10. New aspect (Supersaturation from ASD dissolution): the 2008 felodipine study reads a flat concentration after an initial drop as growth inhibition: the drop takes the solution from the labile into the metastable zone ("it appears"), where only growth could lower the concentration further, so a plateau "strongly suggests" inhibited growth konno2008a C27, C26. The 2011 study reads slower growth of particles with HPMC than with PVP the same way alonzo2011 C18. For celecoxib, seeded desupersaturation with HPMCAS gave growth ratios R_0/R_p of about 70–158, less inhibition at the higher supersaturation, against an estimated nucleation ratio of ~4000, so both steps were slowed but nucleation far more ("it can be surmised") xie2016a R12, R13, C37, C40; the slow growth explains why crystals formed in dissolving PAA particles did not empty a medium holding HPMCAS xie2016a C36. In the supercooled liquid (formerly the page "crystal growth inhibition by polymers", from Crystallization tendency and Miscibility and drug-polymer interactions): the reduction of the crystal growth rate of a drug by a polymer dissolved in its supercooled liquid; the extent is thought to depend on specific drug–polymer interactions such as hydrogen bonding, and at higher levels on the polymer's effect on mobility [trasi2014a C33; trasi2014b C19]. The inhibition depends on the chemistry of the polymer at low levels, where it changes neither the Tg nor the melting point of the drug: at 3% w/w felodipine growth was slowed in the order PVP > PVP/VA > HPMCAS > PVAc [kestur2010a C17, C32, C36]. The factor is not a constant of the polymer: it grows as the temperature falls toward Tg and with polymer content [kestur2010a C12, R6, R8], and the best polymer depends on the drug (PAA for bifonazole, PVP and PVP/VA for nimesulide at low temperature) [kestur2011 C9, C10, C29]. The authors tie the order to the strength or extent of drug–polymer hydrogen bonding and propose, as a "speculation", that crystal growth needs the drug to demix from the polymer at the growth front [kestur2010a C40, C42].

Findings

ASD process: F25, F27, F29, F41. Crystallization from solution: F5, F6, F7, F8, F9, F10, F11, F12, F17, F18, F20, F23, F24, F27, F33. Supersaturation from ASD dissolution: F4, F5, F16, F22. Crystallization tendency: F19. Miscibility and drug-polymer interactions: F10, F11, F12, F13, F14, F17.

Related concepts

part of crystallization inhibition by polymers; acts on crystal seeding; slows desupersaturation; related to crystal growth rate; part of crystallization inhibition; contrasts with nucleation inhibition and with polymer effects on nucleation; related to polymer adsorption on crystal surfaces, step pinning and physical stability; contrasts with the polymer's effect on antiplasticization and thermodynamic driving force for crystallization; depends on hydrogen bonding and intramolecular hydrogen bonding.

Formulas

crystal growth inhibition effectiveness ratio, power-law crystal growth rate, initial growth rate from the desupersaturation slope, Kubota-Mullin model, overall mass crystal growth rate, relative nucleation rate from seeded and unseeded induction times, viscosity-limited normal growth law.

How it is measured or obtained

Seeded growth from a supersaturated solution at a stated supersaturation and polymer concentration, with the growth rate from the desupersaturation profile; adsorption by AFM in liquid (globule spacing) and crystal habit by SEM moseson2020a P10, P15, P16; moseson2021 P12. In the crystallization-from-solution papers: Seeded desupersaturation: a fixed mass of seed crystals (0.010 g in 50 mL for ritonavir, celecoxib and efavirenz; about 2.5 mg in 18 mL for felodipine) is placed in buffer with predissolved polymer, supersaturation is created by adding drug in methanol, and a fibre-optic UV probe on second-derivative spectra gives the slope of the first 2 min (5 min for felodipine) as the growth rate ilevbare2013b P10; alonzo2012 P4. Eg is the ratio of slopes, in triplicate ilevbare2012c P12. Rates can be normalized by seed mass and BET area ilevbare2013b E6. Unseeded controls and turbidity checks test that the slope is growth ilevbare2012a R9; ilevbare2013b R5. Rotating-disc seeds (felodipine) and seeds grown in situ in the vessel (telaprevir); the ratio is R_0/R schram2015 P2; schram2016 P5; lu2017a P1, P2. In the ASD dissolution papers: initial slopes of desupersaturation curves with equal crystal surface areas assumed (Eq. 5) konno2008a E5, P6, C28; particle size against time by light scattering alonzo2011 P5; seeded desupersaturation with 7 mg seeds in 50 mL, initial slope without polymer against the slope over 16 h with polymer xie2016a P4, P11. In the supercooled liquid: by comparing seeded growth rates of the neat drug and of drug with a low polymer level at the same temperatures [trasi2014a P3; trasi2014b P2], with FTIR to assess drug–polymer hydrogen bonding [trasi2014b P4]. For the felodipine, bifonazole and nimesulide dispersions: a 10% w/w polymer dispersion made by rotary evaporation is diluted with crystalline drug in a cryogenic mill to 0.5–4.5% w/w, melted between cover glasses, nucleated over P2O5 at 40 °C (or at ambient temperature) and grown on a hot stage at 70–110 °C (or 18–100 °C), the slope of spherulite diameter against time being the rate [kestur2010a P1, P2, P3, P4; kestur2011 P1, P2, P3]. Whether the slope is a diameter or radius rate is not always stated, and the felodipine Fig. 3 slopes are about twice the Fig. 4 rates [kestur2010a X3; kestur2011 X12]. Hydrogen bonding is read separately by IR on films with 20–50 wt% polymer [kestur2010a P6, C6].

Values in the library
materialvalue or classconditionspaper ids
IDM, PVPVAE_G 18 (5 µg/mL) and 56 (50 µg/mL polymer)50 µg/mL seeds, S = 6moseson2020a R5
BCL, PVPVA 70 µg/mL and HPMCAS 1 mg/mLE_G 8.6 and 158150 µg/mL, form 1 seedsmoseson2021 R5
felodipine seeds, HPMCAS 5 µg/mL (outside)E_G about 2 to 12 depending on how the seed crystals were preparedS = 4schram2016 R2, C13
celecoxib, HPMCAS (outside)E_G about 130, 70 and 158 (R_0/R_p at 11/11, 22/5 and 22/22 µg/mL drug/polymer)11 and 22 µg/mL drug, pH 6.8, 37 °Cxie2016a R12
ritonavir with cellulose polymers (outside)inhibition large at low supersaturation, marginal at the amorphous "solubility"seeded growthilevbare2012b C56
felodipine in buffer, PVP, HPMC, HPMCAS (outside)initial slopes about 0.1399, 0.0398, 0.0044 and 0.0021 µg/mL·min⁻¹9.5 µg/mL start, 150 µg/mL polymerkonno2008a R16
PCZ 100 µg/mL in FaSSIF V2, HPMCAS 0 / 3 / 9 times the drug; seeds 0 / 10 µg/mL% left at 30 min about 13 / 4.5; 66 / 10.5; 95 / 43.5seeded solutionshah2024 R22
ritonavir, 34 polymersE_g 0.83–3.25; Pn-IPAAmd 3.25, CAP Adp 0.85 2.98, CAB Adp 0.81 2.70, HPMCAS about 2.545 µg/mL polymer, S 7.6, 37 °Cilevbare2012c R9
ritonavir, CA 320S Sub 0.90; 0.6312.6; 10.8sameilevbare2013b R9
celecoxib, HPMC; HPMCAS; PVPVA10.2; 8.5; 7.45 µg/mL polymer, S 6.6ilevbare2013b R9
efavirenz, PVPVA; CA 320S Sub 0.90about 4.9S 1.2ilevbare2013b R9
ritonavir, CAP Adp 0.856.40, 2.99, 1.56S 3.8, 7.6, 15.3ilevbare2012b R5
ritonavir, CAP Adp 0.85 + Pn-IPAAmdabout 12.1 (S 7.6); 3.3 (S 15.4)5 + 5 µg/mLilevbare2012a R11, R16
felodipine, 1 µg/mL HPMCgrowth ratio 0.607S 10, 25 °Calonzo2012 R5
felodipine, HPMCAS-LF 5 µg/mLE_g 2.29 (pH 6.8), 1.28 (pH 3); 2.7 to 12 by seed route (pH 6.8)S 8 and S 4, 25 °Cschram2015 R4; schram2016 R2
acetaminophen, 20 µg/mL polymerconcentration at 24 h 16.1 (HPMC), 15.8 (PVP), 13.4 (PAA), 13.0 (none) mg/mLS 1.5, 20 °Ctrasi2015 R11
telaprevir, 1.86 mM bile salts, δ 2.4E_G 3.2 (STC), 1.5, 1.4, 1.2; STCDC no desupersaturationpH 6.5, 37 °Clu2017a R7, R10
telaprevir seeds, 1:1 STDC–STCDC (binary-L, 1.86 mM; binary-H, 3.72 mM)E_G about 35.5 and 7.4, between STDC (3.8) and STCDC (>60)δ 7.9, 50 mM phosphate pH 6.5, 37 °C, first 10 minlu2018 R5
felodipine particles: none; 90:10 PVP dispersion; HPMC936 nm at 7 min; ≈218 → ≈459 nm (10–90 min); ≈280–307 nm at 90 min25 °Calonzo2011 R10, R8
felodipine particles at 37 °C, PVP against HPMC dispersions≈441 nm by 20 min against ≈287–307 nm37 °Calonzo2011 R11
paclitaxel seeds with 20 µg/mL HPMCASgrowth continued at S = 88 and left ≈7.9–25.3 µg/mL after 16 h; seeds grew dendritic fingers ≈10.5–16.8 nm widepH 6.8, 37 °Cque2018 R14, R12
praziquantel with HPMCAS-MF against HPMC E5 LVno concentration drop with HPMCAS outside fed media; HPMC lost dissolved drug at 1.5 mg/mL37 °Calvarenga2025 R14, C28
five drugs with 10 mol% PVPgrowth reduced about 3- to 14-fold (authors: "around 5−10"), one point about 50-foldsupercooled liquid, 40–120 °C[trasi2014a R6, X6, C10]
nilutamide≈5 (alone), ≈3.8 (PAA), ≈1.1 µm/s (PVP)supercooled liquid, 80 °C[trasi2014b R3]
felodipine with PVP K-29/322- and 6-fold at 110 °C, 3- and 35-fold at 70 °C (1.5 and 4.5 wt%)supercooled liquid, melt[kestur2010b R13]
bifonazole with PAA5-fold at 100 °C, 15-fold at 18 °Csupercooled liquid, 5 wt%[kestur2011 R7]
flutamide with PVPabout one order of magnitudesupercooled liquid, 10 mol%[trasi2012b R3]
celecoxib with PVP; with TPGSmore than one order slower; about two orders faster at 70 °Csupercooled liquid, 10% w/w[mosqueragiraldo2014 R1, C9]
felodipine with 3% PVP, PVP/VA, HPMCAS, PVAcrate ratios at 70 °C ≈10.0, 6.5, 4.4, 1.2; at 110 °C ≈2.9, 1.1, 1.1, 1.1supercooled liquid, form II, hot stage, triplicate[kestur2010a R6]
felodipine, 4.5% w/w at 90 °C≈4.7 × 10⁻⁹ (PVP), 6.4 × 10⁻⁹ (PVP/VA), 1.7 × 10⁻⁸ (HPMCAS), 3.8 × 10⁻⁸ m/s (PVAc) against 6.7 × 10⁻⁸ m/ssupercooled liquid, log-linear in polymer content[kestur2010a R8]
bifonazole with 5% PAA; PVP; HPMCASratios ≈15, 5.9, 4.0 at 18 °C; ≈5.1, 2.1, 1.7 at 100 °Csupercooled liquid, melt-quenched films[kestur2011 R7]
nimesulide with 5% PVP; PVP/VA; PVAcratios ≈21, 16, 3.4 at 18 °C; ≈4.7, 3.1, 2.0 at 80 °Csupercooled liquid, melt-quenched films[kestur2011 R9]
Pitfalls and disagreements

E_G falls as supersaturation rises and depends on seed preparation, polymer concentration and polymer chemistry, so values from different systems are not comparable ilevbare2012b C56; schram2016 C13; moseson2020a X12. Adsorption was imaged on bulk crystals only, not on residual crystals moseson2020a X5. The threshold for "effective" is applied loosely: Eg above 1 is the stated rule, but counts of effective polymers match a cut-off near 1.2, and polymers at 1.0–1.4 are called ineffective ilevbare2013b X3; ilevbare2012c X7. Eg depends on supersaturation, polymer concentration, pH and buffer strength, so ratios from different papers are comparable only roughly; absolute rates cannot be compared because seed mass, volume and methanol fraction are often not printed ilevbare2012c X16; ilevbare2012b X12. Most 2013 ritonavir values were reported before ilevbare2013b X15. A polymer that raises the solubility lowers S and so flatters Eg ilevbare2013c X7; ilevbare2012a X6. The ratio depends on the seed route and the dose schram2016 R2; rates are not normalised to area in the felodipine and telaprevir papers schram2016 X12; lu2017a C5. For a bile salt mixture the "intermediate" ratio rests on an off-scale value for STCDC and a wide spread for the mixture (about 16.7–54.5), and secondary nucleation at δ 7.9 was assumed small lu2018 X7, C8. Polymers that form globules on an amorphous drug surface "may" need a higher concentration to block growth, which was not measured mosqueragiraldo2018a C41. No precipitate was examined in the 2008 felodipine study and surface areas were assumed equal konno2008a X4, X7. Seeded and unseeded tests of felodipine with HPMC later found growth at 0.607 of the polymer-free rate but an estimated nucleation-rate ratio of 7.05 × 10⁻⁴, placing the main effect on nucleation alonzo2012 R5, R17. For nifedipine polymorph conversion the polymers are read as inhibiting α nucleation, not growth raina2014b C32. The celecoxib slopes are not printed and R_p was taken over 16 h while the plot covers 4 h, so the ratios cannot be reproduced; seeded growth was measured with HPMCAS only, not HPMC xie2016a X8, X5. A polymer that blocks nucleation need not stop growth: HPMCAS held unseeded paclitaxel at S = 88 for more than 16 h but only slowed growth on seeds que2018 R3, C30. In the supercooled liquid: inhibition of growth and of nucleation need not coincide either: for acetaminophen, HPMCAS inhibited nucleation best but growth least [trasi2012a C46]. Some additives accelerate growth [sato2016 R11]. The molar basis of the PVP level was not defined [trasi2014a X7]. The text of the felodipine paper overstates two points against its own figures: the 105 → 70 °C fall is about 51-fold, not 3 orders of magnitude, and PVP still inhibits about 3-fold at 110 °C where the polymers "appear to have no effect" [kestur2010a X1, X2]. The nimesulide text gives 2–10-fold, the plot up to about 21-fold [kestur2011 X7]. The hydrogen-bond order was measured at 20–50 wt% polymer and one temperature, and bifonazole–polymer bonding was not measured [kestur2010a X5; kestur2011 X9]. The melting-point argument used form I in physical mixtures while form II grows [kestur2010a X7]. Only growth was measured, not nucleation [kestur2010a X10]. The two media are explained differently: in solution the authors propose surface poisoning by adsorbed polymer moseson2020a C48, C50, in the supercooled liquid drug–polymer hydrogen bonding and mobility, with demixing at the growth front as a "speculation" [trasi2014a C33; kestur2010a C40, C42], so ratios from the two media are not interchangeable (synthesis: different media and proposed mechanisms).

← Concepts and formulas

concept · as used in Dissolution

crystal growth rate

The speed at which a crystal front advances into the surrounding supercooled liquid or glass, taken as the slope of crystal size (length, radius or diameter) against time [trasi2014a P1; trasi2014b E1]. Its temperature dependence is bell-shaped, with a maximum crystal growth velocity between Tg and Tm [trasi2014a C22]. This draft comes from the crystallization-tendency chapter (growth from melts); growth from supersaturated solution, measured by desupersaturation, is covered by other chapters ilevbare2013b R7. New aspects (Miscibility and drug-polymer interactions): Growth of felodipine from the supercooled liquid is expected to depend on a thermodynamic part (the free energy difference between liquid and crystal) and a kinetic part (viscosity), as in u = (k/\eta)[1 - \exp(-\Delta G/RT)], and also on molecular recognition at the crystal surface [kestur2010a C30, E1]. The growth rate of felodipine peaks at about 105 °C and a polymer at 3% shifts the apparent maximum to 110 °C (not for PVAc) [kestur2010a R5, C11]. The polymer effect, expressed as the ratio of growth rates without and with polymer, is not constant but grows toward the glass transition [kestur2010a R6; kestur2011 C8, C10]. New aspect (Crystallization from solution): growth from supersaturated aqueous solution is measured as the initial bulk growth rate of seed crystals, the slope of the dissolved drug amount against time over the first 2 min (5 min for felodipine), in µg/mL/min or µg/min, and normalized by seed mass and BET area (mg min⁻¹ m⁻²) to compare drugs ilevbare2013b E6, E8; alonzo2012 P4. It follows the empirical law R_G = k_G S^{g} with order g between 1 (diffusion control) and 2 (integration control) alonzo2012 C3, E2. New aspect (Physical stability): in the physical-stability papers the growth rate is the slope of crystal diameter (melt films) or radius (thin films at fixed RH) against time, of existing crystals nucleated first, so that growth is measured apart from nucleation [kestur2010b P3; rumondor2010 P1, P5, C7]. New aspect (Supersaturation from ASD dissolution): in the ASD dissolution papers a growth rate from solution is the mass gained by crystals per unit surface area and time, R_G = \frac{1}{A_c}\frac{dM_c}{dt}; with equal surface areas assumed, the slope of the falling concentration ranks growth rates konno2008a E5, C28.

Findings

Crystallization tendency: F1, F2, F3, F5, F6, F7, F15, F19, F21. Miscibility and drug-polymer interactions: F10, F11, F12, F13. Crystallization from solution: F3, F5, F7, F9, F10, F23, F24, F33, F42. Physical stability: F3, F9, F11, F15, F17, F18, F19, F21, F22, F27, F28, F29, F35. Supersaturation from ASD dissolution: F5.

Related concepts

part of crystal growth; includes maximum crystal growth velocity; depends on melt viscosity and thermodynamic driving force for crystallization; contrasts with nucleation; related to crystal growth inhibition by polymers and surface crystallization; includes spherulitic growth; depends on supercooled liquid; lowered by crystal growth inhibition by polymers; inhibited in crystal growth inhibition; limited at high supersaturation by kinetic roughening; related to integration-controlled crystal growth. Regime diffusion-controlled crystal growth; modified by crystallization inhibition by polymers and moisture-induced crystallization; related to surface-enhanced crystal growth; faster mode near Tg: glass-crystal growth mode; split from nucleation and crystal growth; related to desupersaturation.

Formulas

temperature of maximum crystal growth rate, Jackson interface-kinetics growth rate, linear fit of melt viscosity on Tm − Tg, linear fit of normalized growth rate on melting entropy; viscosity-limited normal growth law, power-law crystal growth rate, initial growth rate from the desupersaturation slope; empirical log-linear growth-rate equation, linear crystal growth rate from size-time slope, crystal growth inhibition effectiveness ratio, overall mass crystal growth rate.

How it is measured or obtained

Hot-stage polarized light microscopy of melt-quenched films seeded at the edge with the form of interest, triplicate where stated [trasi2014a P1; trasi2014b P3]; with the top coverslip removed for surface growth [trasi2014a P2]; from the crystallized area when the front is irregular [trasi2014b P3]; the size–time plot is linear [trasi2012a R4; kestur2011 R4]. In the felodipine, bifonazole and nimesulide studies: the slope of spherulite diameter against time on a hot stage at 70–110 °C (felodipine) or 18–100 °C (bifonazole, nimesulide), triplicate; slower growth below 40 °C was followed in ovens or coolers with periodic pictures [kestur2010a P4; kestur2011 P3]. Whether the slope is a diameter or a radius rate is not always clear: the felodipine Fig. 3 slopes are about twice the Fig. 4 rates [kestur2010a X3; kestur2011 X12]. From solution, by seeded desupersaturation with a fibre-optic UV probe on second-derivative spectra, in triplicate (F5) ilevbare2013b P10; ilevbare2012a P8. In the physical-stability papers: melt-quenched felodipine between cover glasses, nuclei formed at 40 °C, grown on a hot stage at 70–110 °C, with crystals 5.5 ± 2 µm thick so that diameter slopes can be compared [kestur2010b P2, P3, R19, C5]. Uncovered spin-coated films, spherulites nucleated on a 90 °C hot plate, radius read from photomicrographs at four or more times for three or more crystals at each RH [rumondor2010 P1, P5]. Seeded edge growth of melt-quenched films of flutamide, acetaminophen and celecoxib, triplicate where stated; the flutamide paper reports diameter, the acetaminophen paper radial growth rates [trasi2012b P2, R3; trasi2012a P2, R6; mosqueragiraldo2014 P3]. Felodipine form I at a free surface or seeded in the bulk, form II unseeded between two cover glasses [kestur2013a P2, P3]. In the ASD dissolution papers: the initial linear slope of solvent-shift desupersaturation curves (felodipine from 9.5 µg/mL with 150 µg/mL polymer) konno2008a P6.

Values in the library
materialvalue or classconditionspaper ids
nimesulideMCV 216 µm/s, the fastest of 31 drugsbulk melt[trasi2014a R1.a]
clotrimazoleMCV 0.02 µm/s, the slowestbulk melt[trasi2014a R1.ae]
vemurafenib α-needles; β≈106 µm/s at 250 °C; ≈110 µm/s at 230 °Csupercooled liquid[lu2016 R12.o, R12.m]
nilutamide stable form≈0.00015 µm/s at 30 °C to ≈40 µm/s at 100 °Cseeded films[trasi2014b R8]
felodipinemaximum near 105 °C, 3 orders lower at 70 °Cmelt films[kestur2010a R5, C10]
felodipine form Iabout 6 times faster at the surface than in the bulk30 °C, 0% RH[kestur2013b R12]
felodipine filmsabout 2-fold rise over 13–80% RH (≈0.030 → 0.066 mm/min), 40-fold at 87% RH (2.3–2.8 mm/min at 87–93% RH)25 °C[rumondor2010 R1]
bifonazoleabout 5.5 orders lower from 100 to 18 °Cmelt-quenched films[kestur2011 R7]
flutamidenearly 2 orders lower from 70 to 40 °Cfilms[trasi2012b R3]
acetaminophennearly 2 orders lower from 110 to 70 °Cfilms[trasi2012a R6]
indomethacin γ; α; δMCV 4.07 × 10⁻⁷; 4.34 × 10⁻⁶; ≈1.5 × 10⁻⁷ m/s, at 135, 135 and 110 °Cpure melt[tian2017 R7, R8, R9, R10]
celecoxib with TPGSabout two orders faster than celecoxib alone at 70 °C10% w/w[mosqueragiraldo2014 C9]
felodipine form II≈3.5 × 10⁻⁹ (70 °C), ≈6.9 × 10⁻⁸ (90 °C), ≈1.8 × 10⁻⁷ m/s (105 °C)neat, hot stage[kestur2010a R5.a]
felodipine, 3% PVP; PVP/VA; HPMCAS; PVAcat 70 °C ≈3.5 × 10⁻¹⁰, 5.4 × 10⁻¹⁰, 7.9 × 10⁻¹⁰, 3.0 × 10⁻⁹ m/sform II[kestur2010a R5.e, R5.d, R5.c, R5.b]
bifonazole neat; with 5% PAA≈1.7 × 10⁻¹² and ≈1.1 × 10⁻¹³ m/s at 18 °C; ≈4.7 × 10⁻⁶ and ≈9.2 × 10⁻⁷ m/s at 100 °Cmelt-quenched films[kestur2011 R7.a, R7.i]
nimesulide neat; with 5% PVP≈3.7 × 10⁻¹¹ and ≈1.8 × 10⁻¹² m/s at 18 °C; ≈8.5 × 10⁻⁶ and ≈1.8 × 10⁻⁶ m/s at 80 °Cmelt-quenched films[kestur2011 R9.a, R9.g]
ritonavir; celecoxib; efavirenznormalized 0.20; 0.91; 2.97 mg min⁻¹ m⁻² at S 1.2–1.3seeded, 37 °Cilevbare2013b R7
celecoxib; ritonavir at S 6.6; 7.66.23; 6.14 mg min⁻¹ m⁻²sameilevbare2013b R7
celecoxib; ritonavir at S 14.7; 15.419.08; 14.32 mg min⁻¹ m⁻² (217.5 and 181.5 µg min⁻¹)sameilevbare2013b R7
ritonavir without additive, 10 µg/mL1.56 µg mL⁻¹ min⁻¹ (text), about 1.4 (figure)100 mM buffer, S 7.6ilevbare2012a R10, X5
ritonavir without additive, S 3.8; 7.6; 15.4about 0.72; 1.4; 3.63 µg mL⁻¹ min⁻¹sameilevbare2012a R15
felodipine without HPMC, S 3 to 12about 0.078 to 0.62 µg mL⁻¹ min⁻¹; g about 1.5025 °Calonzo2012 R4, R13
telaprevir seeds, no bile salt5.4, 58.6, 89.2 µg/min at δ 2.4, 7.9, 12.5 (per 50 mL vessel)pH 6.5, 37 °Clu2017a R2, X12
felodipine seeds, no polymerconcentration 4.0 → 1.7 µg/mL in 50 minS 8, 25 °C, 1000 rpmschram2015 R1
atazanavir, posaconazole, six mediaSHG size growth about 2–55 (atazanavir) and 20–156 nm/min (posaconazole); highest in blank buffers37 °C, relative per fieldelkhabaz2021 R15, X13
felodipine form II (PVP grade study)3.5 × 10⁻⁹ m/s (70 °C) to 1.7 × 10⁻⁷ m/s (105 °C, maximum)melt films[kestur2010b R7, C9]
felodipine with 3 wt% PVP K-12, K-29/32, K-9011-, 15-, 21-fold slower at 70 °C; 3-, 3-, 6-fold at 110 °Cmelt films[kestur2010b R8]
felodipine with 0.5–4.5 wt% PVP K-29/32ln rate linear in concentration; slope −0.82 (70 °C) to −0.49 per wt% (105 °C)melt films[kestur2010b R15, E1]
felodipine with 10% PVP vs 10% HPMCAS5.8 × 10⁻⁵ vs 1.3 × 10⁻³ mm/min (13% RH); 7.3 × 10⁻² vs 2.4 × 10⁻³ (93% RH)room temperature[rumondor2010 R5, R3]
flutamide with 10 mol% PVP≈0.13 against ≈1.4 µm/s at 40 °Cmelt films, diameter rate[trasi2012b R3.a, R3.h]
acetaminophen with 10% w/w PAA≈0.43 against ≈5.3 µm/s at 80 °Cmelt films, radial rate[trasi2012a R6.a, R6.h]
celecoxib≈0.002 (70 °C) to ≈12 µm/s (120 °C); 19–38-fold slower with 10% PVPseeded melt films[mosqueragiraldo2014 R1.a, R1.b]
felodipine form I against form II, bulkform I faster at 40–100 °C: ≈4700-fold at 40 °C, 7–9-fold at 80–100 °Cmelt films[kestur2013a R8, X5]
felodipine form I with 3% PVPsurface 1.45 × 10⁻⁹, bulk 6.37 × 10⁻¹¹ m/s (ratio 22.8)30 °C, 0% RH[kestur2013b R12]
ATP(S), ATP(R)0.022–0.032 µm/s (40 °C) to 21–34 µm/s (90 °C); S 1.2–1.6 times fastermelt films[sato2015 R5.a, R5.b, X2]
griseofulvin with 5% PHB≈0.015 → ≈0.15 µm/s at 120 °C (diameter rate)melt films[sato2016 R4.a, R4.c]
celecoxib, alone and with 10% PVP K29/32≈0.010 and ≈0.00003 µm/s at 80 °Cmelt films[xie2016b R21]
felodipine, buffer / PVP / HPMC / HPMCASdMc/dt ~0.1399 / ~0.0398 / ~0.0044 / ~0.0021 µg/mL-minpH 6.8, 37 °Ckonno2008a R16
Pitfalls and disagreements

The MCVs of the 31-drug set have no stated derivation and some disagree with the plotted rates; no replicates are given [trasi2014a X3, X17]. Rankings change with the temperature scale (T/Tg against Tm − T) [trasi2014a C7] and between surface and bulk [trasi2014a C8]. Rates above Tg cannot readily be extrapolated to storage temperatures [trasi2014a C35], and surface-enhanced or sudden growth modes near Tg can make high-temperature data overpredict stability [kestur2013a C7]. Near Tg, diffusion decouples from viscosity [trasi2014a C21]. The text says the felodipine rate falls by 3 orders of magnitude from 105 to 70 °C (the figure in the table above), the plot gives about 51-fold [kestur2010a X1]. The text says the polymers "appear to have no effect" at 110 °C, but PVP still gives a ratio of about 2.9 [kestur2010a X2]. All rates of the felodipine, bifonazole and nimesulide studies are plot readings from log axes and the error bars are not defined [kestur2010a X9; kestur2011 X6]. The bifonazole orders of magnitude in the text (5.5, as in the table above) differ from the plot [kestur2011 X6]. In solution, the same no-polymer condition gives 71.0, 69.80 and about 68 µg min⁻¹ for celecoxib in three places of one paper ilevbare2013b X7. Seed amount, volume and methanol fraction are often not printed, so absolute solution growth rates cannot be compared across studies ilevbare2012c X16. Efavirenz shows secondary nucleation above 10 µg/mL, which confounds its seeded rate ilevbare2013b R5. The fall of pure felodipine growth from 105 to 70 °C is about 49-fold in the PVP grade paper (synthesis: 1.7 × 10⁻⁷/3.5 × 10⁻⁹ [kestur2010b R7]) but 3 orders of magnitude in the text of the other 2010 paper [kestur2010a C10]. The melt growth model takes the diameter slope as the radial front speed [kestur2010b X5]. Replicates and error-bar meaning are not stated for the melt study or for the polymer films at fixed RH [kestur2010b X17; rumondor2010 X7]. Diameter and radial growth rates differ by a factor of two, so flutamide and acetaminophen rates cannot be compared as printed [trasi2012b R3; trasi2012a R6]. The measured felodipine front changes habit with temperature [kestur2013a X12]. The PHB paper reports diameter rates, twice the radial rate [sato2016 X8]. Table 2 of the indomethacin polymorph paper interchanges the δ and γ maxima of the pure drug [tian2017 X1]. Two celecoxib papers differ about tenfold in the factor by which 10% PVP slows growth [mosqueragiraldo2014 R1; xie2016b R21]. The slopes come from one panel without uncertainty, from curves that start at different 5-min levels, and no surface area was measured konno2008a X7. The buffer slope reproduces from the plotted points (≈0.14 µg/mL-min) konno2008a E5.

← Concepts and formulas

concept · as used in Dissolution

crystal growth

The second step of crystallization: existing nuclei or seeds grow by molecules crossing the crystal–liquid interface and attaching to growth sites [trasi2014a C19; tian2017 C22]. The usual growth models (normal, screw dislocation, two-dimensional surface nucleation) differ in the interface structure but all contain a mobility term and a driving-force term [trasi2014a C19]. Because nuclei are detected only after they grow, a measured induction time is the sum of nucleation and growth times chen2015 E1, C5. New aspect (Bioperformance): the growth rate is written as a power law in supersaturation, R_G = k_G A (C_b - C^*)^g, and growth rates of ezetimibe were taken from SHG [purohit2018 E3; elkhabaz2017 R23]. Growth on tacrolimus seeds was fitted with the same power law, dC/dt = k_g A (C - C^*)^n, with n = 1.677 (R² 0.9896), close to the n of about 2 expected for integration-controlled growth with a polymer adsorbed on the crystal hate2019 E4, E5, R18, C44. New aspect (Supersaturation from ASD dissolution): growth is the second step that empties a supersaturated solution after nucleation; the two-route scheme of dispersion dissolution writes it as proportional to the excess concentration, R_G \propto (C - C_{eq}) (cited) alonzo2010 E5, C43. A celecoxib study states that crystals formed in the wetted matrix act as seeds that grow quickly and limit the supersaturation, and reads the induction time as nucleation plus growth to a detectable size xie2015 C31, E1.

Findings

Crystallization tendency: F1, F19. Bioperformance: F10, F12, F16, F29. Supersaturation from ASD dissolution: F5, F9, F16, F22.

Related concepts

measured by crystal growth rate; contrasts with nucleation; related to crystal growth inhibition by polymers and surface crystallization. Seeded by crystal seeding; inhibited by crystal growth inhibition.

Formulas

Jackson interface-kinetics growth rate. Power-law crystal growth rate, overall mass crystal growth rate.

How it is measured or obtained

As a growth rate (see crystal growth rate); by the morphology of the growing crystals [lu2016 R7]; in solution by desupersaturation after seeding xie2015 C31. It is inferred from the fall of concentration in non-sink tests purohit2018 C43 and from the SHG mean size over time [elkhabaz2017 P11]. In dissolving dispersions and in methanol-shift solutions: size of submicron particles against time by light scattering alonzo2011 P5; desupersaturation slopes konno2008a P6.

Values in the library
materialvalue or classconditionspaper ids
bifonazole, nimesulidespherulite size linear in timemelt films[kestur2011 R4]
acetaminophen with polymersspherulites; radius linear in time, R^2 > 0.99melt films[trasi2012a R4]
vemurafenibfour forms in six morphologies (needles, spherulites, feathers, clusters)supercooled liquid[lu2016 R7]
nilutamide stable formgrowth front smooth at 70 °C, rough at 60 °C, with a 50-fold rate dropseeded films[trasi2014b R4, C7]
flutamide dispersion particlesnumber and size of needle crystals increase with storage40 °C/75% RH[correasoto2017 R2, C12]
ezetimibe ASDsgrowth rate 0.020–1.0 µm/min (as printed)buffer, FeSSIF, Ensure Plus[elkhabaz2017 R23]
tacrolimusgrowth rate rises steeply with supersaturation; 450 mL gives twice the supersaturation of 900 mLUSP medium Ipurohit2018 C52, C55
FTM ASD (SHG)spots at 8 days, dense field at 60 days75% RH[correasoto2017 R2, R4]
tacrolimus on seedsn 1.677; growth constant 1.17 × 10⁻⁴ (printed unit cm/s, unclear); absorption leads below S about 18.5 and growth above ithollow-fibre module, seeds from the crystallized generichate2019 R18, R19, X3, X16
felodipine particles from a 90:10 HPMC dispersion≈218 nm at 5 min, ≈337 at 90 min, ≈720 nm near 10 h, then settling25 °Calonzo2011 R6
felodipine particles, dispersion against methanol shift with HPMC≈183–203 → ≈280–307 nm in 90 min, alike25 °Calonzo2011 R8
same at 37 °Cdispersion-born ≈259–274 nm against ≈194–219 nm at 5–10 min37 °Calonzo2011 R11
celecoxib seeds, 22 and 11 µg/mL, no polymerno lag; ≈22.5 → ≈4.0 and ≈12.8 → ≈3.7 µg/mL in 30 minpH 6.8, 37 °Cxie2016a R11
paclitaxel with 18 wt% seeds, no polymerfrom 31.6 µg/mL to ≈12–13 µg/mL in 2 min with sonicated seeds against ≈21.6 and ≈26.1 µg/mL with long needlespH 6.8, 37 °Cque2018 R7
Pitfalls and disagreements

Near Tg some crystals switch to diffusionless growth and diffusion decouples from viscosity [trasi2014a C21]. A change in growth morphology can change the rate abruptly [trasi2014b C7]. Once crystallization starts it is expected to continue, so early detection matters [correasoto2017 C4]. In the SHG study of ezetimibe the nucleation-rate unit is implausible and growth rates are relative [elkhabaz2017 X7]. In the tacrolimus seed study the unit of the printed growth constant does not fit the equation, the x-axis of the log-log fit is log(C − C*) rather than log(S − 1), and the crossover near S 18.5 assumes a constant crystal area (F29) hate2019 X1, X2, X3, X16. The crystallinity of the early felodipine particles was inferred, not measured by diffraction alonzo2011 X7; the match of dispersion-born and methanol-born particles holds at 25 °C, not at 37 °C alonzo2011 X19. Per unit mass the growth area, not the seed mass, set the loss: sonication raised the needle-end area about 7–9-fold que2018 R6, C5.

← Concepts and formulas

concept · as used in Dissolution

crystal habit

The outer shape of a crystal, here described by length, width and aspect ratio (mean length over mean width) of 50 crystals per sample; additives that adsorb on and slow the fastest-growing faces change it ilevbare2012c E7, C5. Ritonavir Form II grows as needles; polymers that inhibit its growth made the crystals wider and the aspect ratio smaller ilevbare2012c R4; ilevbare2012a R6. Felodipine seeds crystallized in HPMCAS were small and spiky at an equal imaged area (31.2 against 33.4 µm²), and acetaminophen habit changed with every polymer at 20 µg/mL schram2016 R8, R9; trasi2015 R12. New aspect (Supersaturation from ASD dissolution): habit is also recorded as a sign of the crystallization route and of additives: nifedipine crystals from the solution route were below 2 µm against 1–300 µm agglomerates from the matrix route raina2014b R13, R2, and celecoxib grew as thin needles, "consistent with" Form III, in every medium chen2015a R13, C7.

Findings

Crystallization from solution: F12, F8, F24, F27, F42. Supersaturation from ASD dissolution: F3, F12, F14, F22.

Related concepts

predicted by BFDH morphology prediction; changed by polymer adsorption on crystal surfaces; related to crystal growth and surfactant-induced crystallization.

Formulas

aspect ratio.

How it is measured or obtained

SEM of crystals recovered after a growth run, length and width of 50 crystals; the habit expected for the crystal structure from the BFDH tool in Mercury; PXRD relative peak intensities as a proxy for the exposed faces ilevbare2012c P4, P7, P13; ilevbare2012a P6. In the ASD dissolution papers: polarized light and SEM images; length over width raina2014b P4; ilevbare2013d P8; chen2015a P10.

Values in the library
materialvalue or classconditionspaper ids
ritonavir seeds; after growth none; Pn-IPAAmdaspect ratio 7.7; 8.8; 4.4 (width 5.8; 5.7; 9.3 µm)S 7.6ilevbare2012c R4
ritonavir with CAP Adp 0.85; with the CAP Adp 0.85 + Pn-IPAAmd pair5.2 (rodlike); 4.8S 7.6ilevbare2012b R6; ilevbare2012a R6
ritonavir at S 15.4: none; CAP Adp 0.85; Pn-IPAAmd; pair12.1; 7.6; 7.4; 6.5 (all needle-like)20 µg/mLilevbare2012a R6
ritonavir ASD dissolution (ASD dissolution chapter)aspect ratio about 22.4 with Tween 80 against 3.9 with PVP alonecrystals after about 90 minilevbare2013d R8
paclitaxel seeds (ASD dissolution chapter)all needles of high aspect ratio, fast growth at the endsSEMque2018 R4, C14
acetaminophen, 20 µg/mL polymerrods (HPMCAS), prisms (PAA), parallelepipeds (PVPVA), smaller plates (PVP), very small crystals (HPMC)S 1.5, 20 °Ctrasi2015 R12
telaprevir, eight media ± 150 µg/mL HPMCAS-MFsmooth bouquets of prisms (buffer), rough with polymer, smooth plates in FaSSIF with polymerSEM, crystals after induction runslu2018 R10
atazanavir needles, buffer-V1, FaSSIF-V1, composite FaSSIF, aspirated human fluidaspect ratio 12.4 ± 7.4, 54 ± 13, 83 ± 32, 41 ± 14SEM, n = 15 (FaSSIF-V1 n = 10), 37 °Celkhabaz2021 R21
posaconazole platesabout 25–45 nm thick; finger-like ends in human fluidSEMelkhabaz2021 R22, R23
atazanavir in SDS25–100 µm agglomerates below 0.075 mg/mL; about 127–367 nm abovemicroscopy and NTAindulkar2019b R9, R11
nifedipine, solution route against matrix routebelow 2 µm against 1–300 µmpH 6.8raina2014b R13, R2
celecoxib crystals from induction runsthin needles in all eight media25 °Cchen2015a R13
celecoxib in SDS and polysorbate 80 suspensionslong free-floating needlespH 3chen2015a R15
paclitaxel seeds before and after growth without polymermean aspect ratio ≈23.6 → ≈17.7 (long needles) against ≈7.3 → ≈14.7 and ≈4.7 → ≈13.7 (sonicated)pH 6.8, 37 °Cque2018 R9
Pitfalls and disagreements

Means of 50 crystals have overlapping spreads; lengths with polymer are not below the seed length, so the ratio falls through width; three of the five S 7.6 rows are cited from earlier papers ilevbare2012a X9; ilevbare2012b X4. The printed 5.2 for the CAP Adp 0.85 sample recomputes to 5.14 ilevbare2012b E15, X5. A habit change does not by itself show how much growth is slowed: HPMC gave the smallest crystals and PAA the habit nearest the prediction trasi2015 R12, C19. The celecoxib needle direction along the c-axis is stated without an indexing basis chen2015a X19; DLS sizes of needle-shaped crystals are spherical equivalents and "likely to be unreliable" ilevbare2013d C19. The fall of the long-needle aspect ratio is read as fine crystals from secondary nucleation que2018 C43.

← Concepts and formulas

concept · as used in Dissolution

crystal seeding

Crystals already present in a dispersion or added to the medium act as templates for growth and consume supersaturation; the relevant property is the growth area and interface structure of the seeds, not their mass que2018 C5. In the ASD process papers, residual crystals from hot melt extrusion are seeds that are small, embedded in the amorphous solid and possibly defective, and are "routinely" more potent than bulk seeds moseson2020a C55; moseson2021 C65, C66, C74. In the posaconazole–HPMCAS pH-shift tests residual crystals of 0.3–3.2% act as seeds: supersaturation ended earlier, by growth of the crystals present and by secondary nucleation, both inferred from solution concentration and particle counts shah2024 C45, C47, R14. New aspect (Bioperformance): crystals already present in an amorphous product on which dissolved drug can grow without nucleation; their growth removes supersaturation purohit2018 C40, C43. Seeds were taken from the maximally crystallized generic tacrolimus capsule and added to solutions at 20 and 50 µg/mL; crystals that formed inside the product were smaller than purchased reference crystals of the same form hate2019 R17; purohit2019 R6, R8, C56. New aspect (Supersaturation from ASD dissolution): a dispersion can seed itself. Crystals that form in the wetted, undissolved matrix during a gastric stage are released when the polymer dissolves at intestinal pH and then act as seeds for the supersaturated solution; for posaconazole the authors state that "These seed crystals were transferred to the intestinal compartment and promoted further crystallization" elkhabaz2019a C56, and for delamanid that surface crystals "can act as seeds" while release and crystallization compete nguyen2023c C44, C49.

Findings

ASD process: F26, F28, F29, F41. Bioperformance: F16, F28, F29, F30. Supersaturation from ASD dissolution: F22, F24, F25, F26, F27.

Related concepts

produced by residual crystallinity; read through desupersaturation; slowed by crystal growth inhibition; influenced by crystal defects. Related to crystal growth, secondary nucleation and endogenous crystallization; produced by matrix crystallization and surface crystallization; acts through seeded crystal growth; avoided by enteric polymer coating of the tablet.

Formulas

power-law crystal growth rate.

How it is measured or obtained

Seeded desupersaturation: bulk crystals (D50 21.9 µm) added at 10, 25 or 50 µg/mL to 50 µg/mL indomethacin, with the growth rate in µg/s moseson2020a P10, R4; external form 1 seeds equal to 10% of a bicalutamide dose added to a crystal-free dispersion and read by Raman as a relative growth rate moseson2021 P13, P17, R22. Potency of residual seeds is read by comparing extrudates with seeded crystal-free dispersions at the same amorphous dose moseson2020a P13, P14. Seeded desupersaturation of posaconazole in FaSSIF V2: 20 or 100 µg/mL drug, HPMCAS at 0–9 times the drug, seeds of 0–10 µg/mL, percent left at 30 min shah2024 P16, R22. In the tacrolimus capsules crystals were read by XRPD (limit of detection 10%) and inferred from desupersaturation in non-sink dissolution purohit2018 R2, R7. For self-seeding in pH-shift tests: crystals are detected in the acid stage by SHG, which gives signal only from crystals, beside two-photon excited fluorescence of all drug, and their ratio estimates the share of the undissolved drug that is crystalline elkhabaz2019a P10, P11, E1; on dispersion films and powders by polarized light and SEM after 1 h in acid, with PXRD of the powders nguyen2023c P12, P13, P14. The effect is read from the release after the pH shift against a run without an acid stage elkhabaz2019a R6, R7.

Values in the library
materialvalue or classconditionspaper ids
IDM bulk seeds, no polymergrowth rate about 0.33, 0.71, 0.99 µg/s at 10, 25, 50 µg/mL seedsS = 6, pH 4.5moseson2020a R4.a
IDM–PVPVA, 50 µg/mL amorphous dosebulk seeds up to 100% of the dose: C720 about 43.2 → 39.8 µg/mL; extrudates with 3–25% crystals: about 27.0–37.3 µg/mL12 hmoseson2020a R9, R10
BCL–PVPVArelative form 1 growth rate about 0.088 (M/155, 3.5% crystals), about 0.071 (S/155, below 1%), about 0.044 (10% external seeds)Raman slurrymoseson2021 R22
paclitaxel–HPMCAS 49/51 (outside)residual concentration about 25 (bulk API) to about 8–10 µg/mL for other seed types; seed mass not the relevant parameter18 wt% seeds, 16 hque2018 R14, C5
fresh generic tacrolimus capsules (outside)seeds below 5% of the drug cause desupersaturation; growth slow at first because the surface area is smallnon-sink, 100 mLpurohit2018 C45, C46
PCZ 100 µg/mL in FaSSIF V2, seeds 10 µg/mL4.5% left at 30 min without polymer; 10.5% with HPMCAS at 3 times the drug; 43.5% at 9 timesseeded solutionshah2024 R22
PCZ–HPMCAS 10% DL with 0.3% crystalssupersaturation down to about 18.5 µg/mL by 150 min against about 125 µg/mL at 300 min without crystalspH shift at 60 minshah2024 R12, R14
tacrolimus generic capsulesfresh seeds below 5% of the drug (inferred); peak 98% then 39.5% in 100 mLUSP medium Ipurohit2018 C46, R7
felodipine, HPMCnucleation inhibition counts far more than growth inhibitionseeded and unseededalonzo2012 C40
posaconazoleseeded desupersaturation faster with more seeds and more drug, slower with more HPMCASFaSSIF V2shah2024 C37, R22
tacrolimus, seeded solutionsdesupersaturation rate about 0.39 at 50 µg/mL and 0.075 at 20 µg/mLpolymer in solution, hollow fibrehate2019 R17
tacrolimus crystals in the generic capsule1–5 µm against 5–25 µm for reference monohydrate crystals; same formSEM, after 5 weeks at 40 °C/75% RHpurohit2019 R6, R8
posaconazole–HPMCAS 10 / 25 / 50% drugestimated matrix crystallization ≈0.026 / ≈0.050 / ≈68% of the undissolved drug30 min in FaSSGF, 37 °Celkhabaz2019a R20
the same, after transfer10% and 25% held ≈22–24 and ≈21–22 µg/mL for about 150 and 60 min; 50% fell to ≈6 µg/mL within 30 minFaSSIF pH 6.5elkhabaz2019a R6, R7, R8
the same, without an acid stage≈21 µg/mL at 180 min (10%) and ≈22–23 µg/mL to 60 min (25%)FaSSIF onlyelkhabaz2019a R6, R7
delamanid salt dispersions, particles after the pH shiftcovered with small crystals within 30 minpH 6.5nguyen2023c R21
paclitaxel–HPMCAS dispersion with 18 wt% added seedsthe amorphous solubility was still reached, then lost over hourspH 6.8, 37 °Cque2018 R13
Pitfalls and disagreements

Surface area and defects of residual crystals were not measured, so the extra potency is an inference moseson2020a X9; moseson2021 X10. Bulk seeds at a larger mass can grow more slowly than a small mass of embedded residual crystals; micron-sized seeds would "still not approximate" crystals below 100 nm moseson2021 R22; moseson2020a C42. Seed potency also depends on supersaturation and on the polymer moseson2020a C54, C56. The focused beam reflectance signature read as secondary nucleation for the crystal-containing 25% dispersion has the same form as the one read as primary nucleation for the crystal-free one, and the separate rates of growth and nucleation were not measured shah2024 K3, K4, X14, X13. Added seeds may not mimic crystals formed inside the ASD purohit2018 C7. Growth in the tacrolimus tests was inferred from concentration purohit2018 X9. Seeds did not always cause crystallization: at 240 and 100 mL the lower maximum supersaturation and the membrane loss kept growth small, at 40 mL it was large (F28, F29) hate2019 C46, C49. The rate units printed with the seeded runs are inconsistent with the profiles hate2019 X1. No seeding experiment was run in either pH-shift study, and the crystals on the delamanid dispersions were not identified, so the step from gastric crystals to lower release is inferred elkhabaz2019a X8; nguyen2023c X11. The 50% posaconazole dispersion also lost its supersaturation without an acid stage, so its crystal burden is not the only cause elkhabaz2019a C44.

← Concepts and formulas

concept · as used in Dissolution

crystalline solubility

The equilibrium solubility of the stable crystalline form of the free drug in a given medium, the reference against which supersaturation and the amorphous advantage are defined; Eq. 1 multiplies it by the free-energy and water terms to obtain the amorphous solubility ilevbare2013a E1; indulkar2015 E2. For ionizable drugs it is measured at each pH and follows the pH-solubility profile of the free base indulkar2015 E8, R4. The papers of 2017–2022 add that it rises steeply with temperature (ibuprofen about 23.5 µg/mL at 25 °C to about 116 µg/mL at 60 °C), that polymers do not change it except one that complexes the drug (EUD-E, 29.8 → 42.1 µg/mL), and that micelles raise it (atazanavir 1.1 → about 45.6 µg/mL at 3.6 mg/mL SDS; telaprevir about twofold with 12 mM dihydroxy bile salts) ueda2022 R1, R2; ueda2020b R1; indulkar2017a R7; lu2017b R1.

Findings

F5, F6, F9, F10, F12, F4, F15, F17, F18, F23.

Related concepts

reference for amorphous solubility and supersaturation; raised by ionization (pH-dependent solubility) and by micellar solubilization; lowered by salt (F9).

Formulas

solid-liquid equilibrium solubility equation, pH-solubility profile, amorphous solubility advantage with water-sorption correction.

How it is measured or obtained

Shake flask with excess crystals, about 48 h at the test temperature, separation by ultracentrifugation, HPLC or UV assay ilevbare2013a P1; almeidaesousa2015 P3; indulkar2015 P3; mosqueragiraldo2015 P1; trasi2015a P1; almeidaesousa2016 P5. A small amount of the stock solvent was added in one study to mimic the onset composition almeidaesousa2015 P3.

Values in the library
materialvalue or classconditionspaper ids
ritonavir2.4; 1.3; 0.95 µg/mLwater; 100 mM; 200 mM phosphate pH 6.8, 37 °Cilevbare2013a R13
ritonavir; lopinavir; paclitaxel (hydrate); felodipine1.7; 2.7; 0.32; 0.74 µg/mL100 mM pH 6.8, 25 °Ctrasi2015a R1
efavirenz; loratadine; ketoconazole; indomethacin; clotrimazole; clozapine8.2; 1.6; 3.7; 3.0; 0.4; 8.8 µg/mLun-ionizing media, 37 °Cilevbare2013a R8
ibuprofen; tolnaftate; sorafenib29.29; 27.87 × 10⁻³; 9.86 × 10⁻³ µg/mL25 °Calmeidaesousa2015 R5
telaprevir4.6 ± 0.1 (4.7 with 5 µg/mL HPMCAS) µg/mLpH 6.8, 37 °Cmosqueragiraldo2015 R13
clotrimazole; atazanavir0.55; 1.04 µg/mL (un-ionized)37 °Cindulkar2015 R2
CRH1 free base1.20 (pH 6.8); 1.50 µg/mL (pH 4.6 + HPMC)25 °Calmeidaesousa2016 R2
telaprevir5.2 ± 0.1 µg/mL; 9.6–12.4 with 12 mM STDC, STCDC, SGDC, SGCDC; 6.2–6.9 otherwise50 mM pH 6.5, 37 °Clu2017b R1
atazanavir1.1 µg/mL (buffer); about 45.6 µg/mL (3.6 mg/mL SDS)pH 6.8, 37 °Cindulkar2017a R4, R7
pazopanib free base0.018 µg/mL (pH 8.4); 0.033 (pH 6.5); about 0.60 (pH 5); 0.571 mg/mL (SGF)37 °C, 72 hsugihara2018 R2
ibuprofen29.8 (2020) and 43.1 µg/mL (2021) at 37 °C, pH 2.0 (D2O); about 23.5 (25 °C) to about 116 µg/mL (60 °C)shake flaskueda2020b R1; ueda2021 R2; ueda2022 R1
Pitfalls and disagreements

Crystalline nicardipine turned amorphous in water within 2 h, so no crystal solubility exists for it indulkar2015 R1. The paclitaxel value is that of a hydrate trasi2015a X12. Solubility at pH 8 is quoted at pH 9 in the text of one paper indulkar2015 X2. Media differ between drugs in the 2013 table ilevbare2013a X16. Pazopanib's value is very low and carries a high experimental uncertainty sugihara2018 C16; the same drug and medium gave 29.8 and 43.1 µg/mL for ibuprofen in two papers ueda2020b R1; ueda2021 R2.

← Concepts and formulas

concept · as used in Dissolution

crystallization during dissolution

Crystallization of an amorphous drug while it dissolves, either on the dissolving solid or from the supersaturated solution it creates, so that the solution never reaches the calculated amorphous solubility ilevbare2013c C20, C24. The induction-time runs of the chapter avoid the first route by starting from a solution ilevbare2013c C24. Seeds crystallized from a felodipine–HPMCAS melt in pH 3 buffer for up to a week are the dispersion route of the seed study schram2016 P3, R10. New aspect (Supersaturation from ASD dissolution): the frame of two routes (crystallization of the solid matrix and of the solution) and the claim that their kinetics relative to dissolution "in large part shape" the concentration–time profile alonzo2010 C32, C47; for nifedipine both routes pass through a metastable form first raina2014b C29. For resveratrol dispersions crystallization "appeared to occur in or at the surface of the matrix", also where an undissolved polymer blocked release, and the concentration reached depended on the extent of crystallization, the drug–polymer interactions and the amount of dispersion added wegiel2015 C16, C48. New aspect (Release mechanism and LoC): in the release papers of 2020–2022 crystallization on the dissolving compact ends release that began well. Heating 10% atazanavir–PVPVA compacts to 55 °C, near the drug's wet Tg, restored release, but drug release ceased at about 70 min at 64% released while PVPVA dissolved completely, and crystals were seen by PLM at 90 min; crystallization "is likely" why release stopped correasoto2022b R5, C14, M1. The TPGS dispersion crystallized after 1 h at 55 °C correasoto2022b R6. For indomethacin methyl ester the route was crystallization at the compact surface saboo2020 C17. The 2025 HPMCAS papers checked and excluded it as the cause of poor weak-base release: no crystals during 1 h or for 12 h after (except loratadine–LF after about 10 h), and amorphous bedaquiline residues bapat2025a R6, C17; kaur2025 R14.

Findings

Crystallization from solution: F2, F3, F24. Supersaturation from ASD dissolution: F1, F2, F3, F16. Release mechanism and LoC: F18, F19, F32.

Related concepts

limits amorphous solubility; related to crystallization tendency and desupersaturation; part: matrix crystallization and solution crystallization; related to solution-mediated phase transformation. At the compact surface it is surface crystallization; ends congruent release; the test temperature is set against the wet glass transition temperature.

Formulas

Noyes-Whitney equation, classical nucleation theory.

How it is measured or obtained

The maximum concentration reached on dissolving a solvent-evaporated or spin-coated amorphous solid by in-situ UV, compared with the calculated value; polarized-light microscopy of melt-quenched particles wetted with buffer ilevbare2013c P7, P8, R2, R4, R5; ilevbare2012b P5, P6. In the ASD dissolution papers: concentration–time profiles read side by side with in situ solid-state measurements of slurries (Raman, MCR) and polarized light alonzo2010 P5; raina2014b P6, P10. In the release-mechanism papers: polarized light microscopy of the compact after the run, besides the stop of drug release while the polymer keeps dissolving correasoto2022b R5.

Values in the library
materialvalue or classconditionspaper ids
ritonavir; efavirenz; celecoxibmaximum 19.8; 12.3; 2.5 µg/mL against calculated 20.6; 19.8; 22.6pH 6.8, 37 °Cilevbare2013c R2
amorphous celecoxib particlebirefringent spot within about 1 min, extensive crystals at 6 minbuffer, 20×ilevbare2013c R4
amorphous efavirenz particlesshrank over 3 h, no birefringencebufferilevbare2013c R5
felodipine slurry without polymer (ASD dissolution chapter)more than 50% crystalline at the first acquisition (1 min) at 37 °C; about 8 min to 50% at 25 °CpH 6.8alonzo2010 R2
danazol (cited)amorphous danazol reached less than a quarter of the expected concentrationrefs in the cardjackson2014 R27
felodipine–HPMCAS melt (10% w/w)small rounded features, steps 0.77 nmpH 3, up to a weekschram2016 R10, R12
indomethacin, neat amorphousconcentration maximum (≈11.2 µg/mL) near the onset of conversion to αpH 2, 37 °Calonzo2010 R13, R7
nifedipine glassglass gone by ≈6 min, γ then α; solution ≈6 µg/mLpH 6.8, 25 and 37 °Craina2014b R6, R14
nifedipine–HPMC 50:50≈100 µg/mL at ≈22 min, ≈41 µg/mL at 150 min5 mg/mL, 37 °Craina2014b R14
resveratrol–HPMCAS 25%, pH 6.8 against pH 1.2Raman ratio ≈0.96 and ≈0.93 after a day37 °Cwegiel2015 R17
neat amorphous celecoxib≈1.70 against ≈1.85 µg/mL for the crystal at 16 hpH 6.8, 37 °Cxie2015 R7
atazanavir–PVPVA 10%64% of the drug and all PVPVA released; drug release ceased at ≈70 min; crystals at 90 min55 °Ccorreasoto2022b R5
atazanavir–PVPVA 10% with TPGScrystals after 1 h55 °Ccorreasoto2022b R6
Pitfalls and disagreements

For efavirenz the shrinking particles suggest crystallization from the solution after dissolution, not on the solid ("suggesting") ilevbare2013c C23. The theoretical and experimental amorphous solids were made by different routes (melt-quench for the water sorption feeding the calculation, solvent evaporation for the measurement) ilevbare2013c X17. The Tg of the hydrated solid explains the felodipine temperature effect only in part; indomethacin crystallized more slowly despite a similar Tg drop alonzo2010 C34, C42. Supersaturation in the nifedipine slurries was not measured raina2014b X10. (synthesis: the higher temperature that restored release of the 10% dispersion also brought crystallization within the 90-min run) correasoto2022b R5, R6.

← Concepts and formulas

concept · as used in Dissolution

crystallization inhibition

The delay or slowing of crystallization of an amorphous drug by a polymer mixed with it. Several explanations are in circulation and none is accepted: reduced molecular mobility through a higher Tg (antiplasticization), a lower driving force through a lower chemical potential, a higher barrier, and drug–polymer specific interactions that disrupt the drug's self-association [taylor1997 C3, C4, C5; marsac2006b C2, C5; kestur2010a C29; rumondor2009a C2]. For indomethacin and PVP the proposal is that a nucleus of the stable γ form is built of acid dimers, so that nucleation "would require" breaking the PVP–drug hydrogen bond [taylor1997 C43]. The effect is measured on different quantities: the overall crystallinity of a film over days (the amorphicity index), the growth rate of crystals into the supercooled liquid, or nucleation separately [vaneerdenbrugh2010b E1; kestur2010a P4]. In later designs the effect is read as the amorphicity index of 105 spin-coated pairs of 15 drugs and 7 polymers [vaneerdenbrugh2011a R3], as the highest polyphenol content that stays X-ray amorphous and the days to crystals at five storage conditions [wegiel2013a R8, R9], and as the weeks to crystals of lumefantrine dispersions hiew2022a R6. The ranking of polymers follows complementary groups of drug and polymer (see F24). In the glass, melt and solution (formerly the page "crystallization inhibition by polymers", from ASD process, Crystallization from solution, Physical stability and Supersaturation from ASD dissolution): delay of nucleation and slowing of growth of a drug by a polymer in the glass, melt or solution. Two settings matter here. In solution, dissolved PVPVA prevented nucleation of indomethacin for more than 12 h and HPMCAS prevented that of bicalutamide for 8 h moseson2020a C11; moseson2021 R3. In the solid or melt, a polymer can stabilise the amorphous drug against recrystallisation and let degradation be tested on a dispersion [moseson2020 C32, C55]. A polymer inhibits in the solid only when intimately mixed with the drug in one phase, usually inferred from a single Tg [rumondor2009c C26; marsac2010 C31]. The polymer's help in solution does not carry into the hydrating solid or across drugs: HPMCAS slowed seeded growth of posaconazole in FaSSIF shah2024 R22, but in the hydrating solid cryomilled and high-loading bicalutamide–PVPVA dispersions still crystallized [moseson2022b R4, R6]; and coated erlotinib–HPMCAS held 48 weeks at 43% RH where coated erlotinib–PVPVA failed at 6 weeks, a difference the authors attribute to the polymer [moseson2022a R11, R12, C31]. New aspect (Crystallization from solution): the delay of crystallization from a supersaturated aqueous drug solution by a dissolved polymer, through slowing nucleation, growth or both; for felodipine and HPMC both were slowed at µg/mL levels and nucleation far more alonzo2012 C46. The papers separate it into crystal growth inhibition and nucleation inhibition because polymers rank differently in the two (F6) ilevbare2013c C40. The solid-state version, in amorphous dispersions, is described at the start of this definition. New aspect (Physical stability): in dry felodipine films a few percent of polymer lowered nucleation by orders of magnitude, independent of polymer type and of any Tg rise, and the authors speculate that it raises the kinetic barrier to nucleation [konno2006 C13, C14, C40]. With water present the polymer still inhibits, competing with the water it brings, but the polymers then differ [konno2008 C13, C10]. New aspect (Supersaturation from ASD dissolution): one polymer can act differently on the two routes by which an amorphous solid loses supersaturation: PVP delayed crystallization of the wetted felodipine solid at least as well as HPMC and HPMC-AS but held felodipine solutions poorly alonzo2010 C38; the authors therefore "speculate" that some drugs "might" be formulated better with two polymers, one per route alonzo2010 C46. Because 1 mg/mL of each polymer left the crystalline solubility of felodipine unchanged, the higher concentrations from the dispersions are read as kinetically maintained supersaturation, not solubilization konno2008a R1, C17, C22. The papers of 2015–2018 add that a fast-releasing polymer can be paired with a minor inhibitor that then works in solution xie2015 C6; xie2016a C69, that against matrix crystallization the inhibitor must stay in contact with the drug in the particle xie2016a C54, and that the polymer content needed to stop matrix crystallization depends on the polymer wegiel2015 C11.

Findings

Miscibility and drug-polymer interactions: F1, F9, F10, F11, F12, F13, F15, F16, F17, F23, F24, F25, F26. ASD process: F25, F27, F31, F38, F41, F44. Crystallization from solution: F6, F7, F8, F13, F14, F15, F16, F20, F25, F26, F27, F36, F37, F41, F43, F44. Physical stability: F1, F3, F4, F10, F11, F15, F17, F18, F19, F21, F22, F24, F26, F27, F28, F29, F33, F35. Supersaturation from ASD dissolution: F2, F3, F4, F5, F6, F12, F16, F20.

Related concepts

includes crystal growth inhibition and nucleation inhibition; depends on drug-polymer interactions, drug-polymer miscibility, antiplasticization and thermodynamic driving force for crystallization; contrasts with crystallization tendency of the neat drug; limited by matrix crystallization; related to nucleation, crystal growth rate, kinetic stabilization, polymer hydrophobicity and supersaturation. Acts through kinetic barrier to nucleation and polymer rejection at the crystal growth front (proposed); not through antiplasticization at low content; lost by moisture-induced phase separation; decided by hydrogen-bond donor and acceptor groups and acid-base interaction; related to drug-polymer complexation.

Formulas

amorphicity index, viscosity-limited normal growth law, crystal growth inhibition effectiveness ratio, relative nucleation rate from seeded and unseeded induction times, induction time decomposition, empirical log-linear growth-rate equation, classical nucleation theory, supersaturation ratio, overall mass crystal growth rate.

How it is measured or obtained

Spin-coated films of drug and polymer at several ratios, scored by polarized light microscopy at day 0, 1, 3 and 7 and expressed as an amorphicity index [vaneerdenbrugh2010b P1, P2, E1]; hot-stage growth of spherulites in melt-quenched films with low polymer levels after nucleation at 40 °C [kestur2010a P2, P3, P4]; rotary-evaporated bulk powders by DSC crystallinity [vaneerdenbrugh2010b P8, E5]. Only growth, not nucleation, was measured in the felodipine and bifonazole–nimesulide studies [kestur2010a X10; kestur2011 P3]. Induction time and seeded desupersaturation in solution; DSC of undercooled melts for the dispersion (a melting peak on reheating means nucleation during the hold); matrix crystallisation by microscopy and Raman of particles in buffer [moseson2021 P12, P15, P16; moseson2020 P7]. In the crystallization-from-solution papers: seeded growth rates and unseeded induction times with and without predissolved polymer under identical conditions, combined into a relative nucleation rate (F5, F6) alonzo2012 P10, E9, E10; induction times by UV extinction or absorbance ilevbare2013c P9; pH-shift precipitation followed by polarized light, WAXS and HPLC hsieh2014 P2–P7; fluorescence and SHG for droplet and crystal read-outs jackson2014 P7, P10. In the physical-stability papers: nucleation-site counts in films [konno2006 P2; marsac2006a P4; konno2008 P4], melt or film growth rates [kestur2010b P3; rumondor2010 P5], PXRD crystallinity of stored powders [rumondor2009b P5]. In the ASD dissolution papers: non-sink dissolution of dispersions or of amorphous drug with polymer in the medium; solvent-shift solutions with predissolved polymer; induction times by extinction or pyrene; Raman of slurries for the solid konno2008a P3, P5; alonzo2010 P2, P4, P5; jackson2015 P3; ilevbare2013d P6.

Values in the library
materialvalue or classconditionspaper ids
8 drugs, 7 polymersmean amorphicity index PVP = PVPVA 70 > E100 67 > HPMC 66 > HPMCAS 62 > PAA 49 > PSSA 48spin-coated films, 7 days dry[vaneerdenbrugh2010b R5]
amides, bases against acids with PAA and PSSAhighest for amides (64–78) and bases; lowest for acids (8–31)as above[vaneerdenbrugh2010b R3, C3]
felodipine, 3% PVP, PVP/VA, HPMCAS, PVAcgrowth ratio at 70 °C 10.0, 6.5, 4.4, 1.2hot stage[kestur2010a R6]
bifonazole with 5% PAA5-fold at 100 °C, 15-fold at 18 °Chot stage[kestur2011 R7]
nimesulide with 5% PVP, PVP/VA, PVAcabout 21-, 16-, 3-fold at 18 °Chot stage[kestur2011 R9, X7]
50/50 powders, acidic drugs with PAA against PVPabout 64–117% against at most about 3% crystallinerotary evaporation, DSC[vaneerdenbrugh2010b R9]
acids, acidic N–H drugs, alcohols (13 drugs)AI with E100, PVP, PVPVA about 54–100; with PAA, PSSA mostly about 4–31spin-coated films, 7 days dry[vaneerdenbrugh2011a R3, C20, C25]
naringenin, quercetinhighest X-ray amorphous content: E100 about 85 and 70%, PAA about 30 and 20%rotary evaporation, PXRD[wegiel2013a R8]
naringenin, quercetin with E100 and PVPno crystals for >200 to >450 days at five conditionsPXRD[wegiel2013a R9]
lumefantrine–PVPVA; –enteric polymerscrystals at 1–8 weeks; only at 50% drug loading (1–40 weeks)40 °C/75% RHhiew2022a R6
IDM, PVPVA in solutionno nucleation for more than 12 h at 5–50 µg/mL; about 40 min withoutS = 6moseson2020a R3, C11
BCL, PVPVA 70 µg/mL and HPMCAS 1 mg/mL in solutioninduction above 1 h; none in 8 h; without polymer under 30 min37 °Cmoseson2021 R3
BCL–PVPVA dispersion in the slurryHPMCAS in the medium delays crystallisation by about 10 min and leaves form 2 growth unchangedRamanmoseson2021 R19, R20, C51
neat PCZ and BCL meltsnucleate within 1 h between Tg and Tm; IDM did not in 4 hDSC holds[moseson2020 R7]
twenty commercial polymers on ritonavir growth (outside)five effective: Pn-IPAAmd > HPMCAS > HPMC > CAPh > CMCABseeded growthilevbare2012c C22
bifonazole in melt-quenched films (outside)PAA the most effective polymer; PAA ineffective on acetaminophen in solution5 wt%[kestur2011 C9; trasi2015 C26]
erlotinib–HPMCAS against erlotinib–PVPVA, coated, 43% RHnone at 48 weeks against about 6 weeks40 °C, SEM[moseson2022a R11, R12]
felodipine, 1 µg/mL HPMCgrowth ratio 0.607; induction time 15.3 → 136.5 min; J/J_0 7.05 × 10⁻⁴S 10, 25 °Calonzo2012 R5, R16, R17
ritonavir, CAB Adp 0.81induction time ≈120 → ≈244 min5 µg/mL, 20 µg/mL drugilevbare2013c R9
celecoxib, HPMC2.4 → 12.6 min (22 µg/mL); 27.5 → 855.5 min (11 µg/mL)5 µg/mL, 37 °Cilevbare2013c R9, R15
danazol, HPMC-AS6–10 → 250–516 min10 µg/mL polymer, 25 °Cjackson2014 R17
warfarin, six polymersamorphous precipitate ≥ 6 h; 103–224 µg/mL1 mg/mL, pH shifthsieh2014 R4
celecoxib, 5 µg/mL HPMCASsupersaturation held 16 h; J_0/J_p about 4,00022 µg/mL drugxie2016a R3, R13
six dihydropyridines, 4.5 mg/mL polymerPVPVA = HPMC = HPMCAS > PVP > CMCAB = CAPAdp > P2VP = PAAnominal 10 mg/mLraina2015b C16, R9
telaprevir 150 µg/mL, 5 µg/mL polymerHPMC 243, HPMCAS 175–226, CA-Sub-090 106 min against 14–15 withoutpH 6.8, 37 °Cmosqueragiraldo2016 R4, R5
acetaminophen S 1.5, 10 µg/mL95% of vials: none 26, PAA 11, HPMCAS 470, HPMC 1043 min20 °Ctrasi2015 R1
atazanavir, volunteer media V5 and V6, 1 mg/mL HPMC134 ± 23 and 45 ± 7 → >360 minpH 6.5, 37 °Cenright2020 R28
telaprevir δ 28.8, 150 µg/mL HPMCAS-MF, four lecithin mediaabout 357–474 min, no difference37 °Clu2018 R7
enzalutamide 120 µg/mL, 50–100 µg/mL HPMCASabout 431–530 min; P177 about 71–125 minpH 6.5wilson2021 R3
felodipine with 3% PVP, HPMCAS or HPMCnucleation ≈1.3 × 10⁵ → ≈2–3 × 10³ m⁻³ s⁻¹, equal for all three0% RH, 22 °C[konno2006 R4, C14]
nifedipine and felodipine with 7 wt% PVPabout two orders of magnitude lower; 3–4-fold more to 25 wt%0% RH[marsac2006a R16, C18]
felodipine with 3% PVP vs HPMCAS≈8.6 × 10⁵ vs ≈1.3 × 10⁴ m⁻³ s⁻¹75% RH[konno2008 R3.b, C10]
felodipine with 3 wt% PVP K-90growth 21-fold slower at 70 °C, 6-fold at 110 °Cmelt[kestur2010b R8]
felodipine with 25–50% PVP vs HPMCAS51–82% vs 9–28% crystallized after ≈490 days75–93% RH[rumondor2009b R9, C13]
acetaminophen with PAA or HPMCASPAA the best growth inhibitor but most nuclei; HPMCAS the reverse10% w/w[trasi2012a C46, C53]
flutamide with acceptor or donor polymersacceptor polymers (PVP, PDMA, PIPA) slow growth; donor polymers do not10 mol%[trasi2012b C8, C50]
felodipine forms I and II with 3% PVPrate ratios ≈15.8 and ≈18.7 at 60 °C, ≈3.5 and ≈6.5 at 100 °Cmelt growth[kestur2013a R15]
celecoxib with PVP and TPGSslower than PVP alone at 70–120 °C at 10% PVPmelt growth[mosqueragiraldo2014 R2.b, C13]
resveratrol and curcumin dispersionsPVP and E100 best for resveratrol; E100 best, PVP worst for curcuminstorage at 84% RH[wegiel2013b R12; wegiel2014 R13]
ATP(S) vs ATP(R) with 5% HPMCAS-HF or -LFS 1.9–2.5 times faster than R (HF); R 1.5–1.9 times faster than S (LF)melt growth, 50–80 °C[sato2015 R5.i–l]
six compounds with 5% PHBratio with/without polymer ≈0.42–10, rising with compound Tgmelt growth[sato2016 R11]
indomethacin α vs γ with 10% HPMCratio without/with polymer ≈2900 vs ≈2.9 at 120 °Cmelt growth[tian2017 R12.i]
tacrolimus–HPMC 1:1 vs pure amorphous drugamorphous at 4 weeks vs crystalline after 2 weeks at 40 °C/75% RHopen dishtrasi2017 R16, C40
felodipine dispersions 75% HPMCAS / HPMC / PVPmaxima 14.1 / 4.9 / 2.3 µg/mLpH 6.8, 37 °Ckonno2008a R7
felodipine 9.5 µg/mL, 150 µg/mL polymer8.5–9.1 (HPMCAS), 7.8–8.9 (HPMC) µg/mL held; PVP to ≈2.8solvent shiftkonno2008a R14
amorphous indomethacin, 250 µg/mL PVP≈23.8 µg/mL held 4 h at 25 °CpH 2alonzo2010 R14
indomethacin solvent shift, 37 °Cnone ≈42 → ≈7.3 µg/mL in 30 min; HPMC ≈39 held about 2.5 hpH 2alonzo2010 R17
danazol dispersions PVP / HPMC / HPMCASinduction ≈56–70 / ≈188–200 / ≈284–319 minpH 6.8, 25 °Cjackson2015 R5
ritonavir 20 µg/mL, 5 µg/mL of 15 additivesinduction 23.6 to 242.8 against 119.3 minpH 6.8, 37 °Cilevbare2013d R12
nifedipine γ → α, 1 mg/mL polymerγ intact ≈20 (PVP), ≈60 (HPMC), ≈110 min (HPMCAS) against ≈1325 °Craina2014b R9
celecoxib 22 µg/mL, 5 µg/mL PVP-K12 / PVP-K29/32 / HPMCAS, HPMC / PAAonset ≈1 h / ≈2 h / more than 8–16 h / as no polymerpH 6.8, 37 °Cxie2015 R1; xie2016a R3
tacrolimus 50 µg/mL with 50 µg/mL HPMConset 6–8 h against within 3 hpH 4.5, 37 °Ctrasi2016 R9
indomethacin, 100 µg/mL HPMC against EPOheld ≈1.5 h against crystals during the titrationpH 2.2, 37 °Cxie2017 R5, R8
resveratrol dispersionsno matrix crystallization from 80% HPMC, 85% HPMCAS, 95% CMCABpH 6.8, 37 °Cwegiel2015 R14

Evidence table: crystallization inhibition.

Pitfalls and disagreements

Inhibition of growth, of nucleation and of overall crystallinity need not coincide: the best growth inhibitor of acetaminophen promoted nucleation [trasi2012a C46]. Polymers rank differently for different drugs [vaneerdenbrugh2010b C20; kestur2011 C29]. No polymer property tested at low levels (Tg, melting point, molecular weight) explained the order [kestur2010a C32, C34, C35]. The hydrogen-bond mechanism is a rank correlation over four polymers, and the demixing step is the authors' "speculation" [kestur2010a C38, C42]. Film results carried over to bulk powders for six of seven drugs [vaneerdenbrugh2010b C42, C43, C44]. The IR ranking of the polyphenol polymers separated the best and worst but not the middle ones, and polymer content differed from 30 to 80% in the stability comparison [wegiel2013a X4, X3]. The same ionic contact that protected lumefantrine dispersions slowed the dissolution of the enteric polymers hiew2022a C53. A polymer that inhibits in solution does not necessarily inhibit in the hydrating solid (HPMCAS and bicalutamide; polymers predissolved with amorphous nifedipine) moseson2021 C51; raina2014b C11. The mixing condition fails when the dispersion has phase separated, so water-induced separation can remove the benefit of the polymer [rumondor2009c C6]. Celecoxib with HPMC or HPMCAS at 22 µg/mL and 5 µg/mL polymer gave induction times of about 10–13 min in one laboratory and more than 8–16 h in another ilevbare2013c R9; xie2015 R1; xie2016a R3. Growth and nucleation data for the same polymers are often measured at different supersaturations ilevbare2013b X15. A polymer that raises the crystalline solubility or lowers the onset of phase separation changes the supersaturation it is credited with (F19) jackson2014 X9. In the solid state, equal effectiveness holds for felodipine nucleation when dry, not for growth (polymers differed several-fold) or in humid air [konno2006 C14; kestur2010a R6; konno2008 C10]. After moisture-induced phase separation the PVP level stopped mattering for crystallization at 93% RH [rumondor2009b C20]. The mechanism (barrier at the nucleus, hydrogen-bond coupling, polymer encaged in the crystal) was argued, not measured [konno2006 C40; kestur2010b C35, C42]. A polymer's effects on nucleation and on growth need not agree [trasi2012a C53]. Equal inhibition of two polymorphs is read as action in the liquid, unlike adsorption in solution [kestur2013a C6, C28]. PVP slowed felodipine bulk growth about sevenfold but surface growth only twofold [kestur2013b C32]. A polymer can also speed growth (PHB with high-Tg compounds) [sato2016 C29]; the factor depends on the polymorph and on the side of the growth maximum [tian2017 C37, C35]; and two grades of one polymer can favour opposite enantiomers [sato2015 C28]. PAA, the most effective polymer for bifonazole in melt-quenched films and the best growth inhibitor for acetaminophen melts, was ineffective on acetaminophen in solution (synthesis: contrast between papers) [kestur2011 C9; trasi2012a C46; trasi2015 C26]. In the ASD dissolution papers the ranking depends on the drug (PVP worked for indomethacin, not for felodipine, danazol or ritonavir) alonzo2010 C22; konno2008a R7; jackson2015 R5; ilevbare2013d R12. Solution screens predict only the rank order, and HPMC was misranked for felodipine konno2008a C31; jackson2015 X8. An additive can stabilize droplet size yet promote crystallization ilevbare2013d R14.

← Concepts and formulas

concept · as used in Dissolution

crystallization tendency

The propensity of an amorphous or supercooled drug to crystallize, expressed as a class from the melt or after solvent evaporation, as a growth rate, or as a time to crystallize in storage or solution [baird2010 C8; vaneerdenbrugh2010a C33; trasi2014a R1]. The inherent crystallization tendency is called the most important parameter of physical instability and is said to depend on conformational flexibility, configurational entropy, driving force, viscosity and hydrogen bonding, factors "not fully elucidated" trasi2017 C6. New aspect (PEG dispersions): the tendency can also be read in a dispersion, relative to the neat drug; in 20/80 comelts with PEG 3350 at 25 °C PEG delayed benzocaine, left haloperidol unchanged and brought forward ibuprofen and fenofibrate, so the authors conclude that PEG "can delay, promote or have no influence" on drug crystallization and that both the neat-drug tendency and the interaction with PEG matter [zhu2012 C6, C38, C39]. New aspect (solution methods): in solution work the tendency decides whether a supersaturated drug first phase-separates or first crystallizes; very fast crystallizers (nifedipine; nimodipine at 37 °C) crystallize just below the LLPS concentration unless a polymer slows nucleation, slow crystallizers form a drug-rich phase first [raina2015a R17, C11, C37; ilevbare2013a C27]. New aspect (Miscibility and drug-polymer interactions): the tendency of the neat drug carries into polymer dispersions. In a spin-coating screen of eight drugs with seven polymers, drugs whose pure amorphous form crystallizes rapidly (class I) "tended to be" more difficult to stabilize and, the authors say, needed more polymer; the overall crystallization tendency of a drug in the dispersions is related to that of the pure amorphous drug prepared in a similar way [vaneerdenbrugh2010b C1, C15]. Class I compounds are therefore "ideal model compounds" for telling polymers apart, whereas the compounds usually used as models in solid-dispersion work are often class III [vaneerdenbrugh2010b C16, C17]. Knowledge of the pure drug's tendency is called "extremely important" early in development and a guide to whether a dispersion is feasible [vaneerdenbrugh2010b C18]. Further cases: naringenin (intermediate crystallizer) and quercetin (rapid crystallizer) could not be made amorphous by rotary evaporation, naringenin only as a spin-coated film, and needed 15–80% polymer to give an amorphous dispersion [wegiel2013a C19, R7, R8]; the 15 model drugs of the donor–acceptor screen all have an intermediate to rapid tendency [vaneerdenbrugh2011a C16]; lumefantrine is a class III glass former (no crystallization on heat–cool–heat; Tg 19.7 °C) whose PVPVA dispersions crystallized in 1–8 weeks hiew2022a R3, R6. New aspect (ASD process): in process papers the tendency is a precondition: a drug must resist crystallization while the solvent leaves in granulation, so slowly crystallizing, larger and more complex molecules are "most suitable" for solvent granulation trasi2019 C35; ritonavir crystallizes slowly, so amorphous phase separation can be studied without crystallization interfering li2020 C15. Bicalutamide is "a fast-crystallizing compound in solution" and also crystallizes inside the hydrating solid; the authors name its low Tg, high crystallization tendency, high loading and fast polymer dissolution as the reasons for its susceptibility to matrix crystallization moseson2021 C6, C60. The tendency decides whether a residual-crystal level is tolerable: posaconazole, a fast crystallizer, lost supersaturation with 0.3% crystals, whereas indomethacin–PVPVA, a slow crystallizer, was little affected (cited) shah2024 C56, R26. Spray-dried ezetimibe–HPMCAS crystallized within 12–19 days at 40 °C/75% RH uncoated [duong2022c R16, R17]. New aspect (Bioperformance): the tendency is used as a descriptor to explain why felodipine reaches LLPS and nifedipine crystallizes first [raina2014a C31, R20]. Pretomanid is a low-Tg, class I rapid crystallizer (reduced glass transition temperature 0.67): its melt-quenched glass crystallized on heating just above Tg and within minutes at room temperature, and its solution crystallized within 2 min near the amorphous solubility [nguyen2023a C10, C59, C61, R1, R3, R4]. New aspect (Crystallization from solution): the solution counterpart of the class from the melt, that is how fast a drug crystallizes from a supersaturated aqueous solution, read as the type 1 or type 2 behaviour of a pH shift, as the precipitate form (crystalline against amorphous), or as an induction time at a defined supersaturation hsieh2012 C42; ilevbare2013c R8; hsieh2014 R4. It is only partly predicted by the melt class (see Crystallization tendency F18). The synchrotron WAXS ranking of six dihydropyridine precipitates (nifedipine 0.25 h to cilnidipine 12 h) is wider than their melt classes (two Class II, four Class III) raina2015b R1, R6. New aspect (Physical stability): the relative crystallization tendency of drugs from dispersions "may be dependent" on that of the pure drugs: nifedipine stayed the faster nucleator over felodipine in PVP at every content, dry and humid [marsac2006a C52; marsac2008a C7]. New aspect (Supersaturation from ASD dissolution): behaviour of neat amorphous drugs on wetting: nifedipine, a "relatively fast crystallizer" (cited), crystallized in the particle within minutes even with polymer in the medium, and its faster inherent crystallization than felodipine "appears" to carry over to water raina2014b M1, C10, C28; Tg alone did not rank felodipine and indomethacin alonzo2010 C42. Resveratrol, classed as a rapid crystallizer (cited), crystallized in or at the matrix of cellulosic dispersions within the first hour of slurrying, and its high melting point and rapid crystallization make effective polymeric inhibitors "essential" wegiel2015 R22, C27, C16; lopinavir, a slow crystallizer from solution, was chosen so that leaching and solubility could be measured over hours without crystals li2016b C5; li2018 C11.

Findings

Crystallization tendency: F9, F13, F14, F17, F18, F20. PEG dispersions: F8, F9. Solution methods: F8, F9. Miscibility and drug-polymer interactions: F15, F16, F23, F24, F26. ASD process: F22, F25, F27, F29, F31, F41, F43, F44. Bioperformance: F1, F10, F27. Crystallization from solution: F1, F3, F16, F21, F35, F36. Physical stability: F2, F17, F24, F33, F34. Supersaturation from ASD dissolution: F1, F2, F16, F23, F29.

Related concepts

measured by crystallization tendency classification; depends on nucleation, crystal growth rate, melt viscosity and thermodynamic driving force for crystallization; related to glass-forming ability, glass stability, physical stability, stochastic nucleation, nucleation induction time, heterogeneous nucleation, semicrystalline solid dispersion, liquid-liquid phase separation, crystallization and crystallization inhibition. Governs matrix crystallization; moderated by crystallization inhibition by polymers. Related to solution crystallization and reduced glass transition temperature. Measured in solution by chaser and non-chaser behaviour; related to conformational flexibility and nucleation rate; related to glass transition temperature.

Formulas

Hoffman equation, classical nucleation barrier; amorphicity index. Reduced glass transition temperature, printed in words for pretomanid (0.67; recomputed 0.673) [nguyen2023a E2, M1].

How it is measured or obtained

By the DSC cooling–reheating classification [baird2010 P1]; by spin coating and dry storage [vaneerdenbrugh2010a P9]; by seeded growth rates [trasi2014a P1]; by induction times or precipitate crystallinity in supersaturated solution ilevbare2013c R8; raina2015b R6; by storage of neat glasses [baird2010 P7; nguyen2023a R4]. In dispersions: the fraction P(t) of 50 neat melts that had started to crystallize at 25 °C, followed for about 500 h [zhu2012 P3]; onset and t_{50} of the drug in the comelt by XRD and by two Raman bands [zhu2012 P5, P6, R23]; simultaneous SAXS/WAXS of the blend from 0.2 min to 24 h [zhu2011 P2]; crystallization of each neat melt cooled to room temperature under polarized light [zhu2011 P7, R6]. In solution: by the order of extinction onset and visible crystals, with and without a nucleation inhibitor [raina2015a R4, R5], and by how long a drug-rich phase persists before the probe signal returns to the aqueous value (lopinavir 94 min; ritonavir not within 213 min) [tres2018 R20, R21]. For drug–polymer films of the spin-coating screen, by scoring crystalline area over 7 days and expressing it as an amorphicity index, averaged over drug/polymer ratios, polymers or drugs [vaneerdenbrugh2010b P2, P3, E1, E2, E3, E4]. The class of the pure drug is cited from the group's melt and spin-coating classifications [vaneerdenbrugh2010b R11]. In the process papers: isothermal DSC holds of the undercooled melt between Tg and Tm followed by reheating (a melting peak means nucleation during the hold): posaconazole 1 h at 130–160 °C and bicalutamide 1 h at 130–180 °C nucleated, indomethacin did not in 4 h at 130–150 °C [moseson2020 P7, R7]; in solution by induction time and seeded growth moseson2021 P12, R3. In raina2014a the tendency is cited, not measured: felodipine a slow and nifedipine a faster crystallizer [raina2014a R20]. The crystallization-from-solution papers cite the classes from cooling the melt (Baird 2010) and from rapid solvent evaporation (Van Eerdenbrugh 2010), and measure the solution tendency by the pH-shift titration or the unseeded induction time hsieh2012 P7; ilevbare2013c P9. In the physical-stability papers, by nucleation in films and crystallization on heating of melt-quenched glasses [marsac2006a P4, P10]. In the ASD dissolution papers: by time to crystallize in aqueous slurry (Raman) and by microscopy of wetted particles alonzo2010 P5; raina2014b P4, P6.

Values in the library
materialvalue or classconditionspaper ids
31 drugsMCV 216 to 0.02 µm/smelt growth[trasi2014a R1]
haloperidol, benzocainecrystallized within seconds after quench coolingpure melts[zhu2012 R1]
ibuprofen; fenofibratecrystallization probability 0.20 and 0.34 after 3 weekspure melts at 25 °C[zhu2012 R2, R3]
ketoconazoleamorphous after 24 h at room temperaturepure melt[zhu2011 R6]
nifedipine against felodipinegreater tendency for nifedipinemelt-quenched, heated at 2 °C/min[marsac2006a R5, C11]
propranolol against nicardipine saltspropranolol salts more prone to crystallizeamorphous salts[towler2008 C32]
dihydropyridinescilnidipine slowest, nifedipine fastest in solution; for six drugs the ranking is cilnidipine < felodipine = nisoldipine < nitrendipine = nimodipine < nifedipinesupersaturated buffer; synchrotronraina2015b C13, C28
nifedipine; nimodipinenifedipine a very fast crystallizer; nimodipine faster than the other four dihydropyridinesaqueous media (cited)[raina2015a R17]
felodipinerelatively slow; nifedipine fastercited[raina2014a R20, C31]
ritonavir, efavirenz (class III); celecoxib (class II)induction times about 120, 5.1 and 2.4 minsupersaturated buffer, 37 °C, calculated amorphous solubilityilevbare2013c M1–M3, R8
ritonavirlow tendency; drug-rich phase persists for 213 minno polymer, 24 °C[tres2018 P5, M1, C29, R20]
lopinavirdrug-rich phase lost after an induction period of 94 minno polymer, 24 °C[tres2018 P5, R21]
papaverine, warfarin, glyburide (slow); dipyridamole (rapid)slow from the melt but crystalline on rapid supersaturation; all crystallized without polymer within about 15–30 minpH shift, 25 °Chsieh2014 R1, R18, C30
pretomanidneat glass crystallized within minutesroom temperature[nguyen2023a R4, C10]
drugs with polymerspure-drug tendency related to that in dispersionsspin coating[vaneerdenbrugh2010b C1]
haloperidol in PEG 3350onset −100 s, t_{50} 7 s; crystalline from the first SAXS/WAXS frame20/80, 25 °C[zhu2012 R23.a, R23.b; zhu2011 R9]
benzocaine in PEG 3350onset 120–180 min, t_{50} 110–170 min20/80, 25 °C[zhu2012 R23.a, R23.b]
ibuprofen in PEG 3350onset about 100 min, t_{50} about 70 min20/80, 25 °C[zhu2012 R23.a, R23.b]
fenofibrate in PEG 3350onset 120–180 min, t_{50} 140–200 min20/80, 25 °C[zhu2012 R23.a, R23.b]
chlorpropamide; nilutamide in PEG 3350partially crystalline at 24 h20/80, 25 °C[zhu2011 R18.c, R18.e]
ketoconazole in PEG 3350amorphous at 24 h20/80, 25 °C[zhu2011 R18.f]
phenacetin, chlorzoxazone, benzamide, lidocaine, flufenamic acid (class I)mean AI over 7 polymers 47, 47, 48, 55, 59%spin-coated films, 7 days dry[vaneerdenbrugh2010b R4]
flurbiprofen (class I/II); chlorpropamide, bifonazole (class II)mean AI 68, 73, 97%as above[vaneerdenbrugh2010b R4]
class I films with every polymer at 75/25 drug/polymeralmost all fully crystalline (AI 0)as above[vaneerdenbrugh2010b R2]
naringenin; quercetinintermediate; rapid crystallizerneat films, rotary evaporation and spin coating[wegiel2013a C19, R7]
lumefantrineclass III; melting onset 127.9 °C, Tg 19.7 °CDSC heat–cool–heathiew2022a R3
bicalutamide in pH 6.8 buffernucleation in under 30 min without polymer, under 5 min at the highest supersaturation; seeded growth near zero at 30 µg/mL, extremely rapid at 150 µg/mL37 °Cmoseson2021 R3, R4
posaconazole and bicalutamide neat meltsmelting endotherm on reheating after 1 h holds below TmDSC[moseson2020 R7]
indomethacin neat meltonly Tg after 4 h at 130–150 °CDSC[moseson2020 R7]
ritonavir and lopinaviramorphous granules unchanged for one month at 40 °C/75% RHXRPDtrasi2019 R2
uncoated spray-dried ezetimibe–HPMCAS 50 and 70% DLcrystals by SEM at 19 and 12 daysopen dish, 40 °C/75% RH[duong2022c R16, R17]
uncoated ASD powders of four drug–polymer systemscrystals within about 1–2 weeks40 °C, 31–75% RH[moseson2022a R11]
PCZ 100 µg/mL in FaSSIF V2, seeds 10 µg/mL, HPMCAS 0 / 3 / 9 times the drug% left at 30 min about 4.5 / 10.5 / 43.5seeded solutionshah2024 R22
nevirapineinduction about 5 min at S 3.9 (fast without polymer)pH 6.5[hate2017 R2]
atazanavirrelatively slow; crystallization inhibited more than 4 h with enough polymercited[hate2018 C13]
pretomanidinduction time under 2 min at 160 µg/mL in seven media; melting onset of the crystals 147 °CDSC, 37 °C[nguyen2023a R1, R3, R4]
carvedilol, clotrimazole, clozapine, ketoconazoleclass III (melt) and III (solvent evaporation); type 2pH shifthsieh2012 M2, M3, M4, M7, R1
loratadineIII and II/III; type 2samehsieh2012 M8, R1
bifonazole; dipyridamole; droperidol; papaverine; pyrimethamineII/II; I/III; II/III; III/II; not classed; all type 1samehsieh2012 M1, M5, M6, M9, M10, R1
six dihydropyridinesmelt: nifedipine, nimodipine Class II; others Class III; solution: 0.25–12 hDSC; solvent shiftraina2015b R1, R6
nine drugs (griseofulvin, celecoxib, ezetimibe, danazol fast; telaprevir, nifedipine, nevirapine intermediate; ritonavir, atazanavir slow)induction time without polymer about 1 to 66 min100 mM phosphate pH 6.8, 37 °C; basis of the classes not givenmosqueragiraldo2018a R1, M1–M9, X11
nifedipine vs felodipine glass0.39 vs 0.17 × 10¹⁰ m⁻³ day⁻¹; only nifedipine crystallized on heating (87 °C)22 °C; 2 °C/min[marsac2006a R4.a, R5]
nifedipine vs felodipine with 25% PVP≈4.3 × 10⁵ vs ≈2.3 × 10³ m⁻³ s⁻¹75% RH[marsac2008a R1.f, R1.l]
resveratrolrapid crystallizer; a polymer is needed to make it amorphousspin coating, rotary evaporation, cryomilling[wegiel2013b R1, C6, C27]
curcuminintermediate crystallizer, relatively high tendencysolvent evaporation[wegiel2014 C9, C1]
celecoxibgrows fast but nucleates poorlymelt films[mosqueragiraldo2014 C7]
tacrolimus in a marketed generic capsulecrystallized within days at 40 °C/75% RH, faster than the pure amorphous drugopen dishtrasi2017 R12, R16, C28
lumefantrine; artemetherclass 3; class 1DSC heat–cool–heat[trasi2020 R5, R6, C7]
felodipine, neat amorphous≈54% crystalline at 1 minpH 6.8 slurry, 37 °Calonzo2010 R2
indomethacin, neat amorphousamorphous for at least 4 hpH 2 slurry, 25 °Calonzo2010 R11
nifedipine, neat glasscrystalline (γ) by ≈6 min with or without dissolved polymerpH 6.8, 25 °Craina2014b R6, R2
resveratrolrapid crystallizer (cited); Tm 262 °Cstorage and solvent-evaporation classwegiel2015 R22, M1
celecoxib, 22 µg/mL without polymercrystallization within 5 minpH 6.8, 37 °Cxie2016a C13
lopinavirslow crystallization from aqueous solutionpH 3li2016b C5
delamanidinduction time 2.4 min at pH 1.6 and 10.7 min at pH 6.5 at the amorphous solubility; no glass on cooling the melt at 50 °C/min; Tg 43.3 °C37 °Cduong2022a R2, R3
praziquantel, racemate and R-enantiomerabout 5.5 and 5 min without polymer at their amorphous solubilities; 83 min and 37 min with HPMCAS-MFPBS pH 6.5, 37 °Cpolyzois2024 R3, R4
paclitaxelunseeded crystallization within 6 min at S = 88 without polymerpH 6.8, 37 °Cque2018 R3
Pitfalls and disagreements

The tendency depends on route and medium: rapid and slow drying differ strongly [vaneerdenbrugh2010a C26], and the solid-state ranking need not hold in dilute aqueous solution hsieh2014 C30; in the dihydropyridine series, by contrast, the solution ranking and the two drugs that recrystallize from the melt coincide raina2015b C28. No single descriptor captures it [vaneerdenbrugh2010a C45]. In dispersions, heterogeneous nucleation by the carrier can break the link to the pure drug [zhu2012 C41]: the link "was found to break down for the slowly crystallizing compounds" ibuprofen and fenofibrate, because crystalline PEG apparently promotes their heterogeneous nucleation [zhu2012 C41]. The neat ibuprofen and fenofibrate statistics stop at 3 weeks and the dispersion runs have unstated replicates [zhu2012 X5, X6]. The neat-melt entries of the 2011 PEG paper (chlorpropamide, nilutamide and ibuprofen "within a few hours") come from single melts and sit beside the 50-sample statistics of the 2012 paper for ibuprofen [zhu2011 R6; zhu2012 R2]. The polymer fraction needed per drug is not tabulated, although the day-by-day scores show the highest drug fraction that stayed amorphous [vaneerdenbrugh2010b X13, R2]. The class of flurbiprofen depends on the solvent (class I from ethanol–dichloromethane, class II from ethanol), and the HPMC and HPMCAS films used the mixed solvent [vaneerdenbrugh2010b X2, X12]. Class III drugs were left out on the expectation of stability over a week [vaneerdenbrugh2010b C13]. Polymer and chemistry change the ranking within a class, so the class is a risk flag, not a prediction (see F15) [vaneerdenbrugh2010b C20]. The link from the neat drug to the dispersion held in the spin-coating screen [vaneerdenbrugh2010b C1] but broke down for ibuprofen and fenofibrate in PEG [zhu2012 C41] (synthesis: the two papers differ in carrier and test). Posaconazole, indomethacin and bicalutamide were chosen as class III glass formers, yet neat posaconazole and bicalutamide nucleated within an hour between Tg and Tm; an isothermal hold near Tm tests nucleation differently from the cooling and reheating test that defines the class (synthesis) [moseson2020 C5, R7]. The granulation conclusion rests on one pair of slow crystallizers trasi2019 C53. In the Bioperformance papers the tendency of the neat melt does not carry into solution with polymer (F10). A rapid crystallizer in the neat state and in solution can still be held by one polymer: HPMCAS-HF kept pretomanid in solution for over 1000 min at S = 5 while most enteric polymers failed within minutes (F27) [nguyen2023a R5]. In the pH-shift study class III covers all type 2 bases and also three of the four classifiable type 1 bases, so it does not separate the types hsieh2012 X1. Efavirenz is class III yet crystallizes in minutes at S about 2.3 ilevbare2013c R9.a, X4. Failing to crystallize in the DSC screen "does not guarantee" slow crystallization in solution raina2015b C29. The carry-over of the nifedipine–felodipine ranking into PVP dispersions rests on one drug pair and one polymer, and no PVP level giving equal stabilization of the two drugs was found [marsac2006a X7]. A favourable class did not protect a marketed product whose process left the drug outside the polymer: tacrolimus forms a stable glass, yet one generic crystallized faster than the pure amorphous drug trasi2016 C13; trasi2017 C28, C47. In the ASD dissolution papers nifedipine and felodipine have similar Tg and moisture sorption (cited) yet differ in water only when polymers are present raina2014b C27, R17; the felodipine–nifedipine comparison is cross-study raina2014b X16. Delamanid behaved like tacrolimus and bicalutamide, whose residual crystals the polymer does not poison, rather than like indomethacin duong2022a C58.

← Concepts and formulas

concept · as used in Dissolution

crystallization

In this chapter, the formation of crystals from a supersaturated solution or from a drug-rich phase; it depletes the supersaturation, unlike a drug-rich phase, which keeps it [tres2017 C42].

Findings

F3, F8, F9.

Related concepts

contrasts with drug-rich phase and liquid-liquid phase separation; related to crystallization inhibition, crystallization tendency and nucleation induction time.

Formulas

none.

How it is measured or obtained

By visual particles and birefringence under polarized light [raina2015a P7]; by the return of a probe signal toward its aqueous value (pyrene I1/I3, PRODAN lifetime) [raina2015a R16; tres2018 R21]; by a long lifetime component of the drug itself [tres2017 R1.g]; in outside work by PXRD of compacts bhardwaj2018 R3.

Values in the library
materialvalue or classconditionspaper ids
nifedipinecrystals in buffer at ≈38 (25 °C) and ≈58 µg/mL (37 °C)extinction onset with visible crystals[raina2015a R4, R5]
nimodipinecrystals at ≈21.5 µg/mL (37 °C)same[raina2015a R4, R5]
nifedipine with HPMCpyrene I1/I3 back to ≈1.60 at 400 µg/mL after ≈0.76 at 200 µg/mL25 °C[raina2015a R16]
felodipine 108 µM, no HPMClifetime component 9.04 ns (17%) after 15 hpH 7.4[tres2017 R1.g]
lopinavir, no polymerlifetime 1.31 ns at 94 min to 1.06 ns at 213 minpH 7.4, 24 °C[tres2018 P5, R21]
itraconazole dispersionsno crystallinity in compacts after dissolutionPXRDbhardwaj2018 R3, C14
Pitfalls and disagreements

Crystallization of a drug-rich phase was inferred from fluorescence in three papers and confirmed by an independent test in none of them [raina2015a X15; tres2017 X6; tres2018 X5]. Extinction cannot tell crystals from a liquid phase [raina2015a C9].

← Concepts and formulas

concept · as used in Dissolution

degree of crystallinity

The share of a sample that is crystalline

The library uses at least five bases for it. Taylor and Zografi write x_c, the mole fraction of the crystalline form in a binary mixture of two pure forms [taylor1998a E3]. Rumondor and Taylor define it per drug, the percent of the felodipine added as crystals, and convert to the sample by multiplying with the drug mass fraction [rumondor2010b E3, X12]. Correa-Soto and co-workers define "% crystallinity" as the weight per cent of crystalline drug in the whole powder and also give the per cent of the drug crystallized [correasoto2017 E1, X6]. Kestur and co-workers use the field-averaged SHG intensity, background-subtracted and divided by that of a crystalline reference, as "relative crystallinity": for blends the share of crystalline naproxen in the blend, for the dispersion the share of the 25 wt% drug [kestur2012 E8, X11]. Wanapun and co-workers express a limit as a volume fraction [wanapun2010 E3]. The bases are not interchangeable (F4).

Findings

F1, F2, F3, F4, F7, F8, F9, F10.

Related concepts

measured by partial least squares regression and second harmonic generation; limited by limit of detection and limit of quantitation; related to residual crystallinity and polymorphism.

Formulas

drug-basis to powder-basis crystallinity conversion, Kontoyannis two-band intensity ratio calibration, SHG relative crystallinity.

How it is measured or obtained

From the ratio of a crystalline to an amorphous Raman band, corrected for overlap [taylor1998a P7, E5]; from PXRD, as a Bragg-peak area ratio or by whole-pattern PLS or OPLS calibrated on the dispersion plus crystals [rumondor2010b P6, P7; kestur2012 P9]; from Raman spectra by OPLS [kestur2012 P11]; from SHG image intensity normalized to a crystalline standard [kestur2012 P7; correasoto2017 P10]; and from 19F ssNMR spectra deconvoluted into amorphous and crystalline components [correasoto2017 P5]. Standards are physical mixtures of the two forms or the amorphous dispersion mixed with crystalline drug at fixed total drug content [taylor1998a P4; rumondor2010b P2; correasoto2017 P6]. Their "actual" values are the weighed compositions, which Kestur and co-workers did not verify after milling [kestur2012 X12].

Values in the library
materialvalue or classconditionspaper ids
indomethacin milled 5, 15, 30 min85.0, 77.5, 63.5% (Raman-equivalent, two-state calibration)FT-Raman, Wig-L-Bug with ball[taylor1998a R16, X9]
felodipine–PVP at 25, 50, 75% PVPRMSEE 2.2, 1.9, 4.7% of the drug (PLS); 11.2, 17.0, 23.6% (area ratio)18 calibration samples per level[rumondor2010b R9, P2]
naproxen–HPMCAS 75/25 dispersion, 60 °CSONICC about 24 to 48% of the drug over 0–48 h; PXRD about 27 to 54% and Raman about 26 to 44% from 2 hread from plots[kestur2012 R16]
flutamide–HPMCAS 15%, 40 °CXRPD 1–2% (days 35–53); 19F ssNMR 1, 3.8, 4.6% (days 35, 39, 48)15% = all drug crystalline[correasoto2017 R12, R14]
ezetimibe–HPMCAS 30%, 60 d, 82% RHSHG about 11.5%, XRPD about 12%, ssNMR 17% of the drug; about 3.5% of the powder40 °C[correasoto2017 R21, R22, R23]
posaconazole HME ASD at 10, 25, 50 wt% DLSHG 0.3, 3.2, 19.3 wt% of the ASD (3.3, 12.7, 38.7 wt% of the drug); pXRD 2.4% at 25 wt% and 23.1% at 50 wt%HME at 125 °Cshah2024 R9, R10
BCL–PVPVA extrudatesbelow 1% (S/155), 3.5% (M/155), 30% (L/155) by XRPDLOD about 1%moseson2021 R6
Pitfalls and disagreements

The basis (mole, mass, volume, per drug, per powder) and the drug loading must be stated; at 15–30% drug a powder-basis figure is 3.3–6.7 times smaller than the per-drug figure (synthesis: 1/0.30 to 1/0.15). A two-state calibration made from physical mixtures gives only an equivalent value for milled material that is partly disordered throughout [taylor1998a C17, X9]. RMSEE is an error on the calibration samples, not a validated prediction error [rumondor2010b X3; kestur2012 X4]. A calibration made from the as-received crystals can fail for crystals grown in the dispersion: flutamide SHG reached about 3 times the fully crystalline standard [correasoto2017 R9, C20].

← Concepts and formulas

concept · as used in Dissolution

degree of substitution

The average number of the three hydroxyl groups of an anhydroglucose unit of cellulose that carry a given substituent (maximum 3); DS (CO2H) counts the substituents that end in a free carboxyl (adipate, suberate, sebacate) ilevbare2012c M23–M36, P8; ilevbare2013b M11–M13. For the cellulose ω-carboxyalkanoate esters synthesized for ASDs the adipate chain adds hydrophobicity and its terminal carboxyl ionizes at intestinal pH ilevbare2012c C9, C10. For telaprevir a high carboxylic acid DS worked (CAP-Adp-085 and CA-Sub-090 about 70 and 106 min at 5 µg/mL; about 472 and 500 min at 50 µg/mL) and a low one failed (CAP-Seb-024, DS 0.24, about 9 min) mosqueragiraldo2016 R5, M13.

Findings

F8, F11, F25, F36.

Related concepts

related to polymer ionization, polymer hydrophobicity and solubility parameter.

Formulas

none (a ratio of substituents from NMR integrals).

How it is measured or obtained

From ¹H NMR for each substituent; the molecular weight by SEC (polystyrene equivalents) and Tg by DSC complete the polymer description ilevbare2012c P8, P9, P10. Total DS runs from 2.16 to 2.98 for the 14 esters of the ritonavir screen and from 2.38 to 2.98 for the five adipates of the pH study ilevbare2012c M42, X2; ilevbare2012b M2–M7.

Values in the library
materialvalue or classconditionspaper ids
CAP Adp 0.85; CAB Adp 0.81; CA 320S Adp; CAP Seb 0.67; CP Adp; CAP Adp 0.33; CAB Adp 0.25DS (CO2H) 0.85; 0.81; 0.67; 0.67; 0.48; 0.33; 0.25ritonavir growth ratios 2.98; 2.70; 1.83; 0.85; 1.68; 1.64; 0.99ilevbare2012c R11
eight esters with DS (CO2H) 0.19–0.26growth ratios 0.83–1.015 µg/mLilevbare2012c R11
CAP Adp 0.85 against 0.33; CAB Adp 0.81 against 0.25same backbone, higher DS (CO2H) gives 2.98 against 1.64 and 2.70 against 0.99ritonavirilevbare2012c R11
CA 320S Sub 0.63; CA 320S Sub 0.90; CA 320S SebDS (CO2H) 0.63; 0.90; 0.57ritonavir growth ratios 10.8; 12.6; 5.7ilevbare2013b R9, M11–M13
CAP-Adp-085; CA-Sub-090; CAP-Seb-02470, 106, 9 min (150 µg/mL telaprevir, 5 µg/mL polymer)pH 6.8, 37 °Cmosqueragiraldo2016 R5
A5a, A5b (carboxylated side chain on cellulose acetate)DS 0.79 and 0.67; acetyl 1.82; modelled at DS 0.50synthesized; MD modelmosqueragiraldo2018a M10, M11, X9
ECA–ECD (ethyl cellulose ethers)ethyl DS 2.3, side-chain DS 0.69synthesizedmosqueragiraldo2018a M12–M15
dansyl-labelled HPMCASlabel DS about 0.003 from NMR integrals; hydroxypropyl MS 0.69¹H NMRwilson2021 R23, E2
Pitfalls and disagreements

DS (CO2H) and the solubility parameter co-vary within each backbone series, so only two single polymers (CA 398-30 Adp, CAP Seb 0.67) separate their effects ilevbare2012c X10. The DS (CO2H) ranks of Table 3 are inconsistent, the Fig. 8 order is not strictly by DS (CO2H), and the outlier is named "CAB Seb 0.67" in places ilevbare2012c X3, X4. The total DS of CAB Adp 0.81 is 2.84 or 2.94 ilevbare2012c X2; ilevbare2012b X6. The size of the pH 3.8 loss does not follow DS (CO2H) in the middle of the ranking ilevbare2012b X17. Polymer compositions are not repeated in the nucleation paper ilevbare2013c X15. A5a and A5b differ in side-chain DS (0.79 against 0.58 plus 0.09 unreacted), DS(OH) and Tg as well as spacer length mosqueragiraldo2016 X25. The tether pair A5a and A5b also differs in side-chain DS (0.79 against 0.67), so the tether effect is not isolated mosqueragiraldo2018a X12.

← Concepts and formulas

concept · as used in Dissolution

desupersaturation

The fall of the dissolved concentration after supersaturation was reached, because crystals nucleate or seeds grow; in an ASD it "corresponds to the crystal growth rate exceeding the dissolution rate" moseson2020a C14. A plateau is not the same as a fall: a crystal-free bicalutamide dispersion that stayed at about 18 µg/mL (30 µg/mL dose) without desupersaturation was read as crystallisation inside the dissolving solid, which caps the concentration without lowering it afterwards moseson2021 C17, R14. In the posaconazole pH-shift test the concentration falls below the LLPS concentration (about 19 µg/mL in the intestinal medium) when crystals present or newly formed consume the supersaturation; this is not a return to the crystalline solubility of 1.2 µg/mL shah2024 R11, X15. New aspect (Bioperformance): the loss of supersaturation, mostly by crystallization from solution or in the matrix; its onset is read from a concentration fall [elkhabaz2017 C19, C23]. In dissolution of enzalutamide–PVPVA dispersions and tacrolimus capsules the fall after the maximum was read as crystallization, from seeds in the product or formed in the medium; absorption lowers the donor too [wilson2018 C18; purohit2019 C17, C34; hate2019 C20, C30]. New aspect (Crystallization from solution): with seed crystals present it reflects growth of the seeds; without seeds the crystals must first nucleate, so the profile has a flat start (the induction time) followed by a fall alonzo2012 P4, P5; ilevbare2013c R7. New aspect (Supersaturation from ASD dissolution): the fall of the concentration after a dissolving amorphous solid or dispersion has supersaturated the medium, read as crystallization from solution, sometimes together with crystallization of the remaining solid alonzo2010 C16, C21; jackson2015 C14.

Findings

ASD process: F25, F26, F27, F28, F38, F39, F40, F41, F46. Bioperformance: F9, F10, F11, F12, F14, F16, F23, F28, F29, F30. Crystallization from solution: F4, F5, F14, F20, F23, F24, F27, F33, F42. Supersaturation from ASD dissolution: F4, F5, F6, F15, F16, F20, F22, F26, F28.

Related concepts

read in non-sink dissolution; driven by crystal seeding; slowed by crystal growth inhibition; contrasts with matrix crystallization. Loss of supersaturation; caused by solution crystallization and secondary nucleation; also lowered by an absorptive sink; driven by crystal growth rate and nucleation induction time; summarized by supersaturation factor; related to residual crystallinity.

Formulas

power-law crystal growth rate, initial growth rate from the desupersaturation slope, supersaturation factor, supersaturation ratio, overall mass crystal growth rate.

How it is measured or obtained

From the concentration–time profile after the maximum, or from seeded runs: 50 µg/mL indomethacin made by antisolvent addition and 10–50 µg/mL bulk seeds added, with the growth rate R_G in µg/s taken from the profile (extraction method not printed) moseson2020a P10, P20, X12. In the Bioperformance papers: concentration–time profiles, UV at 233 and 350 nm for induction time, with SHG or PLM to confirm crystals [elkhabaz2017 P5, P8, P10]. In the crystallization-from-solution papers: concentration against time by a fibre-optic UV probe on second-derivative spectra (every 2–5 s), in seeded runs (slope of the first 2–5 min as initial growth rate) and unseeded runs (flat start, then fall); light-scattering extinction and pyrene fluorescence give the matching signals for droplets and crystals alonzo2012 P3; ilevbare2012a P8; jackson2014 R15. In the ASD dissolution papers: in situ UV during non-sink dissolution or after a solvent shift; a rise of the pyrene ratio confirms loss of the drug-rich phase konno2008a P5; alonzo2010 P3, P4; jackson2015 P2, P3; drug in the filtered liquid of suspensions chen2015a P11.

Values in the library
materialvalue or classconditionspaper ids
IDM, 50 µg/mL, no polymerunseeded about 50 → 25.6 µg/mL at 120 min; with 50 µg/mL seeds about 26.9pH 4.5, 37 °Cmoseson2020a R3.a, R3.d
IDM, 50 µg/mL, 5 µg/mL PVPVA, 50 µg/mL seedsabout 50 → 37.1 µg/mL in 720 minsamemoseson2020a R3.h, X6
IDM–PVPVA extrudatesslight fall after the peak above 3% crystallinity (131-2 about 40.6 → 39.4; 117-2 about 30.9 → 28.8)50 µg/mL total dosemoseson2020a R6
BCL–PVPVA S/155 and M/155about 32.4 → 24.5 and about 28.2 → 16.2 µg/mL150 µg/mL dose, 4 hmoseson2021 R12
paclitaxel–HPMCAS with 18 wt% seeds (outside)desupersaturation by crystal growth; HPMCAS cannot block it completely16 hque2018 C30
tacrolimus capsules (outside)steep decline after the maximum shows that seeds grow rapidly in 100 mLpH 4.5purohit2018 C43
PCZ–HPMCAS 10% DL, 0.3% crystals against nonepeak about 178 → 18.5 µg/mL at 150 min against about 172.5 → 125 µg/mL at 300 minpH shift at 60 min, dose about 200 µg/mLshah2024 R12, R14
PCZ–HPMCAS 25% DL, 3.2% crystals against nonecrystallization after 45 min against about 1.5 hsameshah2024 R15, C29
BCL–PVPVA 30% DL, 3% SDS, cryomilled 5 minpeak about 84% at 45–60 min, then about 78% (about 23 µg/mL)dose of at most 30 µg/mL[moseson2022b R10]
PCZ 20 µg/mL in FaSSIF V2, HPMCAS 0 / 9 times the drug; seeds 0 / 5 / 10 µg/mL% left at 30 min about 66 / 46.5 / 25; about 99.5 / 96 / 74.5seeded solutionshah2024 R22
ezetimibe PVP ASD, FeSSIF195 µg/mL at 15 min to 41 at 30 min37 °C[elkhabaz2017 R14]
ezetimibe ASDs, bufferdecline after about 30 min[elkhabaz2017 R10, C19]
tacrolimus generic, 100 mLabout 98% released at 20–30 min, 39.5% at 120 minmedium Ipurohit2018 R7
felodipine, no polymer, unseededabout 5.35 → 1.54 µg/mL from about 10–15 min to 150 minS 10alonzo2012 R15
paclitaxel–HPMCASnone unseeded; present with 18 wt% seeds16 hque2018 R13
pazopanib19.8 to about 1 µg/mL at 60 minpH 6.5sugihara2018 R8
enzalutamide PVPVA ASDsmaximum close to the amorphous solubility, then fall; 10:90 HPMCAS peak only 10 µg/mL with crystals in the medium100 µg/mL total, 12.5 mL, pH 6.5[wilson2018 R6, C18]
tacrolimus, seeded solutionsrate about 0.39 at 50 µg/mL against 0.075 at 20 µg/mL; growth order 1.677seeds from the crystallized generichate2019 R17, R18, C30
tacrolimus 50% and 100% crystalline capsule contents15 and 4 µg/mL at 2 h, still above the crystalline solubility5 mg in 100 mL, pH 4.5purohit2019 R4
felodipine, 1 µg/mL HPMC, seeded; unseeded5.1 → 2.17 µg/mL in 58 min; 5.38 → 5.03 over 198 minS 10, 25 °Calonzo2012 R18
ritonavir seeded, none; CAP Adp 0.8510.0 → 6.9; 10.15 → 9.25 µg/mL in 2 minS 7.6, 37 °Cilevbare2012c R7
danazol 20 µg/mL, no polymerapparent UV concentration 19.2 → 14.4 → 11.8 → 2.1 → 1.4 µg/mL at 1, 5, 10, 30, 60 min25 °Cjackson2014 R15
celecoxib, HPMC, start S 14.7S 15 for 15 min, 7.8 at 35 min, 4.9 at 100 min, 4.3 at 200–240 min37 °Cilevbare2013c R16
paclitaxel with 18 wt% seeds (ASD dissolution chapter)desupersaturation immediate without polymer37 °Cque2018 R7
telaprevir seeds, 1.86 mM STCDCflat at about 11.2 and 72 µg/mL for 240 min; buffer 4 and 6δ 2.4 and 12.5lu2017a R11
telaprevir after 15 h, δ 12.5residual 60.5 (STCDC), 91.7 (SGCDC), 9.0 (STC) of 65.2–95.2 µg/mLdiffusion celllu2017a R12
acetaminophen seeded19.5–19.8 → 13.0 (none) and 16.1 mg/mL (HPMC) at 24 hS 1.5, 20 µg/mL polymertrasi2015 R11
atazanavir, posaconazole after nucleation, three mediaatazanavir 1.0, 4.2, 0.3; posaconazole 0.6, 1.9, 1.7 µg/mL·min (buffer-V1, FaSSIF-V1, composite)37 °C, slope after the breakelkhabaz2021 R8, E7
posaconazole at S 33.6 with nanocrystal seedsfrom about 8.5 to 4.9 µg/mL by 4 min (2 µg/mL seeds), to about 3.4 within about 1 min (20 µg/mL)PBS pH 6.5duong2022b R13
felodipine 50 µg/mL nominal, 150 µg/mL PVP; none≈6.3 → ≈1.9 µg/mL in 240 min; ≈2.7 → ≈1.05solvent shift, 37 °Ckonno2008a R12
indomethacin, solvent shift, no polymer≈27.3 µg/mL held about 25 min, then ≈5.3 at 90 minpH 2, 25 °Calonzo2010 R18
felodipine 90:10 HPMC, 90 µg/mL addedapparent ≈75 µg/mL at 5 min, ≈22.6 at 50 min37 °Calonzo2011 R2
danazol 90:10 PVP dispersion≈9.2 µg/mL at 60 min to ≈2.2 at 420 min, pyrene ratio risingpH 6.8, 25 °Cjackson2015 R12
nifedipine–HPMC 50:50≈100 µg/mL at ≈22 min to ≈41 at 150 min37 °Craina2014b R14
celecoxib–HPMCAS suspension, SDSS ≈8.6 at about 5 min to ≈3.2 at 1 hpH 3, 25 °Cchen2015a R17
celecoxib 22 µg/mL: none / 5 µg/mL PVP-K12 / PVP-K29/32≈20.8 → ≈4.1 in 1 h / ≈20.9 → ≈4.4 by 8 h / ≈9.1 µg/mL at 8 hsolvent shift, pH 6.8, 37 °Cxie2015 R2
celecoxib–PVP-K12 50% dispersion≈21.0 µg/mL near 6 h → ≈6.5 at 16 hpH 6.8, 37 °Cxie2015 R6
celecoxib 22 µg/mL seeded: none / 5 µg/mL HPMCAS≈22.5 → ≈4.0 in 30 min / → ≈16.0 µg/mL at 4 hpH 6.8, 37 °Cxie2016a R11
tacrolimus 50 µg/mL: none / 50 µg/mL HPMCfall from ≈150 min / from ≈400 minpH 4.5, 37 °Ctrasi2016 R9
indomethacin–EPO 3:7 dispersion≈77 µg/mL (UV) → 8.8 µg/mL (HPLC) at 1 hpH 2.2, 37 °Cxie2017 R11
lopinavir 50%: EUD, CAP / HPMCPloss within ≈10–12 h / none in 48 hpH 3, 25 °Cli2018 R6
paclitaxel–HPMCAS 49/51 with 18 wt% seeds≈31–33 µg/mL reached, then ≈7.9–25.3 µg/mL left at 16 h depending on the seed typepH 6.8, 37 °Cque2018 R14
posaconazole–HPMCAS 10% dispersion, high against low dose≈22–24 µg/mL to 120 min then ≈6–8; ≈17–21 µg/mL to 90 min then ≈8 µg/mLFaSSGF → FaSSIF, 37 °Celkhabaz2019a R6, R12
praziquantel–HPMC E5 LV dispersions, 1.5 mg/mLa 30% drop in FaSSIF after about 75–82%; R-enantiomer lost dissolved drug in every medium37 °Calvarenga2025 R14, C36
Pitfalls and disagreements

Growth rates are vessel mass rates, not normalised to seed area moseson2020a X12. In the bicalutamide tests the desupersaturation at 150 µg/mL is attributed to growth from solution, whereas the overall low plateau is attributed to growth in the solid moseson2021 C21, C46, X4. The IDM extrudates may have lost concentration by growth into the surrounding amorphous solid rather than from solution moseson2020a X15. In the posaconazole test the focused beam reflectance signature read as secondary nucleation for the crystal-containing 25% dispersion has the same form as the one read as primary nucleation for the crystal-free one shah2024 K3, K4, X14. For bicalutamide with cryomilled surfactant powders the loss is attributed to nuclei in the milled matrix and was not measured [moseson2022b C26]. In the Bioperformance papers concentration alone cannot separate LLPS from crystallization in turbid media [elkhabaz2017 C30]. Absorption also lowers the donor (F14). With an absorptive sink the fresh generic tacrolimus did not lose supersaturation at 240, 100 or 40 mL, unlike in a closed vessel; only at 40 mL did total dissolved drug fall for the 20% sample (F14, F28) hate2019 R11, C20, C35. Apparent UV concentration of a colloidal solution is distorted by droplet size changes: at 20 µg/mL danazol the early fall is attributed to droplet coalescence, not crystallization, and orthogonal methods are needed jackson2014 C29, C54, C55. The seeded profile includes any secondary nucleation ilevbare2012b X18. After crystallization with HPMC the celecoxib solution sat at S 4.3, not 1, at 240 min ilevbare2013c R16. In the ASD dissolution papers apparent UV falls above the amorphous solubility can come from particle growth or settling as well as from crystallization alonzo2011 C14; jackson2015 C12. With HPMC the felodipine solution kept falling slowly; the PVP and buffer solutions approached but did not reach the crystalline solubility in 4 h konno2008a X10. After crystallization the celecoxib readings settled at ≈2.6–2.9 µg/mL, above the 1.5 µg/mL crystalline solubility measured by HPLC xie2016a X4. With crystals present from the start, the onset of desupersaturation marks the time at which growth outpaces redissolution of amorphous material, not the onset of crystallization elkhabaz2019a C49.

← Concepts and formulas

concept · as used in Dissolution

droplet coalescence

The merging of drug-rich droplets into larger ones; the growth of the ritonavir droplets from about 345 to about 842 nm in 64 min is "consistent with coalescence of the droplets, commonly observed in LLPS" ilevbare2013a R3, C18. The papers of 2017–2022 add ibuprofen droplets, which in buffer coarsened and creamed within 1–2 h, whereas with HPMC they stayed at 345–385 nm for 3 h; flocculation and coalescence were not told apart by DLS because the droplets creamed ueda2020b R7, R15, C39, C40. New aspect (Crystallization from solution): for danazol the authors attribute the early fall of the apparent UV concentration of a phase-separated solution (19.2 to 11.8 µg/mL over 10 min at 20 µg/mL) to coalescence of the drug-rich droplets, which changes how they absorb and scatter light, not to crystallization ("is attributed") jackson2014 C29, R15. Polymers adsorbed at the droplet surface are inferred to reduce coalescence because the droplets stay smaller ("it is inferred") jackson2014 C33. In the later danazol paper DLS sizes fell from about 350 to 103–136 nm with 1000 µg/mL polymer while NTA means stayed at about 181–270 nm, which the authors read as polymer reducing the formation of some larger droplets, "probably through coalescence" jackson2016 R19, R21, C30.

Findings

Amorphous solubility and LLPS: F1, F22. Crystallization from solution: F4, F15.

Related concepts

changes the size of the drug-rich phase; occurs in liquid-liquid phase separation. Papers of 2017–2022: Ostwald ripening, colloidal stability. Reduced by polymer adsorption to drug-rich droplets; related to zeta potential.

Formulas

none.

How it is measured or obtained

DLS mean size against time after a single addition of stock at the onset concentration, 37 °C ilevbare2013a P11, R3. DLS Z-average over hours, UV absorbance and extinction, and pyrene fluorescence on the same solution jackson2014 P8, P9.

Values in the library
materialvalue or classconditionspaper ids
ritonavir dropletsabout 345, 447, 536, 677, 842 nm at about 1, 10, 28, 46, 64 minwater, 37 °Cilevbare2013a R3
ibuprofen droplets, stirred 3 hbuffer below detection at 30 min; HPMC 345–385 nm; PVP-VA 320–440 nm with count rate 470 → 35 × 10⁶ cps; EUD-E 810 → 1110 nmpH 2.0 (D2O), 37 °C, 300 rpmueda2020b R7
danazol aloneabout 490 nm at once; about 9800 nm at 1 h25 °C, above the onsetjackson2014 R22
with PVPabout 240–250 nm to 1 h; about 2900 nm at 2 h10 µg/mL polymerjackson2014 R22
with HPMC; HPMC-ASabout 305–345 nm to 2 h and 820 nm at 4 h; about 230–250 nm to 4 h and 1250 nm at 6 hsamejackson2014 R22
ritonavir nanodroplets (ASD dissolution chapter)stabilized against coalescence "likely" by charge repulsion between adsorbed polymers37 °Cilevbare2013d C38
danazol droplets, PVP, HPMC, HPMC-ASDLS z-diameter about 350 → 103–136 nm; NTA 181–270 nm1–1000 µg/mL, 25 °Cjackson2016 R19, R21
Pitfalls and disagreements

Coalescence itself was not observed; size growth is read as its sign ilevbare2013a C18. Droplet size also differs with the technique and the drug (about 116–387 nm for the weak bases) indulkar2015 R14. For danazol no droplet size was measured in the first minutes for the drug alone: the DLS points are 0 and 1 h, the second after crystallization (induction 6–10 min), so coalescence is inferred from the UV signal jackson2014 X6. The danazol concentration for DLS is not printed jackson2014 X11. Time after supersaturation and drug level of the 2016 measurement are not stated jackson2016 X12.

← Concepts and formulas

concept · as used in Dissolution

drug adsorption onto silica

Uptake of dissolved drug onto a silica surface

For drug-loaded mesoporous silica the papers hold it responsible for incomplete release: dissolved drug returns to the surface in a dynamic equilibrium [dening2018 C23, C4; dening2019 C4]. Neutral drugs bind mainly by hydrogen bonds from silanols to their acceptor groups, and weak bases still charged at the test pH mainly electrostatically [dening2019 C52; mccarthy2020 C41; hate2020b C28, C35]. Adsorption grows with supersaturation, which the authors relate to the higher activity of the dissolved drug ("can be proposed") and which competes with solvation [dening2019 C39; hate2020b C9, C31].

Findings

F3, F4, F5, F6, F7, F9.

Related concepts

measured by an adsorption isotherm; occurs through drug-silanol hydrogen bonding or ionic interactions; part of a dynamic adsorption-desorption equilibrium; cause of incomplete drug release; grows with supersaturation.

Formulas

adsorbed amount by solution depletion, competitive solvent-drug adsorption equilibrium.

How it is measured or obtained

Solution depletion with blank silica added to a drug solution, or isotherms over a range of concentrations [dening2018 P8; dening2019 P3; hate2020a P13; hate2020b P2; mccarthy2020 P7].

Values in the library
materialvalue or classconditionspaper ids
ritonavir, blank SBA-15 about 100 µg/mL28 → about 22 µg/mL (about 20% adsorbed)pH 6.8, 2 h[dening2018 R13]
ritonavir, loaded SBA-15 in medium at 28 µg/mLabout 600 µg more taken up (27% w/w)pH 6.8[dening2018 R14, R15]
ritonavir on SBA-15up to 424 mg/gpH 6.8, isotherm[dening2019 R2]
atazanavir on SBA-15up to about 20.8 mg/g (300 µg/mL silica)HPMC, 2 h[hate2020a R2]
ketoconazole; clozapine; atazanavir on SBA-15pH 6.8 top points about 66; 53; 21 mg/gHPMC[hate2020b R3, R4, R5]
indomethacin; methyl ester on SBA-15up to about 289; 342 mg/gpH 2.2, HPMC[mccarthy2020 R7, R8]

Evidence table: drug adsorption onto silica.

Pitfalls and disagreements

The adsorbed amount is always derived from what is missing in solution; no paper measured drug on silica during release [dening2019 X18]. Per-gram values depend on the silica concentration used [hate2020a X15]. Blank silica took up only about 20% of ritonavir while loaded silica kept about 50%, so retention "may therefore depend only in part on the adsorption equilibrium" [dening2018 C47].

← Concepts and formulas

concept · as used in Dissolution

drug-controlled release

Dissolution paced by the drug itself, slow and typical of high drug loading, in which the driving force vanishes once the amorphous solubility is reached and no droplets form [li2019 C48; purohit2017b C50]. New aspect (Supersaturation from ASD dissolution): at moderate to high drug loading the polymer leaves the dissolving surface faster than the drug, and a drug-rich interface, "possibly" amorphous, regulates dissolution; if it stays amorphous it "would presumably" cap the concentration at the amorphous level alonzo2011 C37, C46. For marketed tacrolimus capsules the authors "believe" that a 50% drug loading reported for the innovator makes dissolution drug controlled, so that no drug nanospecies form trasi2016 C41; a celecoxib paper recalls the cited analysis in which, at high loading, the polymer dissolves faster and leaves a drug-rich layer xie2016a C4. New aspect (Release mechanism and LoC): above the limit of congruency the polymer leaves first and the drug dissolves from a drug-rich surface, by dx/dt = C(S - x) with S the amorphous solubility, so the concentration cannot pass S and no LLPS occurs purohit2017b E3, C50; indulkar2019a C48. Release stops in a medium presaturated with drug indulkar2019a R12, C42. The authors describe the drug rates as close to the neat amorphous drug saboo2019 C12; saboo2020a C16, but several lie well above it saboo2019 X9. Above the limit indomethacin released at about 5–20 times the rate of amorphous indomethacin alone (synthesis: 0.01/0.002 to 0.04/0.002) saboo2020 R3. The 2022 ritonavir surfactant paper restates the regime with the Nernst–Brunner form and the 50% ritonavir result of 2019 indulkar2022 E2, C21, R3.

Findings

ASD process: F14, F15, F21, F23, F38, F48. Supersaturation from ASD dissolution: F7, F9, F10. Release mechanism and LoC: F1, F3, F6, F7, F14, F17.

Related concepts

contrasts with polymer-controlled release; promoted by surface drug enrichment; related to drug-rich surface layer and drug loading. Follows incongruent release; stops by the Nernst-Brunner equation at the amorphous solubility.

Formulas

Noyes-Whitney equation, saturated-medium condition.

How it is measured or obtained

From release rates close to those of amorphous drug alone, or release into saturated medium [li2019 R2; indulkar2019a R13]. In the ASD dissolution papers: by slow dissolution of intact particles and slowly rising UV curves alonzo2011 R4, R1; jackson2015 R13. In the release-mechanism papers: from drug rates near a compact of neat amorphous drug in the same die, polymer rates several times higher, and zero release into presaturated medium bhardwaj2018 R4, R11; saboo2019 R5; indulkar2019a R12.

Values in the library
materialvalue or classconditionspaper ids
miscible LPV–HPMC E5100% DL: about 1.2 µg/mL at 10 min30 µg/mL dose[li2019 R2.f]
ritonavir–copovidone 50% DLno release into drug-saturated mediumoutsideindulkar2019a R13, C42
itraconazole–copovidonea threshold drug-to-polymer ratio above which amorphous drug controls releaseoutsidebhardwaj2018 C66
ritonavir–PVPVA spray-dried, 50% and 75% DLabout 0.0053–0.0063 and 0.0031–0.0040 mg·min⁻¹·cm⁻¹, near neat amorphous ritonavir (about 0.0026), whatever the solventpH 6.5li2020 R10, C37
ritonavir/lopinavir co-granule, 50:50 drug:polymerexpected drug-controlled; polymer leaves first and the surface turns drug-richacidtrasi2019 C46
IDM–PVPVA 1:1dissolution described as drug-controlled; the polymer is expected to dissolve quickly, leaving amorphous drug particlesnon-sink, pH 4.5moseson2020a C30
BCL–PVPVA 50% DLpolymer about 18% at 10 min and 80% at 2 h; drug plateau about 73% from about 120 mindose of at most 30 µg/mL[moseson2022b R6, R7]
felodipine 50:50 HPMC dispersionparticle intact for at least 30 min; ≈8.9 µg/mL at 60 min37 °Calonzo2011 R4, R1
danazol 50:50 HPMC; HPMCAS dispersionspast 8 µg/mL after ≈270 min; ≈6.0 µg/mL plateau25 °Cjackson2015 R2, R13
celecoxib–HPMCAS 50% and 60% drug≈21.1 µg/mL only after 16 h; ≈15.8 of 22 µg/mL at 16 hpH 6.8, 37 °Cxie2016a R4
tacrolimus innovator (cited)50% drug loadingreport, no referencetrasi2016 R19
ritonavir 50:50 films with PVP, PVPVApolymer dissolved; ritonavir ≈18 and ≈9 µg/mL at 240 min, below 27 µg/mL25 °C, pH 6.8purohit2017b R15, R16, R1
ITZ–PVPVA 25, 50%47–64 µg/min/cm² against 51 for amorphous ITZ; polymer 3.5–4 times faster (normalized)0.1 N HClbhardwaj2018 R4, R11
ritonavir–PVPVA 40, 50%≈3% and ≈0.65% of the drug in 180 min; 0 into saturated medium (50%)pH 6.8, 37 °Cindulkar2019a R3, R12
ledipasvir–PVPVA 7.5–20%≤ ≈7% drug and ≈17–23% polymer at 90 minsameque2019 R3, R4, R11
nilvadipine 15, 20%; cilnidipine 20, 25% in PVPVA0.035, 0.013; 0.006, 0.002 mg/min/cm² (neat nilvadipine 0.002)samesaboo2019 R5, R6
felodipine–PVP 15–30%≈0.005–0.020 mg/min/cm², 5–25 times neat felodipinesamesaboo2020a R14, R13
indomethacin–PVPVA 15–25%≈0.01–0.04 against 0.002 mg/min/cm² for amorphous drug; PVPVA ≈0.50–0.72pH 2.1, 37 °Csaboo2020 R3, M5
atazanavir–PVPVA 10%≈0.07 against PVPVA ≈0.24 mg/min/cm²pH 6.8, 37 °Ccorreasoto2022b R3, P5
Pitfalls and disagreements

In the lopinavir films phase separation turns a drug-controlled dissolution at high DL toward polymer-controlled release of the polymer-rich phase, but only partly (33% DL reached about 13 of 30 µg/mL against about 17 for miscible 15% DL) [li2019 R2, C58]. Drug-controlled release was inferred from the loading and the congruent boundary in the ritonavir studies, not from polymer release measured on the same powders li2020 C66, X13. In the ASD dissolution papers the drug-rich surface layer was not observed alonzo2011 C46. The 50:50 PVP danazol dispersion dissolved as fast as the 90:10 one jackson2015 X9, and the 50:50 danazol films were partly crystalline before dissolution jackson2015 X10. The 50% tacrolimus loading is unreferenced and the generics' loadings are unknown; release rates were not measured trasi2016 X4. The drug-rich layer of ITZ compacts is a "supposition" from the curving polymer profiles bhardwaj2018 C52. Nilvadipine above the switch released 17 and 6.5 times faster than the neat amorphous drug, a significant difference saboo2019 X9, R8. The presaturation of the medium is not described indulkar2019a X8.

← Concepts and formulas

concept · as used in Dissolution

drug–drug miscibility

Mixing of two drugs in one amorphous phase; it makes a mixed drug-rich phase when both dissolve [alhalaweh2016 C9, C26]. A crystalline drug can also enter an amorphous drug-rich phase from solution: darunavir partitioned into the atazanavir-rich phase in water although the dry amorphous drugs were phase separated [alkalla2026 C4, C5, C30, C31].

Findings

F6, F20.

Related concepts

lowers amorphous solubility through the drug-rich phase; related to Fox equation.

Formulas

ideal-mixing reduction of amorphous solubility.

How it is measured or obtained

Melting-point depression of the crystalline drug by the amorphous second drug and one Tg of the melt-quenched mixture [alhalaweh2016 P7, P8].

Values in the library
materialvalue or classconditionspaper ids
ritonavir with atazanavirmelting onset 394.4 K to about 380.1 K at x_ATV 0.52; one Tg 349–323 KDSC[alhalaweh2016 R8, R9]
ritonavir with lopinavirliquid-state miscibility; one Tg in every mixturetrasi2015a C41; trasi2015b R2, C39
atazanavir with darunavir, dry amorphous mixturestwo Tgs in every mixture (neat 105 and 62 °C); heterogeneous co-melt-quenched film with nanoTA softening at 118 ± 4 and 92 ± 2 °CDSC, nanoTA[alkalla2026 R15, R16, R17, C30, C31]
atazanavir with darunavir in waterdarunavir enters the atazanavir-rich phase; atazanavir's amorphous solubility falls as the darunavir fraction of the phase risesantisolvent, 150 µg/mL atazanavir, pH 6.8[alkalla2026 R11, C4, C39]
Pitfalls and disagreements

Only miscible, structurally similar drugs were tested; immiscible pairs are outside the evidence [alhalaweh2016 C40]. Miscibility in water and immiscibility in the dry state differ, the mixing in water is inferred from supernatant depletion, and the plotted mole fraction has no printed calculation (F20) [alkalla2026 X5, X6].

← Concepts and formulas

concept · as used in Dissolution

drug leaching

Evidence table: drug leaching. Content from the ASD dissolution chapter (celecoxib, 2015) and the ASD process chapter.

Passage of drug, and of polymer, out of suspended ASD particles into the surrounding liquid while the particles stay largely undissolved, as in acid for dispersions of enteric polymers. Because the drug is amorphous, leaching can create a supersaturated liquid, whose concentration falls if the drug then crystallizes chen2015a C13. For lopinavir dispersions of three HPMCAS grades and HPMCP at pH 3 the leached drug settled between the crystalline and the amorphous solubility, the dispersions leached less polymer than the pure polymers ("consistent with a miscible solid dispersion"), surfactants raised the leached drug in step with its crystalline solubility, and SDS at pH 5 raised drug and polymer leaching together li2016b R4, R3, C35, C39, C24.

Findings

F15, F18, F19, F24, F25, F27.

Related concepts

depends on pH-dependent polymer solubility and polymer-controlled release; raised by polymer-surfactant complexation; related to solubility suppression by an undissolved, mixed polymer.

Formulas

supersaturation ratio.

How it is measured or obtained

Filtering the suspension liquid (0.45 µm) and assaying drug by HPLC, divided by the crystalline solubility in the same medium, and polymer by colorimetry chen2015a P11, P12, E1; drug in acid over time in two-stage tests [moseson2023 R11]. Spray-dried dispersions, 100 mg in 10 mL citrate buffer at 25 °C and 300 rpm, 0.45-µm filtrates to 3 h, lopinavir by HPLC and polymer by phenol–sulfuric acid colorimetry li2016b P4, P7, P8.

Values in the library
materialvalue or classconditionspaper ids
celecoxib–HPMCAS 33.3%, pH 3, no surfactantS ≈4.3 → ≈6.7 over 48 h, no crystals10 mg/mL, 25 °Cchen2015a R17, R14
same, 0.25% SDSS ≈8.6 at about 5 min, ≈3.2 at 1 h (crystals)25 °Cchen2015a R17
same, 0.025% Triton X100S ≈1.6–1.8 for 48 h25 °Cchen2015a R17
posaconazole–HPMCAS dispersions, gastric stage (ASD process)a low amount of amorphous drug leaches; a coating slows itpH 1.2 and 4.0 media[moseson2023 C17, C20]
lopinavir 33% with HPMCAS LF / MF / HF; HPMCP≈7 µg/mL each; ≈5 µg/mLpH 3, 25 °C, 3 hli2016b R4
same, polymerbelow 5 µg/mL from the dispersionspH 3li2016b R3
lopinavir–HF with STC; SDS at pH 5; PVPVA + SDS≈25.6; ≈33–39; ≈50 µg/mL25 °Cli2016b R19, R13, R17
posaconazole–HPMCAS 10 / 25 / 50% drug7.5 / 10 / 11.5% of a 400 µg/mL dose in 60 min, below the 115.1 µg/mL crystalline solubilityFaSSGF pH 1.6, 37 °Celkhabaz2019a R10, R1
delamanid salt dispersions, acid stage≈30% (HPMCP-50), under 10% (HPMCP-55) and ≈21–36.5% (HPMCAS grades) at pH 1.6; about 0.5–3.5% at pH 3.025% drug, 37 °Cnguyen2023c R11
uncoated against coated delamanid–HPMCP-50 tablets≈30–41 µg/mL against below 0.5 µg/mL in the gastric stagepH 1.6, 37 °Cnguyen2023b R2, R10
Pitfalls and disagreements

The supersaturation in SDS assumes that about 860 µg/mL leached HPMCAS leaves the celecoxib solubility unchanged, which was not tested chen2015a X10, C11. The surfactant-free suspension leached to the highest supersaturation without crystallizing chen2015a X6. Polymer values from the dispersions lie below detection or near quantitation and differ between figures li2016b X7, X6; the amorphous solubility was measured only in plain pH 3 buffer, so leaching with additives cannot be set against it li2016b X15. Leaching from an undissolved enteric matrix is attributed to the drug being molecularly dispersed in the polymer, and rose with drug loading for posaconazole nguyen2023b C35; elkhabaz2019a C29.

← Concepts and formulas

concept · as used in Dissolution

drug loading

The weight fraction of drug in an ASD (10, 30, 50% in the earlier papers). Higher loading gave slower and lower release in the atazanavir and telaprevir dispersions [hate2018 R11; mosqueragiraldo2018b R5, R16]. Enzalutamide dispersions differ: 10% in HPMCAS crystallized while the 50% one reached the ceiling slowly, and 50:50 CPHPC-106 gave an exposure like a lipid formulation at a tenfold higher loading (F8, F24) [wilson2018 R6; wilson2020 C19, C22]. New aspect (Release mechanism and LoC): in the release-mechanism chapter drug loading is the main variable, and its limit for congruent release is a concept of its own (limit of congruency). For grazoprevir–HPMCAS solvent-evaporated dispersions release declined steeply with loading, complete at 5%, about 80% at 10 and 15%, and about 30% at 50, 60 and 75%, an apparent plateau hiew2023 C18, R8. At nearly the same bulk loading, the release of co-precipitated particles depended on how much drug sat at the particle surface (hierarchical particle approach) hiew2023 R14, R17. In 2025 75% grazoprevir–HPMCAS particles with a wetting secondary excipient released like 20–30% dispersions, and the calculated loadings of the treated particles were 71.6–73.9% hiew2025 R9, R10, R8.

Findings

Bioperformance: F8, F9, F23, F24, F27. Release mechanism and LoC: F11, F28, F35.

Related concepts

affects matrix crystallization and reaching the amorphous solubility; part of amorphous solid dispersion. Limited by the limit of congruency; raised at the particle level by the hierarchical particle approach; interacts with surface drug enrichment.

Formulas

none.

How it is measured or obtained

Set by preparation (rotary evaporation at 10, 30, 50 wt%); effect read from dissolution, flux and AUC [hate2018 P5; mosqueragiraldo2018b P1].

Values in the library
materialvalue or classconditionspaper ids
atazanavir HPMCAS 10 / 30 / 50%apparent 248 / 99 / 84 µg/mL at 120 min; AUC 1220 / – / 660closed; absorptive[hate2018 R11, R15]
telaprevir HPMCAS 10 / 30 / 50%above 90 µg/mL at about 2 / 21 / 600 minpH 6.8[mosqueragiraldo2018b R5, R16]
grazoprevir ASDsrelease complete at 5%, about 80% at 10–15%, about 30% at 50–75%hiew2023 C18
tacrolimus commercial ASD50% loading; higher loading may not generate nanospeciescitedtrasi2016 R19, C41
enzalutamide in HPMCAS-MF 10 / 50%10%: peak about 10 µg/mL with crystals; 50%: ceiling reached in 3–4 h100 µg/mL total, pH 6.5[wilson2018 R6]
enzalutamide in CPHPC-106 10:90 / 50:50AUC0–inf 516 / 305 µg·h/mL; mass flow about 0.53 / 0.49 µg/minrats, 50 mg/kg[wilson2020 R6, R8, C22]
grazoprevir–HPMCAS-LF solvent-evaporated, 5–75%≈102 → 63 → 43 → 27–30% released at 90 mintwo-stage SGF → FaSSIFhiew2023 R8
binary cPADs at 60; 75%; hierarchical cPAD at ≈73%≈37.5; 17%; ≈71%samehiew2023 R17
grazoprevir–HPMCAS hierarchical particles73.9% (5 mg/mL HPMC), 71.6% (10 mg/mL, 120 min)calculatedhiew2025 R8
Pitfalls and disagreements

High loading is "normally preferred" for dose size and cost [mosqueragiraldo2018b C59]. The limit differs by drug and polymer (F8). Most polymers work well only at low loading, so dispersions are mostly polymer, which raises dose-form size [wilson2020 C19]; a polymer that works at 50% loading is the aim of the enzalutamide study (F24) [wilson2020 C22].

← Concepts and formulas

concept · as used in Dissolution

drug-polymer hydrogen bonding

Evidence table: drug-polymer hydrogen bonding. Content from the release-mechanism chapter (2020–2022), with rows from the Physical stability chapter.

A hydrogen bond between a donor group of the drug (NH, OH or COOH) and an acceptor of the polymer, in PVP and PVPVA the carbonyl of the vinylpyrrolidone unit, read from a shift of the polymer carbonyl band to lower wavenumber saboo2020 R14, C20; que2021 R7. In the release papers it is tested as a cause of a low limit of congruency: indomethacin, which hydrogen-bonds to PVPVA, had a much lower limit than its methyl ester, which does not, so the hypothesis that hydrogen bonding in the dry dispersion raises the limit "appears incorrect" saboo2020 C48; from the same pair Yang and co-workers (2021) conclude that strong interactions such as hydrogen bonding "are likely to" lower the polymer release rate and hence drug release yang2021 C29. In the Physical stability chapter, sorbed water disrupts drug–polymer hydrogen bonds of NH-donor drugs with PVP, producing a drug-rich phase [purohit2015b C27], and a larger carbonyl shift with COOH donors than with NH donors is read as a stronger drug–polymer interaction [rumondor2009c C48].

Findings

Release mechanism and LoC: F10, F17.

Related concepts

a case of hydrogen bonding and of drug-polymer interactions; the weaker alternative in donor-free analogues is halogen bonding; lowers the limit of congruency in the analogue pairs; may shift the ternary phase diagram.

Formulas

none.

How it is measured or obtained

Infrared spectra of the carbonyl region of dispersions against loading and, for tablets, against dissolution time saboo2020 R14, R16; que2021 R7; analogues without donor groups as controls saboo2020 R18; que2021 R7.

Values in the library
materialvalue or classconditionspaper ids
indomethacin–PVPVA 10–70%1705 cm⁻¹ dimer band absent; hydrogen-bonded PVP carbonyl band at 1634 cm⁻¹ growing with loadingdry tabletssaboo2020 R14
indomethacin methyl ester–PVPVA 25%PVP carbonyl region unchangeddry tabletssaboo2020 R18, C23
TIPP; PHPH in PVPVAVP carbonyl shifted by up to 30 cm⁻¹; new band at about 1650–1654 cm⁻¹films 10–90%que2021 R7
Me-TIPP; Me-PHPH in PVPVAmaximum shift 7 cm⁻¹ (halogen bond); minimal shiftsameque2021 R7
nifedipine, pimozide, droperidol; indomethacin, ketoprofen with PVP (Physical stability chapter)PVP carbonyl red shift 20–24; 42–44 cm⁻¹dry dispersions[rumondor2009c R29]
ritonavir–PVP 80:20 (Physical stability chapter)hydrogen-bond band at 1654 cm⁻¹ lost after 97% RHfilms, dried[purohit2015b C17]
Pitfalls and disagreements

In the analogue pairs hydrogen bonding goes with a higher Tg and with drug–drug bonding, so the two effects are hard to separate: all high-Tg drugs of the drug-property study can hydrogen-bond with both polymers while the low-Tg drugs lack donors yang2021 C25, and drugs that hydrogen-bond strongly to PVPVA also had high Tgs correasoto2022a C49. The release papers read the bonds in dry dispersions or after drying; whether they persist in the hydrated matrix was not measured que2021 C44.

← Concepts and formulas

concept · as used in Dissolution

drug-polymer ionic interactions

Evidence table: drug-polymer ionic interactions. Content from the release-mechanism chapter (2024–2025), with rows from the Physical stability and ASD process chapters.

Electrostatic attraction between an ionized drug and oppositely charged groups of the dispersion polymer, here a weakly basic drug cation and the carboxylate of an enteric polymer. In the release papers of 2024–2025 such interactions, when both partners are ionized at the pH of the polymer gel, form an insoluble complex that lowers polymer solubility and so polymer and drug release; ionization of loratadine "is necessary" for its complexation with HPMCAS, which it binds "mainly electrostatically" bapat2024 C38, C46; bapat2025a C34. The interaction can exist before water arrives: bedaquiline was about half protonated in a dry HPMCAS dispersion made from organic solvents kaur2025 C25, C35. In the stability papers the same proton transfer from an acidic polymer to a basic drug is read as a source of physical stability (lumefantrine, erlotinib) [bhujbal2021 C21, C52; moseson2022a C33].

Findings

Release mechanism and LoC: F32, F33, F34, F24.

Related concepts

gives an insoluble drug-polymer complex by hydrophobic ion pairing; depends on ionization at the microenvironmental pH; contrasts with drug-polymer hydrogen bonding; lowers polymer hydration.

Formulas

Henderson-Hasselbalch equation (ionization of drug and polymer at the gel pH).

How it is measured or obtained

XPS of the drug nitrogen, with a protonated N 1s component near 402 eV beside the neutral one near 399 eV, calibrated against a salt [kaur2025 R19, R20; bhujbal2021 C21]; indirectly by the polymer lost from solution when drug and polymer meet in buffer at a set pH (insoluble drug-polymer complex) bapat2025a R9, R11.

Values in the library
materialvalue or classconditionspaper ids
bedaquiline free base; HPMCAS-MF complex; dry 40% dispersion4 ± 4; 55 ± 4; 52 ± 7% protonated NXPSkaur2025 R20
bedaquiline 40% dispersion after 1 h at pH 6.515 ± 3% protonated at the surfaceXPSkaur2025 R20
cinnarizine–HPMCAS-MF 25%20% protonated dry, 11% after partial dissolutionXPSbapat2024 R8
loratadine with HPMCAS LF, MF, HF at 1:1, pH 5.8–7.5complexation falling with calculated drug ionization (≈20 → 0.5%)spike testbapat2025a R11, R13
lumefantrine with HPMCP, HPMCAS, CAP, Eudragit L100 (Physical stability chapter)14–42% protonated against 3% for amorphous lumefantrineXPS, dry dispersions[bhujbal2021 R8]
erlotinib with HPMCAS (ASD process chapter)acid–base interactions the "likely" reason for better stability (cited)—[moseson2022a C33, R21]
Pitfalls and disagreements

The same interaction is sought for stability and harms release: the 2025 grade paper says the stability gain of drug–polymer salt formation should "ideally" be balanced against reduced release under mutual ionization bapat2025a C23. For lumefantrine the extent of protonation did not rank stability [bhujbal2021 C50]. The release papers infer the interaction in the dissolving gel from solution tests and cited gel pH, not from measurements in the gel bapat2024 X10; kaur2025 X14.

← Concepts and formulas

concept · as used in Dissolution

drug-polymer miscibility

A single amorphous phase formed by liquid–liquid mixing of amorphous drug and amorphous polymer, a description the authors themselves call "clearly" an oversimplification below Tg, where the system is not at equilibrium [marsac2006b C3]. A molecularly mixed system has one amorphous phase; more than one phase means regions of different drug:polymer ratio [rumondor2009a C4]. Three behaviours follow from the free energy of mixing: complete miscibility (one minimum), complete immiscibility (positive ΔGmix) and partial miscibility (two minima), with strict immiscibility rare, because some of each component always dissolves in the other [rumondor2009a C35, C36, C37]. Miscibility is not solubility: crystals in a dispersion after manufacture or storage do not necessarily mean the two liquids are immiscible, since the solubility limit of the crystal in the polymer may have been exceeded [marsac2006b C43]. Maximum stabilization of an amorphous drug "can only be realized" when drug and polymer are intimately mixed [rumondor2009a C3]. The concept also applies to pairs of polymers, whose miscibility falls with the molecular weights of both: from one phase at every composition for a 783 Da maltodextrin with all PVP grades to two phases at all nine compositions for a 450 kDa dextran with PVP K 90 [vaneerdenbrugh2012a C6, C23, C24, C38]. Solvent-cast films of itraconazole–HPMC (10–50% drug) and of telaprevir with HPMC, PVPVA or HPMCAS were not miscible at the loadings tested, with the onset of separation at 10% drug for HPMC and PVPVA and at about 30–40% for HPMCAS [purohit2015a C36; li2016c C17, C52]. New aspect (ASD process): mixing of drug and polymer at the molecular level in one amorphous phase, judged by a single Tg, featureless AFM and TEM images and spectroscopy, is considered essential for solid-state stability and for supersaturation on dissolution [li2017 C2, C30; broman2001 C14]. In the hot-melt extrusion context it is also the condition for melting point depression: miscible pairs show it, immiscible pairs do not [moseson2018 C8, C15].

Findings

Miscibility and drug-polymer interactions: F3, F4, F5, F6, F7, F17, F18, F19, F22. ASD process: F1, F5, F8, F17.

Related concepts

measured by single-Tg miscibility criterion, melting point depression and Flory-Huggins interaction parameter; depends on enthalpy of mixing, entropy of mixing and drug-polymer interactions; described by free energy of mixing; contrasts with drug solubility in polymer; required for an amorphous solid dispersion; contrasts with amorphous-amorphous phase separation. In films, miscibility is lost in amorphous-amorphous phase separation.

Formulas

Gibbs free energy of mixing, Flory-Huggins free energy of mixing, Flory-Huggins melting point depression, Flory-Huggins combinatorial entropy of mixing.

How it is measured or obtained

By counting glass transitions by DSC, with its limits [rumondor2009a C5, C6]; by IR with PCA against calculated physical mixtures [rumondor2009a C9]; by PXRD with PDF fitting and pure curve resolution [rumondor2009a C10, C11]; by the melting point depression of the crystalline drug in the polymer [marsac2009 C12]; by Flory–Huggins free energy curves from χ [marsac2006b C17]. A pair is classed miscible, partially miscible or immiscible from Tg, FTIR and microscopy in the earlier literature [marsac2009 R1]. Further methods: pyrene and prodan fluorescence, fluorescence imaging, AFM-nanoIR, nanoTA and Lorentz contact resonance on films [purohit2015a P3, P4, P9, P10; li2016c P4, P7, P8]; DSC together with the hydrogen-bonded fraction of PVP carbonyls for polymer blends [vaneerdenbrugh2012a P3, P5]. In the later process papers: a single Tg between those of the components (probucol–PVP 95 or 129 °C between 26 and 163 °C) [broman2001 R4.a, R4.b, C14, M1, M2]; featureless films at the 40 nm AFM resolution [li2017 C8]; melting point depression across the range [moseson2018 R5]; itraconazole's own UV and fluorescence [mugheirbi2017 C30].

Values in the library
materialvalue or classconditionspaper ids
nifedipine, felodipine, ketoconazole, sucrose, indomethacin with PVPmiscible (cited Tg, FTIR)classification used for χ[marsac2009 R1.a, R1.b, R1.c, R1.d, R1.e]
sucrose–dextranmiscible; ibuprofen–dextran, indomethacin–dextran immisciblecited and this study (Tg data not shown)[marsac2009 R1.f, R1.g, R1.h, X10]
itraconazole–Eudragit E100partially misciblecited[marsac2009 R1.i]
felodipine–PVP, nifedipine–PVPone amorphous phase over the compositions studiedIR, PXRD, DSC (cited)[rumondor2009a C38, X5]
felodipine–PAA"practically immiscible" at 30–70% PAA; some mixing at 10 and 90%DSC, IR, PXRD[rumondor2009a C44, C46]
ketoconazole–PVP"suspected" partially miscible, one phase at higher PVP onlyone Tg; IR; PXRD[rumondor2009a C40, X1]
nifedipine–PVP K29/32predicted miscible at all compositions from χ −3.8Flory–Huggins[marsac2006b R2, C33]
itraconazole–HPMC 10:90 to 50:50phase separated at every loading in solvent-cast films; one broad Tg of powdersfluorescence, AFM-nanoIR, nanoTA; mDSC[purohit2015a C36, R7]
telaprevir with HPMC, PVPVA, HPMCASdomains from 10% drug (HPMC, PVPVA); from about 30–40% (HPMCAS)AFM, AFM-IR, nanoTA, LCR[li2016c C17, C52]
dextran–PVP, 20 pairsmiscible at all compositions for 783 Da maltodextrin; phase separated at all nine for DEX450–PVP90DSC, FTIR[vaneerdenbrugh2012a R13, R14]
probucol–PVP K30 50:50single Tg, "seemed" one-phase; carbonyl shiftsolvent, moulded[broman2001 R4, R5, C14]
ECP–HPMC / PVPVAmiscible over 10–90% DL when dry18% RH[li2017 R3.a, C33]
ITZ–HPMCthermodynamically miscible when dry, trapped as two phases when wet ("suggest")7% RH vs 20–40% RH[mugheirbi2017 R1, C39]
IDM–PVPVAmelting point depression confirms miscibility at elevated temperatureDSC[moseson2018 C15]

Evidence table: drug-polymer miscibility.

Pitfalls and disagreements

A single Tg is a weak criterion: domains below 15–30 nm may give one Tg, heating can change miscibility during the scan, and ketoconazole–PVP gave one Tg at every ratio while PXRD suggested partial miscibility [rumondor2009a C6, R3, C40]. The ketoconazole–PVP conclusion conflicts with Table II of the same paper [rumondor2009a X1]. The felodipine–PAA phase state differs with the heating regimen, which the authors read as temperature-dependent mixing [rumondor2009a R1, C15]. The three methods used samples with different thermal histories [rumondor2009a X4]. Molecular-level mixing is assumed in the dilute dispersions of the growth studies but not measured there [kestur2010a C5]. Solvent-cast films and DSC powders of the same pair gave different verdicts, so the verdict depends on sample and method [purohit2015a X1]; heating to 165 °C mixed itraconazole–HPMC films [purohit2015a C38]. The telaprevir onset loadings rest on topography and moisture changed the HPMCAS films from day to day [li2016c X3, C18]. A pair classed miscible by DSC showed domains in films (DEX6–PVP90) [vaneerdenbrugh2012c R16]. A miscibility verdict on a solvent-made batch is a verdict on pair and process together [mugheirbi2017 C54]; a dry film may be trapped rather than miscible [li2017 C43]; low-resolution methods may overestimate miscibility [mugheirbi2018 C4].

← Concepts and formulas

concept · as used in Dissolution

drug-rich barrier layer

Evidence table: drug-rich barrier layer. Content from the release-mechanism chapter (2019–2025).

A drug-rich layer at the dissolution front that blocks release of the drug and of the polymer beneath it. Que and co-workers (2019) take the idea from studies of polyphase mixtures, in which phase segregation at the dissolution front forms a barrier layer (cited), and state for ledipasvir–PVPVA above the limit of congruency that "it appears" the drug-rich layer acts as a physical barrier that stops further release of drug and even of water-soluble PVPVA, leading to swelling que2019 C5, C32. Saboo and co-workers (2020) describe surface drug enrichment of hydrophilic-polymer dispersions as "a physical barrier to polymer release from subsurface layers" saboo2020a C42. Hiew and Taylor (2022) use it for the release plateau after about 30 min ("could be attributed") and argue that drug and polymer leave together as long as separated drug cannot form a continuous barrier hiew2022b C16, C46; for clopidogrel, separation leaving a continuous or semi-continuous drug-rich barrier "is linked to" poor release correasoto2022a C53. In dissolving ritonavir–PVPVA compacts the drug-rich coating impedes polymer dissolution as a barrier to water penetration and "may" also be a physical barrier to polymer release when water penetrates yang2022a C55. The water-poor hydrophobic phase is expected to become more viscous and, once connected and anchored to the gel layer, to persist at the interface as an insoluble barrier, porous in top view deac2023a C56, C57. Above the limit the compact surface evolves toward the hydrophobic binodal composition measured under dilute conditions and is in pseudo-equilibrium with the aqueous phase deac2023b C59, C3. The 2023 surfactant study found every ritonavir–PVPVA–surfactant dispersion with a persistent continuous drug-rich layer releasing minimal drug: Span 20 at 40% carried a layer of about 50–100 µm from 5 min, through whose pores polymer but not drug left, and Span 85 at 40% a thick layer that released neither yang2023 R7, R9, C15, C19, C40. A layer that formed in situ on 30% Span 85 compacts was removed by agitation and did not block release yang2023 R8.

Findings

Release mechanism and LoC: F7, F20, F22, F25, F26, F27, F31.

Related concepts

part of the drug-rich surface layer; formed by surface drug enrichment; found above the limit of congruency; its formation depends on phase separation morphology.

Formulas

none.

How it is measured or obtained

Not measured as a barrier: inferred from surface composition by XPS, from micro-CT of dried tablets and from suppressed polymer release que2019 R15, R13, R11, X22.

Values in the library
materialvalue or classconditionspaper ids
ledipasvir–PVPVA 20%≈2% of the polymer released in 10 min while surface drug rose to ≈54 wt%pH 6.8, 37 °Cque2019 R11, R15, C36
felodipine–PVPVA 15 → 20–30%polymer rate ≈1.9 → ≈0.14–0.19 mg/min/cm²samesaboo2020a R14
felodipine–PVP and –HPMC across the limitPVP about halved; HPMC not reducedsamesaboo2020a X15
lumefantrine benzoate 20%, tosylate 10%plateau after ≈30 min at ≈58–60% releasedcompacts, 37 °Chiew2022b R10, C16
clopidogrel–PVPVA 50, 60%bicontinuous and drug-continuous films; ≈52 and 7% releasedfilms 5 min at 100% RH; compactscorreasoto2022a R20, R17
ritonavir–PVPVA 30%; 40%continuous porous drug-rich layer at the gel–solution interface; rigid layer ≈12 µmreal-time confocal, pH 6.8yang2022a R6, R12, R13
MePHPH–PVPVA 50%; PHPH–PVPVA 20%porous continuous drug-rich phase on the surfacesurfaces after 2–20 mindeac2023a R9, R10, C57
PHPH–PVPVA 15, 50%; MePHPH–PVPVA 50% compactssurface drug content moves toward the hydrophobic binodal compositionATR-FTIR of dried surfaces, 0–60 mindeac2023b R6, R7, C59
ritonavir–PVPVA + Span 20, 40%layer ≈50–100 µm from 5 min; drug ≈8%, polymer ≈78% at 90 minconfocal cross-sections; compactsyang2023 R7, R2, R3
ritonavir–PVPVA + Span 85, 30%layer formed, swept away and re-formed in situ; ≈86% released under rotationin situ confocal; compactsyang2023 R8, R2
Pitfalls and disagreements

The barrier function itself, its composition over time and its permeability were not measured que2019 X22. Suppression of polymer release above the limit is polymer-specific saboo2020a X15. Whether plasticizers act on barrier formation was not tested; the authors call for a more in-depth evaluation correasoto2023 C32. Persistence depends on the shear: the same Span 85 dispersion formed a layer in a quiet chamber and none under rotation yang2023 C16, R8.

← Concepts and formulas

concept · as used in Dissolution

drug-rich nanodroplets

The dispersed drug-rich phase formed by LLPS, usually of 100–300 nm, which dissolves fast and is expected to replenish absorbed drug [indulkar2016 C4, C25]. Droplets are too large to cross the 3–4 nm (regenerated cellulose, 12–14 kDa) or 15 nm (hollow fibre) pores of the membranes used [indulkar2016 C11; hate2018 C52]. In enzalutamide dispersions the same species is called amorphous aggregates, about 100 nm; in simulated and pooled human intestinal fluids spheres of 0.1–0.5 µm were found [wilson2018 R11, C45; elkhabaz2019b R4, C19, C24]. New aspect (Supersaturation from ASD dissolution): fast-releasing dispersions put drug above the amorphous solubility into a submicron colloid within minutes, and additives decide its size and how soon it crystallizes ilevbare2013d C59, C60; jackson2015 C29. New aspect (Release mechanism and LoC): from dissolving dispersions, nanodroplets formed only where release was congruent or close to congruent, so that the drug concentration exceeded the amorphous solubility purohit2017b C52; indulkar2019a C5; saboo2019 C30. The 2017 isotope study concludes that they form from drug that has first dissolved, followed by LLPS ("strongly suggest"), not by release of drug-rich domains from the hydrated matrix indulkar2017b C26; Purohit and Taylor reach the same reading for ritonavir films ("likely") purohit2017b C57. When drug release is controlled by polymer dissolution, colloid formation is "highly dependent" on drug loading que2019 C55. Their size and life after release depend on the drug, the polymer and small amounts of surfactant: HPMCAS kept elbasvir and loratadine droplets small, and SDS, TPGS or Tween 80 at 4–50 µg/mL kept clopidogrel droplets stable for 4 h while CTAB agglomerated them yang2021 C4; correasoto2022a C12, C38. Built into ritonavir–PVPVA at 30%, the Spans kept the released droplets near 1 µm, while TPGS and Tween 80 let them grow to several micrometres, which the authors suggest "could possibly" come from these surfactants partitioning into the droplets and lowering their Tg indulkar2022 C47, C48. In dissolving ritonavir–PVPVA compacts at 10 and 20% droplets formed near the gel–solution interface and entered the solution with the dissolving polymer, which the authors explain by a water content needed to cross the binodal yang2022a C34, C35, R10, R11.

Findings

Bioperformance: F5, F8, F15, F19, F22, F23. Supersaturation from ASD dissolution: F8, F9, F12, F13. Release mechanism and LoC: F4, F5, F12, F13, F16, F25, F27.

Related concepts

produced by liquid-liquid phase separation; act as nanodroplet reservoir effect; part of the drug-rich phase; related to droplet coalescence and particle absorption of light; form under congruent release above the amorphous solubility. Coarsen by drug-rich phase coarsening.

Formulas

Stokes-Einstein equation.

How it is measured or obtained

NTA (scattering or fluorescence mode with Nile red), DLS, the 369 nm band of atazanavir [indulkar2016 P4; hate2018 P3, P4, P6]. Nile Red fluorescence of the pellet against aggregate mass, and DLS [wilson2018 R8, R11]; SEM of a centrifuged pellet with the drug's own fluorescence in human fluid elkhabaz2019b R3, R4; Z-average by DLS under agitation [ueda2020a R5, R6]; size and zeta potential with polymer or surfactant additives [hate2022 R17]. In the ASD dissolution papers: light scattering in a flow-through cell, nanoparticle tracking of samples or 0.45 µm filtrates, SEM of dried samples ilevbare2013d P3, P8; jackson2015 P5; trasi2015b P8. In the release-mechanism papers: NTA, DLS, visible turbidity, environment-sensitive probes in solution and free drug after ultracentrifugation indulkar2017b R6, R7; purohit2017b R7, R8; indulkar2019a R9; que2019 R5, R12; saboo2019 R11, R12.

Values in the library
materialvalue or classconditionspaper ids
clotrimazole111 / 223 / 246 / 257 nm at 8 / 10 / 15 / 20 µg/mL; 1.2 × 10⁸ to 12.5 × 10⁸ per mLpH 8, NTA[indulkar2016 R4]
atazanavir, solvent shift204–226 nm, PDI 0.08–0.15100–500 µg/mL, DLS[hate2018 R6]
atazanavir 90:10 HPMCAS and HPMC ASDs294–326 nmclosed and absorptive[hate2018 R12]
atazanavir with PVPVAabout 245 nm rising to about 700 nm at 75 min and 10 µm at 105 minagglomeration[hate2018 R20]
telaprevir 90% HPMCAS ASDabout 300 nmDLS (data not shown)[mosqueragiraldo2018b R3]
ritonavir ASD (Tres 2018)696 / 294 nm (ritonavir / lopinavir)NTA[tres2018 R18]
enzalutamide 10:90 and 50:50 copovidone ASDsabout 100 nm; about 50 against about 3 µg/mL of 100 as aggregatespH 6.5, 1 h dissolution[wilson2018 R10, R11]
atazanavir, posaconazole in pooled human fluidspheres of 0.1–0.5 µm, no needlesSEM of pellet, 100 µg/mL HPMC-ASelkhabaz2019b R4
atazanavir, clozapine with HPMCAS-LF and -HFAS-LF droplets below 300 nm over 3 h; AS-HF kept the initial size; clozapine about 100 nm (AS-HF) against 250 (AS-LF)300 rpm, 37 °C[ueda2020a R6]
atazanavir 150 µg/mL with polymer or surfactant additivesdroplets of about 280 and about 1000 nm gave the same mass flowPAMPA, 2% SDS receiver[hate2022 R17]
ritonavir–PVP dispersion at 20 µg/mLabout 350 nm at onset; ≈5590 nm by 120 min100 mM buffer, 37 °Cilevbare2013d R1, R5
ritonavir 20 µg/mL with 5 µg/mL CAAdP 0.33210−214 nm before crystallizationsolvent shiftilevbare2013d R12
danazol 90:10 dispersions246–284 nm25 °Cjackson2015 R6
ritonavir; ritonavir + lopinavir, HPMCAS dispersionsabout 500 nm; about 160 nm in 0.45 µm filtrates1 htrasi2015b R7
felodipine 90:10 HPMC dispersion≈185 → ≈300 nm, read as crystalline25 °Calonzo2011 R8, C33
nifedipine 10, 20% with HPMC-E5 or PVPVA≈190–222 nmNTA, 5 °C, D2Oindulkar2017b R7
ritonavir 10:90 films with PVPVA, HPMCAS, PVP200, 250, 315 nmNTA, fresh filmspurohit2017b R8
ritonavir–PVPVA 10% tablet218 ± 15 nm; media of 10–25% turbidDLS at 30 minindulkar2019a R9
ledipasvir–PVPVA 2, 5%cloudy medium; ≈225–257 nm at 5%DLSque2019 R5, R12
nilvadipine 5, 10%; cilnidipine 5, 10, 15%237 ± 8, 246 ± 3; 255 ± 1, 300 ± 2, 366 ± 7 nm; none at higher loadingsDLS, about 1 hsaboo2019 R11
indomethacin–PVPVA 5, 10%250–350 nmNTA, 30 minsaboo2020 R7
felodipine with 5% TPGSZ-average ≈237–279 nmDLS, 60 minsaboo2021 R17
elbasvir 2.5%; loratadine 10%PVPVA ≈670 → 1190; ≈820 → 2120 nm; HPMCAS ≈280 → 390; ≈420 → 570 nmDLS, 60 minyang2021 R3, R6
clopidogrel≈520 nm in buffer; stable with SDS, TPGS or Tween 80; ≈12-fold growth with CTABDLS, 4 hcorreasoto2022a R5, R6
four phenolphthalein analogues179–364 nmDLS, 30 minque2021 R22
ritonavir–PVPVA 30:70:5 with Span 85; Span 20; none; SDS; TPGS; Tween 80≈330–960; ≈550–1410; ≈940–2200; ≈2400; ≈3840 nm; ≈10 µmDLS of the medium during releaseindulkar2022 R11, R13
plasticized dispersions (systems not specified)500–1500 nm after 90 minDLScorreasoto2023 R5
MePHPH–PVPVA 5–30%; PHPH–PVPVA 5%nanoparticles formed within the gel; onset 601 ± 68 µm beyond the 356 ± 18 µm gelin situ confocaldeac2023a C27, R8, C31
drug-rich phase released from 30% MePHPH; from 5% PHPH98.8 against 26.2 wt% drug; Tg 16.8 against −5.8 °CHPLC, DSCdeac2023a R12
PHPH; MePHPH nanoparticles with PVPVAPVPVA 71.4–78.0; 0.5–7.5 wt%37 °C, two preparation routesdeac2023b R2
Pitfalls and disagreements

The size is quoted as 110, 200, 220 or 250 nm in one paper [indulkar2016 X9]. Size depends on polymer and agglomeration [hate2018 C26, C27]. Counts stop at 150 µg/mL in the atazanavir study [hate2018 X10]. The enzalutamide aggregate amounts come from a Nile Red calibration, and the aggregate-rich ASD also dissolved fastest and left less solid in the dosed suspension (F23) [wilson2018 R8, X13, X14]. Size fell with polymer concentration and was smaller with AS-HF (F19) [ueda2020a C18]; in a PAMPA cell the polymer or surfactant type, not the size, shaped the transport gain (F22) [hate2022 R17]. Droplets pass 0.45 µm filters trasi2015b C22. Sizes depend on method (SEM of dried samples against DLS) and medium ilevbare2013d X12, R9. Whether the felodipine particles were droplets or crystals was not measured directly alonzo2011 X7. Nanodroplets of ritonavir tablets at 20–30% are inferred from turbidity and concentration, not sized indulkar2019a X5. The link between congruency and droplets partly follows from the amount of drug released by the sampling time saboo2019 X14. The larger cilnidipine droplets at higher loading "could indicate" lower stability or a different formation route saboo2019 C19. The slow-exchange premise of the isotope test was shown with solvent-made droplets only indulkar2017b X5.

← Concepts and formulas

concept · as used in Dissolution

drug-rich phase coarsening

Evidence table: drug-rich phase coarsening. Content from the release-mechanism chapter (2021–2023), with rows from the Bioperformance chapter.

The growth of a separated drug-rich phase into fewer, larger domains or droplets after it has formed, in the hydrated dispersion or in the medium. In solution, clopidogrel nanodroplets grew in buffer, which the authors attribute to the high interfacial energy of the lipophilic drug-rich phase correasoto2022a C37, R6; surfactants "in general" slowed the coarsening of drug-rich nanodroplets formed by LLPS, CTAB excepted, at very low concentrations correasoto2022a C38. In the hydrated dispersion, persistent discrete drug-rich domains with 5 and 10% TPGS "can be rationalized" by TPGS lowering the interfacial energy between the phases and so reducing coarsening, so that the domains can be released intact as the gel layer recedes saboo2021 C40; rapid coarsening without surfactant is "a feasible explanation" for the loss of release saboo2021 C50. In the 40% MePHPH gel heterogeneous domains turned homogeneous between 2 and 20 min, "likely" by movement and coalescence into large domains deac2023a C38, C34.

Findings

Release mechanism and LoC: F16, F20, F25.

Related concepts

acts on drug-rich nanodroplets and on the phase separation morphology of the hydrated dispersion; follows amorphous-amorphous phase separation; slowed by surfactants with surfactant partitioning into the drug-rich phase or at the droplet surface.

Formulas

none.

How it is measured or obtained

Z-average and PDI of droplets by DLS against time, as ratios to the initial value correasoto2022a R6 or at 90 min of dispersion dissolution correasoto2022a R19; in the hydrated dispersion inferred from the morphology of humidified films saboo2021 C51, R21.

Values in the library
materialvalue or classconditionspaper ids
clopidogrel nanodroplets in buffer; with 50 µg/mL CTABZ-average ratio ≈1.5 at 1 h and ≈12 at 2 h; ≈12 at 1 h37 °C, DLScorreasoto2022a R6
clopidogrel nanodroplets with 50 µg/mL SDS, 4 µg/mL TPGS, 5 µg/mL Tween 80Z-average ratio ≈0.92–1.01, ≈0.96–0.99, ≈0.81–0.89 over 4 hsamecorreasoto2022a R6
clopidogrel–PVPVA 40%; 50%, binary and with Tween 80, TPGS, SDS≈790, ≈510, ≈580, ≈690 nm; ≈1960, ≈780, ≈890, ≈1260 nm90 min of dissolutioncorreasoto2022a R19
atazanavir- and clozapine-rich droplets with pre-dissolved HPMCAS-LF; -HF (Bioperformance chapter)grew slightly early and stayed below 300 nm; kept their initial size3 h agitation, 37 °C[ueda2020a C19, R6]
Pitfalls and disagreements

Coarsening in the hydrated dispersion was not followed in time; it is inferred from end-point morphology after 12 h at about 100% RH saboo2021 C51, R21. Why CTAB destabilized the clopidogrel droplets is not known correasoto2022a C38. In the Bioperformance chapter pre-dissolved HPMCAS inhibited coarsening and the droplets were smaller with AS-HF than with AS-LF regardless of the drug [ueda2020a C18].

← Concepts and formulas

concept · as used in Dissolution

drug-rich phase

The dispersed, non-crystalline phase that forms when a supersaturated drug solution phase-separates above the amorphous solubility: a water-saturated supercooled liquid or, for high-Tg drugs, a glass, that can later crystallize; "drug-rich phase" is judged a more appropriate term than "precipitate" trasi2015a C3; mosqueragiraldo2015 C30. In the papers of this chapter it is the object the probes enter [raina2015a C26] and the object that makes UV readings unreliable [tres2018 C37]. Other papers show that it can contain polymer and a second drug [mosqueragiraldo2018b C35; alkalla2026 C4; ueda2022 C10]. New aspects (C. Amorphous solubility and LLPS): the drug-rich phase can be liquid or glassy depending on its water-plasticized Tg (F2), is in equilibrium with the water-rich phase at the amorphous solubility, and keeps the drug activity of the continuous phase constant (F8) ilevbare2013a C36, C61; mosqueragiraldo2015 C35. It is a transient precursor of crystals whose lifetime ranges from minutes to hours (F3) mosqueragiraldo2015 C36, R1. A second unionized drug mixes into it and lowers the amorphous solubility of both (F11) trasi2015a C42. A dissolved ASD polymer also enters it: the polymer:drug weight ratio in the ibuprofen-rich phase was 0.40–1.14 for six polymers at 1000 µg/mL and rose with temperature (PVP-VA 0.46 → 1.32 from 15 to 60 °C), lowering the amorphous solubility (F19–F21) ueda2021 R5; ueda2022 R10. A micellar solubilizer is inferred to stay out of it, because the maximum activity is unchanged, whereas STCDC and SGCDC are inferred to mix into it indulkar2017a C40; lu2017b C50, C51. Where its drug is mobile (ibuprofen, Tg −45 °C), solution NMR sees it ueda2020b C7. New aspect (Bioperformance): the phase is treated as a hydrated amorphous phase in equal activity with the drug-lean solution; for telaprevir it contains polymer when the polymer is poorly soluble [raina2014a C33; mosqueragiraldo2018b C35]. A second, crystalline drug can enter the phase: darunavir partitioned into the atazanavir-rich phase and lowered what remained in solution [alkalla2026 C3, C4, C37]. New aspect (Supersaturation from ASD dissolution): dissolving dispersions form it: a ritonavir-rich phase appeared at about the LLPS concentration, redissolved on dilution and had a glass transition near 1 °C, a supercooled liquid at 37 °C ilevbare2013d R1, R2, C7; danazol dispersions formed it up to 30% drug with three polymers jackson2015 C36. A phase holding two drugs sets both concentrations by its composition trasi2015b C44. Tacrolimus separates a drug-rich phase between 40 and 50 µg/mL (220 nm after 0.7-µm filtration at 60 µg/mL), and six marketed capsules appeared to dissolve to, not beyond, that limit trasi2016 C15, R11, C40; indomethacin with HPMC formed a 70–100 nm droplet phase from about 40 µg/mL, detected by the drug's own fluorescence xie2017 R6, R7, C17.

Findings

Solution methods: F3, F4, F5, F7, F8, F9, F10, F11. C. Amorphous solubility and LLPS: F1, F2, F3, F8, F11, F13, F15, F17, F19, F20, F21, F22, F23. Bioperformance: F5, F6, F7, F20. Supersaturation from ASD dissolution: F7, F9, F11, F13, F21.

Related concepts

measured by light scattering by particles and fluorescent probe partitioning; contrasts with crystallization; related to liquid-liquid phase separation and droplet coalescence. In the amorphous solubility chapter: formed by liquid-liquid phase separation or glass-liquid phase separation; acts as a nanodroplet reservoir (claimed); grows by droplet coalescence; receives dissolved polymer (polymer partitioning into the drug-rich phase); its stability against creaming depends on the polymer (colloidal stability, Ostwald ripening). Composition also set by drug–drug miscibility; dispersed as drug-rich nanodroplets; related to chemical potential and ideal mixing.

Formulas

none specific; see amorphous solubility advantage with water-sorption correction for the limit at which it forms. In the amorphous solubility chapter: binodal condition, ideal-mixing reduction of amorphous solubility.

How it is measured or obtained

By light-scattering extinction (F3), by probe or drug fluorescence (F4 to F6), by NTA or DLS sizing of filtered media [tres2018 P10; trasi2015a R15], by ultracentrifugation (the supernatant gives the concentration of the other phase) [tres2018 P9], and by ¹H NMR peaks of the drug-rich phase ueda2021 R3. In the amorphous solubility papers it is isolated by ultracentrifugation at 274,356 × g with gravimetric water and DSC Tg of the pellet, and examined by polarized microscopy, XRPD, Nile red under a fluorescence filter and ¹H NMR of the dissolved drug ilevbare2013a P7, P8, P9; indulkar2015 P12, P14, P15; mosqueragiraldo2015 P10. The NMR-invisible polymer measures the polymer content (ratio of polymer lost from solution to phase-separated drug), which counts surface-bound polymer too ueda2021 P4, X4. In the Bioperformance papers: pellet analysis after centrifugation (polymer by colorimetry, drug by Nile red) [mosqueragiraldo2018b P12–P14]; NTA counts [alhalaweh2016 P13]; mass balance from antisolvent additions [alhalaweh2016 P12]. In the ASD dissolution papers: stepwise addition and dilution with light scattering; DSC of the ultracentrifuged phase; pyrene I1/I3 (lower in a hydrophobic phase); SEM; nanoparticle tracking; ultracentrifugation with assay of the pellet ilevbare2013d P4, P9, P7, P8; jackson2015 P5; trasi2015b P9.

Values in the library
materialvalue or classconditionspaper ids
ritonavir, 10% Kollidon VA64 dispersionmean size 696.4 ± 213.6 nmNTA, medium filtered at 1 µm, about 60 min[tres2018 R18]
lopinavir, 10% dispersion294.3 ± 67.7 nmsame[tres2018 R18]
ritonavir 30 µg/mL≈360 nmDLS, antisolventtrasi2015a R15
ritonavir–HPMCAS dispersion≈500 nmNTA of 0.45 µm filtrate, 1 htrasi2015b R7
tacrolimus, 60 µg/mL≈220 nm, a second phaseNTA of 0.7 µm filtrate, pH 4.5, 37 °Ctrasi2016 R11
telaprevir (glass, Tg 52 °C)≈300 nm; redissolves within about 2 min on dilution37 °Cmosqueragiraldo2015 R4, R5, R8, C13
ibuprofenmicron-sized in buffer; ≈300 nm with HPMC or PVP-VApH 2.0, 37 °Cueda2020b R5
felodipine aggregatesτ2 ≈1.87–2.04 ns, share a2 14–39%24–38 µM, pH 7.4, HPMC 100 µg/mL[tres2017 R1.d–f]
clotrimazole; efavirenz drug-rich phasesPRODAN second band ≈435 and ≈450 nm; τ2 up to 3.40 and 3.89 nspH 7.4[tres2017 P1, R13, R10, R11]
ritonavir pellet94.85–95.97% drug, 4.03–5.15% water, Tg 0.4 °C10–50 °C, waterilevbare2013a R5, R6
weak-base precipitatesX-ray amorphous halos, no birefringence; Tg about 14 (clotrimazole) and about 51 °C (atazanavir)37 °Cindulkar2015 R19, R20, R21, R22
lopinavir added to a ritonavir-rich phaseabout a third stays in bulk; about 0.21 at 85 µg/mL ritonavir25 °Ctrasi2015a R9, R10
ionized diclofenac with the ritonavir-rich phasefully recovered in bulk25 °Ctrasi2015a R11
ibuprofen-rich phasepolymer:drug weight ratio 0.40 (PVP K12), 0.52 (K25, K90), 0.87 (PVP-VA), 0.95 (HPMC 603), 1.14 (HPMC 615)1000 µg/mL polymer, 400 µg/mL drug, 37 °Cueda2021 R5
ibuprofen-rich phaseratio 0.24 → 0.62 (PVP), 0.46 → 1.32 (PVP-VA), 0.20 → 1.46 (HPMC, to 55 °C)15–60 °Cueda2022 R10
pazopanib precipitate (dried)Tg about 83 °C; non-birefringent aggregates then free-base crystalspH 6.5 after pH shiftsugihara2018 R11, R17
telaprevir, 90% CA Sub ASDpolymer 9407 µg, drug 1080 µg; polymer fraction 0.90150 µg/mL, 15 mL[mosqueragiraldo2018b R14]
telaprevir, 90% HPMCAS / 70% HPMCAS / 90% PVPVApolymer fraction 0.21 / 0.27 / 0.22same[mosqueragiraldo2018b R14]
ritonavir, atazanavirNTA counts: buffer 4.74 × 10⁶; ATV 150 µg/mL 4.15 × 10⁸ per mLantisolvent[alhalaweh2016 R15]
clotrimazole1.2 × 10⁸ to 12.5 × 10⁸ per mL8–20 µg/mL[indulkar2016 R4]
atazanavir with darunavir hydrateatazanavir in the drug-lean phase about 61–63 instead of 91–96 µg/mL at about 196 µg/mL darunavir added150 µg/mL atazanavir, 400 µg/mL HPMCAS, pH 6.8[alkalla2026 R11, C1]
ritonavir phase from a PVP dispersionTg inflection 1.05 °C; pyrene I1/I3 ≈1.43–1.46water, 37 °Cilevbare2013d R2, R3
danazol, 90:10 dispersions246–284 nm, 4.1–4.5 × 10⁹ per mL25 °Cjackson2015 R6
lopinavir alone; with ritonavircrystallized at 1–2 h; no crystallization in 5 hpyrene I3/I1trasi2015b R15
indomethacin with 100 µg/mL HPMConset 36 µg/mL; droplets 70–100 nmpH 2.2, 37 °Cxie2017 R4, R6
indomethacin EPO–HPMC dispersion≈75 nm species; redissolved within ≈2 min after a rise to pH 537 °Cxie2017 R15, R20
Pitfalls and disagreements

Its amorphous nature was often inferred, not tested: the supernatant matched the amorphous solubility, but no solid-state measurement was made [tres2018 X5]. Size varies strongly with drug, medium and technique (about 160–700 nm in the rows above), so no size transfers. Filtration may not remove it jackson2015 C12; trasi2016 R8. Droplets coalesce and grow with time, which changes scattering [jackson2014 C29; tres2018 C28]. A glassy phase behaves much like a liquid one in these tests mosqueragiraldo2015 C30. In the amorphous solubility papers the ritonavir DSC trace shown stops at 20 °C, so the absence of melting is stated, not shown ilevbare2013a X8. The water content of the telaprevir pellet was not measured mosqueragiraldo2015 X3. The polymer in the phase is the NMR-invisible polymer and the droplet composition is not known ueda2021 X4; ueda2020b X4. The composition of the mixed ritonavir–atazanavir phase was calculated, not measured [alhalaweh2016 C17]; absolute pellet amounts of the telaprevir study are not mass balances [mosqueragiraldo2018b X8]. The NTA count of the ritonavir–atazanavir mixture is below that of buffer [alhalaweh2016 X6]. The centrifuged drug-rich phase of the darunavir study was not analysed; its composition is inferred from supernatant depletion and flux (F20) [alkalla2026 X6]. In the ASD dissolution papers the ritonavir phase's water content was not measured, and the probe run is described in two media ilevbare2013d C8, X1. Tracking cannot tell droplets from crystals jackson2015 X13. For ritonavir the phase "appears" to promote crystallization rather than protect against it ilevbare2013d C41. The non-crystalline state of the indomethacin droplets rests on optical methods; they crystallized after 3 h at pH 2.2 xie2017 X18, R15.

← Concepts and formulas

concept · as used in Dissolution

drug-rich surface layer

A polymer-depleted, drug-enriched layer at the surface of a dissolving ASD, left when the polymer dissolves ahead of the drug above the limit of congruency. Moseson (2022) shows it on bicalutamide–PVPVA compacts and says that this layer, hydrated and mobile, crystallizes within 20–30 min, which "could prevent release, promote surface crystallization, and prevent or slow continued hydration" [moseson2022b C46, C43]. In the 2021 paper it was inferred from the shape of the PVPVA release curve and pitted surfaces, "presumably drug-rich" moseson2021 C32, C58. It is the general case of surface drug enrichment applied to dissolution. New aspect (Release mechanism and LoC): the layer is the drug-controlled surface of the older two-component literature (sulfathiazole–PVP, cited) purohit2017b R23, and the nifedipine study states that if water-induced phase separation forms such a layer, the drug controls release and the carrier effect of the polymer is lost indulkar2017b C33. For ritonavir the authors add that drug molecules "can" move laterally on the dissolving surface and that drug-rich nanodomains "can" coalesce into contiguous regions, ritonavir being a supercooled liquid at 37 °C indulkar2019a C28, C40. Saboo and co-workers (2021) model it as what a contiguous drug-rich network leaves once the polymer-rich phase dissolves ("likely") saboo2021 C39; for clopidogrel, faster polymer loss leaves a drug-enriched compact that "likely accounts for" incomplete release correasoto2022a C25.

Findings

ASD process: F27, F38, F48. Release mechanism and LoC: F3, F7, F20.

Related concepts

forms above the limit of congruency during incongruent release; sits on the gel layer; leads to matrix crystallization and surface crystallization. Its barrier role is the drug-rich barrier layer; sets drug-controlled release; mobile where the drug is a supercooled liquid.

Formulas

None.

How it is measured or obtained

SEM-EDX of exposed compacts: fluorine occurs only in the drug, so F/F0 above 1 means drug enrichment; confocal fluorescence with a drug-rich dye; SEM of the surface for crystals [moseson2022b P14, P15, P16, P17, C8]. In the release-mechanism papers: IR of the tablet surface, micro-CT and SEM of dried compacts indulkar2019a P7, P8; que2019 P5; saboo2019 P14.

Values in the library
materialvalue or classconditionspaper ids
30% BCL–PVPVA compact surfaceF/F0 = 1.23 ± 0.07 (about 20% enrichment)30 min in buffer[moseson2022b R14]
same, cross-sectiondrug-rich boundary layer 94 ± 8 µm with crystals, F/F0 = 1.41 ± 0.10; gel layer below F/F0 = 0.93 ± 0.061 h[moseson2022b R15]
same, confocalred layer 55 ± 6 µm at 5 min, 103 ± 9 µm at 30 minNile red[moseson2022b R16]
50% BCL–PVPVA compact5–10 µm crust of crystals; red regions of 8 ± 2 µm at 5 min, a continuous layer of 1.9 ± 0.3 µm at 30 min, gone at 60 minSEM-EDX, confocal[moseson2022b R15, R17]
10% BCL–PVPVA compactsurface smooth at 30 minSEM[moseson2022b R14]
coated ritonavir–PVPVA tablet edgeconnected drug-rich regions along particle boundariesconfocalbenson2025 R14
ritonavir–PVPVA 50%amorphous-ritonavir IR spectrum from 5 min; flaky at 15 minpH 6.8, 37 °Cindulkar2019a R16, R17
ledipasvir–PVPVA 10%distinct top layer at 10 min; bulging, porous top by 30 minmicro-CT, driedque2019 R13
nilvadipine 15:85porous layer within 10 min, growing to 30 minmicro-CTsaboo2019 R13
felodipine 30% in PVP, PVPVA, HPMCporous layer at the dissolving facemicro-CT, 10 minsaboo2020a R19
felodipine 30% with 0, 2% TPGS; 5, 10% TPGSporous surface layer after 10 min; homogeneousmicro-CT, driedsaboo2021 R19
indomethacin–PVPVA 15, 25%rough, porous surface after 5 min; smooth at 10%SEMsaboo2020 R19
Pitfalls and disagreements

The layers were measured on compacts, and the crystals were identified by shape and not by diffraction [moseson2022b X20, X18]. The polymer-depleted state of the 50% crust is inferred from the dye, and the authors read the crust as formed and dissolved repeatedly, which would make its slow release only "seemingly congruent" [moseson2022b X16, C47]. A drug-rich surface is not the only consideration: a TPGS dispersion released incongruently yet completely because little solid was left when nucleation began [moseson2022b C50]. The layer of the ITZ compacts is a "supposition" bhardwaj2018 C52; SEM and micro-CT samples were dried indulkar2019a X11; que2019 X22.

← Concepts and formulas

concept · as used in Dissolution

enteric polymer

Evidence table: enteric polymer. Content from the ASD dissolution chapter (posaconazole 2019, delamanid 2022–2023, praziquantel 2024–2025) and the Bioperformance chapter.

A polymer with acidic groups, such as the succinoyl groups of HPMCAS, the phthalyl groups of HPMCP or the methacrylic acid of the Eudragit L grades, that stays largely undissolved at gastric pH and dissolves above a threshold pH set by its substitution nguyen2023c R4, C14; nguyen2023b M11. In a dispersion it holds most of the drug back in the stomach, which an enteric polymer is chosen for, but it is a poor crystallization inhibitor where it is unionized, so the drug in the wetted matrix can crystallize in acid nguyen2023b C36, C37. Around a tablet, as a coating, the same chemistry keeps the gastric medium away from the dispersion altogether nguyen2023b C43. Weakly acidic polymers with pH-responsive solubility are used more and more in dispersions, while release and crystallization at a pH where the polymer is insoluble are "not well understood" [nguyen2023a C1].

Findings

F24, F25, F27, F28.

Related concepts

defined by pH-dependent polymer solubility and polymer ionization; governs drug leaching and polymer-controlled release; risk of surface crystallization in acid; read with gastric pH variability.

Formulas

pH-solubility profile.

How it is measured or obtained

Polymer solubility by hydrolysing the cellulose backbone of the dissolved polymer and assaying it by HPLC-ELSD, checked by phenol–sulfuric acid colorimetry, from pH 1.6 to 6.5 nguyen2023c P3, P4; polymer release alongside drug release during a two-stage test by the same assay nguyen2023c P10. Coat integrity by stirring coated tablets in gastric media overnight and photographing them, with a USP acid-stage tolerance test nguyen2023b P6, P7.

Values in the library
materialvalue or classconditionspaper ids
HPMCP-50; HPMCP-55893 ± 95 and 189 ± 18 µg/mL at pH 5.0; insoluble below pH 4.550 mg in 15 mL, 48 h, 37 °Cnguyen2023c R4
HPMCAS-LF; -MF1687 ± 47 and 1401 ± 69 µg/mL at pH 5.5the samenguyen2023c R4
HPMCAS-HFdissolves only from about pH 6.0the samenguyen2023c R4
HPMCAS-HF, cited threshold (Bioperformance)the most hydrophobic grade, with the highest acetyl:succinoyl ratio, needs the highest pHcited[nguyen2023a C15]
Eudragit L 100-55 as an Acryl-EZE II coat, 14–16% weight gainintact 15 to more than 17 h at pH 1.6–3.0; failed after ≈130–150 min at pH 4.5–5.0; dissolved in 10–15 min at pH 6.0500 mL, 37 °Cnguyen2023b R7
posaconazole–HPMCAS-MF dispersions in FaSSGF7.5–11.5% of a 400 µg/mL dose released in 60 minpH 1.6, 37 °Celkhabaz2019a R10
praziquantel–HPMCAS-MF dispersions, first stage≈9–29% released against ≈88–106% for HPMC E5 LVpH 1.6–5.0 or FaSSGF, 37 °Calvarenga2025 R7, R10, R13
Pitfalls and disagreements

The polymer that releases best at intestinal pH is not the one that protects best in acid, and the ranking reverses with the gastric pH: delamanid dispersions of HPMCP-55 ended at ≈80.5% after pH 3.0 but ≈12.5% after pH 5.0, below HPMCAS-LF nguyen2023c R11, X3. Holding the drug back is incomplete: posaconazole and delamanid dispersions released 7.5–41% of the dose in acid, where the matrix can then crystallize elkhabaz2019a R10; nguyen2023b R2. The printed polymer solubilities above about 3.3 mg/mL exceed what the stated amounts allow nguyen2023c X1.

← Concepts and formulas

concept · as used in Dissolution

entropy of mixing

The entropy gained when drug and polymer mix

For a drug with a polymer it is much smaller than with a small solvent, because the configurational entropy of the polymer is reduced by the connectivity of its repeat units, and it is nearly the same for any polymer grade [marsac2006b C10, C11]. For typical drugs (molecular weight 200–600) and polymers (10,000 and above) the contribution is "predicted to be relatively constant" and always favourable, so the enthalpy of mixing decides miscibility [marsac2006b C12, C13; marsac2009 C26]. In the ideal case the entropy of mixing of two components is ΔS = −R(X_u ln X_u + X_v ln X_v), printed without its minus sign in one paper [rumondor2009a E3, X7]. Where an entropy of mixing is not measured, readings of the activity coefficient and of χ as enthalpy rest on the assumption that it is close to ideal [marsac2009 C11]. For two polymers the entropy per lattice site falls with the chain length of both, from about −27 × 10⁻²³ J for a 783 Da maltodextrin with PVP K 12 to about zero for a 450 kDa dextran with PVP K 90, so the grade-independence found for a small drug does not hold between polymers [vaneerdenbrugh2012a R15, C34, C35].

Findings

F5, F9, F22.

Related concepts

part of free energy of mixing; includes combinatorial entropy of mixing; contrasts with enthalpy of mixing; related to Flory-Huggins theory.

Formulas

Flory-Huggins free energy of mixing, Gibbs free energy of mixing.

How it is measured or obtained

Not measured: it is computed from the Flory–Huggins expression with χ = 0, for a lattice whose site is one drug molecule [marsac2006b P6, R1]; for a small analogue liquid such as methyl pyrrolidone or 1-ethyl-2-pyrrolidone it is taken as ideal [marsac2006b C46; marsac2009 C11].

Values in the library
materialvalue or classconditionspaper ids
nifedipine with methyl pyrrolidoneminimum near Φ ≈ 0.44χ = 0[marsac2006b R1]
nifedipine with PVP K12, K29/32, K90minimum near Φ ≈ 0.6; K29/32 and K90 virtually identical, K12 slightly lowerχ = 0[marsac2006b R1]
typical molecular weightsAPIs 200–600; polymers 10,000–1,000,000cited[marsac2009 R13]
indomethacin, EP → PVP K12 → K29/32 → K90predicted solubility 0.396 → 0.144 → 0.134 → 0.134entropy term scaled with chain length[marsac2009 R9.e, C24]
maltodextrin (783 Da) with PVP K 12 to K 90minimum about −27 to −21.5 × 10⁻²³ J per site25 °C, no enthalpy term[vaneerdenbrugh2012a R15]
6 kDa dextran with PVP K 12 to K 90−9.1 to −2.8 × 10⁻²³ Jsame[vaneerdenbrugh2012a R15]
450 kDa dextran with PVP K 90about 0same[vaneerdenbrugh2012a R15, C35]

Evidence table: entropy of mixing.

Pitfalls and disagreements

The generalization to all drugs and polymers rests on one simulated drug, with an unscaled axis, and on a PVP grade (K12, 2,500) below the stated polymer range [marsac2006b X7, X8]. The ideal-entropy assumption for the analogue liquid and for equal contacts in analogue and polymer was not tested [marsac2009 C11, X17]. In ternary systems with absorbed water the entropy still favours mixing, and demixing is expected only when the enthalpy of mixing is positive enough rumondor2010c C27. Two of the 20 plotted curves (PVP K 12 with 40 kDa and 450 kDa dextran) do not follow from the stated inputs [vaneerdenbrugh2012a X1].

← Concepts and formulas

concept · as used in Dissolution

falling-off-the-cliff effect

Evidence table: falling-off-the-cliff effect. Content from the release-mechanism chapter (2018–2022), with comparison rows from the ASD dissolution chapter.

The steep fall of drug release over a small increase of drug loading just above the limit of congruency, named "falling off a cliff" for ritonavir–PVPVA, whose drug release at 60 min fell from ≈97% at 25% loading to ≈29% at 30% and below ≈2% at 35–50% indulkar2019a C31, R11. The authors stress that the range of loadings over which release switches from polymer- to drug-controlled is "very narrow" and that the switch changes the drug release rate by "orders of magnitude" indulkar2019a C52. Saboo and co-workers (2020) contrast this "cliff" with the gradual "slope" of HPMCAS dispersions saboo2020a C29. Yang and co-workers (2021) saw the cliff in powders as well as compacts for six drugs in PVPVA and call the HPMCAS decline a negative "slope" instead yang2021 C2, C41. Yang and co-workers (2022) hypothesized that the cliff coincides with a continuous drug-rich barrier at the dispersion surface yang2022a C10, C7.

Findings

Release mechanism and LoC: F6, F8, F11, F22.

Related concepts

marks the limit of congruency; separates polymer-controlled release from drug-controlled release.

Formulas

surface-normalized release rate.

How it is measured or obtained

Percent released at a fixed time against loading, or normalized drug rates across the switch, from constant-area compacts indulkar2019a R11; saboo2019 R5, R6; saboo2020a R14.

Values in the library
materialvalue or classconditionspaper ids
ritonavir–PVPVA 25 → 30 → 35%≈97 → ≈29 → ≈1.7% drug at 60 minpH 6.8, 37 °Cindulkar2019a R11
nilvadipine–PVPVA 10 → 15%2.13 → 0.035 mg/min/cm² (60-fold)samesaboo2019 R5, R7
cilnidipine–PVPVA 15 → 20%2.18 → 0.006 mg/min/cm² (about 360-fold; described as "similar")samesaboo2019 R6, X8
felodipine–PVP 10 → 15%; –PVPVA 15 → 20%≈3.8 → ≈0.020; ≈1.9 → ≈0.009 mg/min/cm² (synthesis: 190- and 211-fold)samesaboo2020a R14
ITZ–PVPVA 20 → 25% (SD); 10 → 20% (HM)113 → 64; 199 → 48.8 µg/min/cm² (synthesis: 1.8- and 4.1-fold)0.1 N HClbhardwaj2018 R4
praziquantel–HPMCAS-MF, HPMC (ASD dissolution chapter)no cliff; release never declined massively with loadingPBS pH 6.5polyzois2024 C16, C18
indomethacin–PVPVA 10 → 15%3.14 → 0.04 mg/min/cm²5-min ratessaboo2020 R3
loratadine, miconazole, danazol, elbasvir in PVPVA≈85 → 41 → 8; 93 → 42 → 3; 78 → 9.5; 77 → 13 µg/mL of 100powdersyang2021 R7, R8, R9, R10
atazanavir–PVPVA 5 → 10%≈100 → below 3% releasedcompacts, 37 °Ccorreasoto2022b R1
lumefantrine sulfate–PVPVA 2 → 5%4.5 → 0.10 mg/min/cm²compactshiew2022b R12
ritonavir–PVPVA 20 → 30 → 40%drug ≈100 → 35 → 3% at 90 mincompacts, pH 6.8yang2022a R2
Pitfalls and disagreements

Loadings were tested in 5% steps, so the cliff is located only to the step saboo2020a X11. For HPMC the drop came in two steps (≈0.14 → ≈0.04 → ≈0.005 mg/min/cm²) saboo2020a X11, R14. (synthesis: the height of the cliff is bounded by the ratio of the polymer-controlled to the neat-amorphous rate, so it is small where the amorphous drug alone dissolves fast, as for ITZ in 0.1 N HCl.) Stated cliff loadings mix the last good and the first poor loading yang2021 X26.

← Concepts and formulas

concept · as used in Dissolution

Fick's first law

Steady-state diffusive flux through a membrane written in activity form, J = D S a/(h \gamma_m) [raina2014a E6]; the concentration form is J = (D_{eff}/l)(C_d - C_r) [indulkar2016 E1]. The darunavir and posaconazole papers also write it as J = -D\,dC/dx and as the permeability form J = P C [alkalla2026 E1; elkhabaz2019b E5].

Findings

F2, F5, F18, F20.

Related concepts

underlies membrane flux; needs sink conditions.

Formulas

membrane flux in terms of solute activity, membrane flux from concentration difference.

How it is measured or obtained

Used as a model, not fitted: constants D, S, h and γm are assumed constant and not printed [raina2014a E6; hate2017 E1; alhalaweh2016 E1].

Values in the library
materialvalue or classconditionspaper ids
side-by-side cell, activity formJ = DSa/(h\gamma_m), 7.065 cm²felodipine, nifedipine[raina2014a E6]
flow-through cell, concentration formJ = (D_{eff}/l)(C_d - C_r)clotrimazole[indulkar2016 E1, E4]
danazolJ = (dM/dt)(1/S) = D a/(h\gamma_m)ASDjackson2015 E1
atazanavir, posaconazole, six mediapermeability form J = PC: apparent permeability on total concentration fell in micellar media; multiplied by the ratio of total to buffer solubility it was 1.33–1.77 × 10⁻³ (atazanavir) and 2.36–3.03 × 10⁻³ cm/min (posaconazole)side-by-side, 37 °Celkhabaz2019b E5, R12, R13
Pitfalls and disagreements

The text of one paper writes γ for the membrane activity coefficient in Eq. 3 and for the donor in Eq. 4 [raina2015c X8]. The permeability form with total concentration under-reads permeability where micelles bind drug (F18) elkhabaz2019b R12, R13.

← Concepts and formulas

concept · as used in Dissolution

Flory-Huggins interaction parameter

The parameter \chi of Flory–Huggins lattice theory that expresses the energy of drug–polymer contacts relative to the contacts in the pure components. In the PEG papers \chi > 0, \chi = 0 and \chi < 0 mean endothermic, athermal and exothermic mixing [baird2011 C26], and more negative values are "consistent with" a negative enthalpy of mixing and favourable drug–polymer interactions [zhu2011 C6]. The three PEG papers that report it define it differently: Baird and Taylor divide a back-calculated interaction energy by R\,T_{eut,th}, Zhu and co-workers take the drug volume as lattice site and normalize per PEG segment [baird2011 E8; zhu2011 E1, E2]. Marsac and co-workers take the volume of a low-molecular-weight analogue as lattice site for polymers such as PVP [marsac2009 E2]. New aspects (Miscibility and drug-polymer interactions): χ reflects the relative strength of cohesive (drug–drug, polymer–polymer) and adhesive (drug–polymer) interactions and has an entropic part; it can vary with temperature and composition [marsac2006b C15]. A negative χ describes strong, numerous adhesive interactions that favour miscibility, a positive χ stronger cohesive interactions [marsac2006b C16]. In the simulations the χ needed for miscibility over the whole composition range of nifedipine–PVP is about 0.6 or less, and the critical value depends on the lattice definition and is system specific [marsac2006b R3, C18]. Because the entropy of mixing with a polymer is small and almost the same for any pair, differences between compounds come from the magnitude of χ [marsac2009 C26, C31]. A larger negative χ reflects a greater driving force for mixing near the drug's melting temperature [marsac2009 C18]. For dextran–PVP blends χ was not determined and was assumed independent of molecular weight so that only the combinatorial term differs between the 20 pairs [vaneerdenbrugh2012a C33]; for itraconazole–HPMC no χ was measured, and a positive χ is inferred from the lack of hydrogen-bond donors [purohit2015a C41, C42, C47]. New aspect (ASD process): in the 2018 hot-melt extrusion study the lattice volume is the drug's molecular volume (molecular weight divided by true density: IDM 273 cm³/mol, PVPVA 46,610 cm³/mol), \phi is the drug volume fraction from true densities and m the polymer-to-drug volume ratio (170.7 at 50/50) [moseson2018 M1, M2, E2, E6]. The same theory applied to water gives large positive water–drug parameters and a small water–polymer parameter; the asymmetry is the reason cited for moisture-induced demixing [marsac2010 C43; rumondor2009c C45, C46]. In the four-component drying model χ is estimated for each pair from vapour-sorption fits (Flory–Huggins sorption isotherm), a solubility or a heat of mixing: ritonavir–methanol 0.8, ritonavir–water 2.8, PVPVA–methanol 0.73, PVPVA–water 1.13, methanol–water −0.002, ritonavir–PVPVA 0.5 (assumed in the SI) li2020 R15, E12. In the later HME papers the same linearized fit gave a negative value for bicalutamide–PVPVA and a positive one for posaconazole–HPMCAS, so the sign differs between pairs [moseson2022c R8; shah2024 R4]. New aspect (Physical stability): water–component parameters from sorption isotherms rank drugs and polymers by their dislike of water, and the drug–water value split six drugs by moisture-induced separation in PVP [rumondor2010a R11; rumondor2009c R24, C46]. New aspect (Supersaturation from ASD dissolution): in an argument about dissolution, the enthalpy of solution of pure amorphous drug contains the water–drug term χ12, whereas a dispersion adds water–polymer (χ13) and drug–polymer (χ23) terms, so there is "no reason to expect" the two to give the same solution activity alonzo2011 E7, E8, C43, C45. In the lopinavir work χ enters the drug's chemical potential in a polymer that stays undissolved: a more negative χ, a stronger drug–polymer attraction, lowers the maximum concentration more than dilution alone, a χ above zero lowers it less, and a large χ gives phase separation with little suppression li2018 C44, C51. χ was not measured; the model is "probably best applied in a qualitative manner" li2018 C46. New aspect (Release mechanism and LoC): in the water–drug–polymer free energy of mixing, three pairwise parameters enter: \chi_{DP} is negative or small for a molecular dispersion, \chi_{WD} of a hydrophobic drug is large and positive, and \chi_{WP} is smaller because the polymer hydrogen-bonds with water; a large difference between \chi_{WD} and \chi_{WP} gives a tendency to phase separate on hydration purohit2017b C43, E2, E4. Yang and co-workers (2021) use the Δχ form to explain why log P fails: drugs have much larger χ with water than polymers (cited), so water–drug against water–polymer interactions, drug–polymer interactions and hygroscopicity, not one descriptor, decide separation yang2021 C21, C22, E2.

Findings

PEG dispersions: F2, F3, F5, F6. Miscibility and drug-polymer interactions: F2, F5, F6, F7, F8, F9, F18, F22. ASD process: F8, F1, F20, F41. Physical stability: F4, F8, F13, F23, F29. Supersaturation from ASD dissolution: F7, F18. Release mechanism and LoC: F8, F9.

Related concepts

depends on enthalpy of mixing and melting point depression; derived from drug-polymer interaction energy; contrasts with athermal mixing; related to drug-polymer interactions and activity coefficient; part of Flory-Huggins theory. Relates to drug solubility in polymer. Basis of Δχ effect; measured from water sorption isotherm; linked to water through hydrophobicity; related to drug-polymer miscibility and amorphous solubility advantage. Related to drug-polymer-water miscibility.

Formulas

Flory-Huggins melting point depression, Flory-Huggins interaction parameter from interaction energy, Lacoulonche liquidus model; Flory-Huggins interaction parameter from solubility parameters, Flory-Huggins free energy of mixing, Flory-Huggins activity equation. Extrusion work: molar volume from molecular weight and density, multicomponent Flory–Huggins free energy of mixing. Water sorption: Flory-Huggins water sorption isotherm, ternary Flory-Huggins water sorption isotherm. Dissolution of dispersions: Flory–Huggins enthalpy of mixing for two and three components (named, no shared page) alonzo2011 E7, E8; Huang model of drug solubility in an ASD, Δχ effect.

How it is measured or obtained

From the melting point depression of the drug: the slope of the linearized relation against the squared polymer volume fraction, at 50–80% drug in the PEG study [zhu2011 P5, E1]; from the interaction energy that closes the gap between the athermal and the observed eutectic [baird2011 P8, P10, E3, E8]; for PVP, from the slope of the melting-point plot at 0–25 wt% polymer, or from group-contribution solubility parameters [marsac2006b R8, R9, R4]. In the Marsac studies of drugs in PVP and other polymers, three routes appear. (1) Group-contribution solubility parameters, Eq. 2, which always give a non-negative χ [marsac2006b E2, R4]. (2) The slope of the linearized melting point depression against Φ_polymer², over 0–25 wt% polymer, with the lattice site set to the drug (2006) or to a liquid analogue (2009), using the offset of the melting peak in 2009 [marsac2006b E10, R8, R9; marsac2009 P6, C16]. (3) From the activity coefficient of the drug in a liquid analogue (1-ethyl-2-pyrrolidone, 25 °C), scaled to the polymer with Eq. 8 [marsac2009 P7, E8, E9]. A fourth route, the ternary Flory–Huggins fit to moisture sorption, was unable to give unambiguous values [rumondor2010a C30]. In the extrusion work χ is the slope of the linearized melting point depression plot A=\chi B, with A=\left(-\Delta H/R\right)(1/T_c-1/T_m)-[\ln\phi+(1-1/m)(1-\phi)] and B=(1-\phi)^2, fitted through 90/10 to 50/50 IDM:PVPVA; the printed value is reproduced only with a free intercept of about +0.02 (a line through the origin gives −1.86) [moseson2018 E4, R4, X7]. For water: binary Flory–Huggins sorption fits of pure amorphous components, and the drug–water χ from the 95% RH uptake [rumondor2010a P4; rumondor2009c P13, E5]. In the ASD dissolution papers no values were measured; binary parameters cannot simply be carried into the ternary model (cited) alonzo2011 C44, R27. In the release-mechanism papers: not measured in the release-mechanism papers; used in argument purohit2017b E2, E4.

Values in the library
materialvalue or classconditionspaper ids
chlorpropamide; haloperidol with PEG 3350−0.50 and 0.08; −2.53 and −0.04zhu2011 (per PEG segment); baird2011 (\Delta W/RT), same phase diagrams[zhu2011 R5.c, R5.a; baird2011 R9.a, R9.d]
aceclofenac; loratadine with PEG 3350−6.68; 0.13\Delta W_{d,p}/(R\,T_{eut,th})[baird2011 R9.b, R9.c]
benzocaine, ibuprofen, nilutamide, ketoconazole with PEG 3350−0.23, −0.19, −0.09, 0.02melting point depression at 50–80% drug[zhu2011 R5.b, R5.d, R5.e, R5.f]
nifedipine; felodipine with PVP K12−3.8; −4.2 near the melting point; solubility-parameter estimates 2.0 and 0.5slope of the linearized plot[marsac2006b R9, R4]
indomethacin with PVP K12−6.16 (onset), −1.94 (midpoint), −0.82 (offset)melting point depression[marsac2009 R6]
indomethacin with PVPVA−1.97 (R² = 0.9895); reproduces all predicted Tc of Table III within 0.05 °Cused to predict Tc; slope with free intercept, 50–90% DL[moseson2018 R4, R5, E2]
PVP-miscible pairsnegative or near zero; immiscible pairs larger positive values, from −0.82 to 0.72offset melting[marsac2009 C17]
indomethacin, felodipine, nifedipine, ketoconazole, sucrose with PVP K12offset χ −0.82, −0.08, 0.00, −0.08, 0.021 °C/min[marsac2009 R7.a, R7.b, R7.c, R7.d, R7.e]
same five compoundssolubility-route χ −1.83, −0.08, −0.81, −0.12, −0.5325 °C, EP[marsac2009 R9]
sucrose–dextran; ibuprofen–dextran; indomethacin–dextran; itraconazole–Eudragit E1000.20; ≥ 0.38; ≥ 0.72; ≥ 0.11 (lower limits for the last three)offset melting[marsac2009 R7.f, R7.g, R7.h, R7.i, C19]
felodipine–PVP; indomethacin–PVP−9.6 to 26.9; −20.4 to 22.0 (ranges only)ternary sorption fit[rumondor2010a R14]
IDM–PVPVA in four other studies−0.64, −2.06, −2.9, −4.5 (assignment to studies not printed)cited[moseson2018 R7]
water–felodipine, water–PVPabout 3.3 and about 0.5 (Δχ large)sorption isotherms, Flory–Huggins fits[marsac2010 C43]
water with amorphous felodipine, PVP, HPMC and HPMCAS3.27 for felodipine; above 0.5 for HPMC and HPMCAS; the PVP value close to but slightly below other authors' valueswater sorption isotherms, 25 °C[rumondor2010a R11, C19, C20]
BCL–PVPVA 30% DL−1.57, read as favourable miscibilityphase diagram, SI not suppliedmoseson2021 M1, C10
RTV–PVPVA (drying model)0.5 assumed in the SI; "likely <0.5, and possibly close to zero" in the text; varied −0.5 to 0.5sensitivity moved mainly the drug–polymer sideli2020 R15, R16, C72, X10
water–ritonavir and water–PVPVA (drying model)2.8 and 1.13fitted to dynamic vapour sorption, room temperatureli2020 R15
BCL–PVPVA 30–90% BCL−1.57 (R² 0.994); Tc 145 °C at 30% BCLDSC offsets extrapolated to 0 °C/min[moseson2022c R8, R9]
PCZ–HPMCAS MF, PCZ fractions 0.4–1.0+0.43 (R² 0.991); the fitted line meets B = 0 at A of about −0.05sameshah2024 R1, R4
water with nifedipine, felodipine, droperidol, pimozide, indomethacin, ketoprofen2.84, 3.18, 2.85, 3.58, 2.50, 2.7125 °C, 95% RH[rumondor2009c R24]
nifedipine–PVP, felodipine–PVP (cited)−3.8 and −4.2 from melting point depressionused for activity[marsac2006a R18]
indomethacin–PVP vs nifedipine–PVP (cited)−0.8 vs 0.0used for susceptibility[rumondor2009c R26]
indomethacin against felodipine, quinidine, pimozide with PVPVAlarger carbonyl red shift (42–44 against 19–22 cm⁻¹) "would result" in a lower \chi_{DP}IR of dry filmsrumondor2010c R20, C28
hydrophobic drugs with water\chi_{WD} expected positive from log Pqualitativerumondor2010c C30
indomethacin with HPMC, HPMCAS, PVPχ not measured; stronger interaction "would" lower the driving force for growthargument with the free energy of mixing[tian2017 E2, C30, X13]
lopinavir with HPMCP, EC, HPMCASranked HPMCP > EC > HPMCAS in suppression, read as interaction strengthpH 3, 25 °Cli2018 C54
lopinavir with CA, EUDtwo Tgs, sorption on the additive line; little suppressionpH 3, 25 °Cli2018 C56
ritonavir with PVP, PVPVA, HPMCASno values; the argument explains AAPS of PVP and PVPVA films at 97% RH25 °Cpurohit2017b C43, C1
six drugs with PVPVA and HPMCASno χ measured; argument—yang2021 E2, C21
Pitfalls and disagreements

The values of one paper are not comparable with those of another: for the same published diagram of chlorpropamide the two PEG papers give −2.53 and −0.50, and for haloperidol −0.04 and 0.08, so the sign near zero is not robust [baird2011 R9; zhu2011 R5]. The printed expression for the interaction energy in Baird and Taylor does not reproduce, and only signs and ranking are robust [baird2011 X3]. Zhu and co-workers fitted \chi at 50–80% drug, not at the 20/80 composition of the SAXS/WAXS samples, and the normalization cannot be reproduced from printed inputs [zhu2011 X10]. In the PEG study the size of \chi did not rank the size of the long-period increase: chlorpropamide has the most negative \chi and the smallest increase [zhu2011 X5]. The reading as exothermic mixing assumes a near-ideal entropy of mixing [baird2011 C23]. The printed solubility-parameter values (2.0, 0.5) were not reproduced from the inputs (2.36 and 0.70 at 298.15 K) [marsac2006b X1]. The melting-route χ of one pair spans 7.5-fold with the point of the melting peak read (synthesis: 6.16/0.82) [marsac2009 R6]. The two experimental routes differ by up to 1.01 and rank the compounds differently [marsac2009 X7]. The positive values for non-depressing pairs are lower limits [marsac2009 C19, X11]. The nifedipine volume fractions of the 2006 fit may use felodipine's density [marsac2006b X2]. A χ determined near the drug melting point is applied at storage temperature without correction [marsac2006b C32]. The χ of one pair differs between studies (indomethacin–PVPVA −1.97 against −0.64 to −4.5) [moseson2018 R4, R7]. The positive mixing enthalpy of dextran–PVP is inferred from the existence of phase separation, not measured [vaneerdenbrugh2012a C32, X7]. In the extrusion work a single \chi neglects temperature and composition dependence [moseson2018 C18]. Differences between studies "can be attributed" to sample preparation, DSC method or onset versus offset [moseson2018 C21]; the nature of the fit (with or without intercept) also shifts the value [moseson2018 X7]. For ritonavir–PVPVA the main text and the SI disagree on χ, and the basis of the other χ values (vapour sorption or solubility, room temperature or 37 °C) is described differently in the two; the DVS and solubility data are not shown li2020 X10, X11. For posaconazole–HPMCAS χ is a slope with a free intercept, and Tc below 40% PCZ are extrapolations from it shah2024 R4, X7, X8. Two values cited in the physical-stability papers for the same pair differ by an order of magnitude: −3.8 and −4.2 (melting onset route, used in 2006) against −0.8 and 0.0 (offset route, used in 2009) for nifedipine–PVP, which reflects the choice of melting-peak point (synthesis; see the onset, midpoint and offset values above) [marsac2006a R18; rumondor2009c R26]. The drug–water χ split rests on approximated densities and a gap of 0.13 [rumondor2009c X4]. No χ was computed in the 2010 polymer comparison: \chi_{DP} is ranked by red shift and \chi_{WD} by calculated log P rumondor2010c X13. In the dispersion-dissolution argument, with 90% polymer, fewer drug–drug contacts "would lead to a reduction in the barrier" to dissolution, an argument without χ values alonzo2011 C43. The "ideal" line of the lopinavir figure is proportional dilution, not χ = 0 of the equation li2018 X2. No χ values were measured or cited for the ritonavir systems purohit2017b E4.

← Concepts and formulas

concept · as used in Dissolution

Flory-Huggins theory

Lattice solution theory for a small molecule and a polymer, used here with the amorphous drug treated as the solvent and one lattice site set equal to the molecular volume of the drug (or, in the 2009 paper, of a liquid analogue of PVP) [marsac2006b C9, E1; marsac2009 P6]. For a large and a small molecule the free energy of mixing is better written in volume fractions than in mole fractions, because the large molecule has far fewer configurations; the first terms of the expression are the entropy of mixing and the last carries the interaction parameter χ [marsac2006b C7, E1]. The authors call it "still considered" an excellent starting point despite documented limits and more advanced models [marsac2006b C8]. In the library the same lattice picture gives four quantities: the free energy of mixing and miscibility, the melting point depression, the activity coefficient of the drug and the solubility of the crystal in the polymer [marsac2006b E1, E3, E6; marsac2009 E2, E8, E10]. Two later uses: for two polymers the chain lengths enter through the lattice sites per chain, N_1 and N_2, in the combinatorial term [vaneerdenbrugh2012a E5, C31]; and for itraconazole–HPMC the equation is used in words to say that, without hydrogen-bond donors, any miscibility is entropy-driven [purohit2015a E1, C41, C42]. New aspect (ASD process): written for a small molecule and a polymer as \Delta G=RT[\phi\ln\phi+\frac{1-\phi}{m}\ln(1-\phi)+\chi\phi(1-\phi)], with the two entropy terms always favouring mixing and the \chi term carrying the enthalpy [moseson2018 E1; purohit2015a C41]. In the hot-melt extrusion papers it is used through the melting point depression relation to build the solubility line for HME [moseson2018 E2]. It was extended to four components in the drying model of a spray droplet, with volume fractions of methanol, water, ritonavir and PVPVA and six pairwise χ values, to locate the drug solubility along the drying path li2020 P12, E11. New aspect (Physical stability): extended to the ternary water–drug–polymer system, where separation requires the interaction terms to outweigh the entropy of mixing, and to water sorption of blends, where the drug–polymer term is too small to be fitted [rumondor2009c E4, C42; rumondor2010a C25].

Findings

Miscibility and drug-polymer interactions: F5, F6, F7, F8, F9, F18, F22. ASD process: F8, F20. Physical stability: F4, F8, F13, F23, F29.

Related concepts

gives Flory-Huggins interaction parameter, entropy of mixing, combinatorial entropy of mixing, free energy of mixing and activity coefficient; used for drug-polymer miscibility and drug solubility in polymer. Predicts melting point depression. Explains Δχ effect and moisture-induced phase separation.

Formulas

Flory-Huggins free energy of mixing, Flory-Huggins melting point depression, Flory-Huggins activity equation, Gibbs free energy of mixing, Flory-Huggins combinatorial entropy of mixing. Four-component form: multicomponent Flory–Huggins free energy of mixing. Water sorption: Flory-Huggins water sorption isotherm, ternary Flory-Huggins water sorption isotherm.

How it is measured or obtained

It is a model; its inputs are densities (helium pycnometry or cited), molecular volumes (molecular weight over density), heats of fusion and melting points from DSC, and χ from experiment [marsac2006b P4, P5, P6; marsac2009 P6, P7, P8]. Outside the binary case, a ternary water–drug–polymer form is used to discuss moisture rumondor2010c E1, C26. In the extrusion work χ is fitted to melting point depression data (see Flory–Huggins interaction parameter); the free energy itself is not evaluated there [moseson2018 E1, E4]. In the moisture papers the ternary free energy of mixing is used in words, and binary, ternary and pseudobinary sorption equations are fitted to isotherms [rumondor2009c E4; rumondor2010a E1, E2, E4].

Values in the library
materialvalue or classconditionspaper ids
nifedipine with PVP K12, K29/32, K90entropy minimum near Φ ≈ 0.6, against ≈ 0.44 with methyl pyrrolidoneχ = 0[marsac2006b R1]
nifedipine–PVP K29/32miscible over the whole range for χ ≲ 0.6; single deep minimum at χ −3.8, −4.2five χ values[marsac2006b R2, R3]
five compounds with PVPΔG/RT minima at polymer fractions ≈ 0.5–0.6; indomethacin deepestmelting-route and solubility-route χ[marsac2009 R10]
nifedipine, felodipine in PVPlittle activity lowering below polymer volume fraction ≈ 0.5χ from melting depression[konno2006 R20, C35; marsac2006a R19]
indomethacin–PVPVAχ −1.97 from the linearized melting relation; one χ describes Tc from 50 to 90% DL (HME phase diagram)offset extrapolated to 0 °C/min[moseson2018 R4, C19]
dextran–PVP, 20 pairscombinatorial entropy per site from about −27 × 10⁻²³ J (783 Da maltodextrin, PVP K 12) to about 0 (450 kDa dextran, PVP K 90)25 °C, no enthalpic term[vaneerdenbrugh2012a R15, E5]
itraconazole–HPMCentropy-driven miscibility, limited at room temperature (UCST-type); no χ measuredargument in words[purohit2015a C42, C47, E1]
ternary water–drug–polymer systemswater lowers the free energy entropically; large positive \chi_{WD} favours drug-rich separationstored ASDspurohit2017b C43
drug in polymer, melting point depression and activityfree energy of mixing and melting point depression from Flory–Hugginsfelodipine, nifedipine with PVP[marsac2006b E1, E3; marsac2006a E10]
ritonavir–PVPVA–methanol–waterthe computed solubility boundary is crossed from about 12.5:87.5 initial water:methanol at 25% DLfour-component modelli2020 R17, C50
indomethacin–PVP, felodipine–PVPdrug–polymer term 0.029–0.160% of the ternary adjustment25 °C sorption[rumondor2010a R13]
felodipine–PVP, indomethacin–PVPfitted χ23 −9.6 to 26.9 and −20.4 to 22.0same[rumondor2010a R14]
four blend seriesmean water–blend χ1,23 falls with polymer contentsame[rumondor2010a R15]
felodipine, quinidine, pimozide, indomethacin with PVP, PVPVA, HPMCASternary free energy of mixing used to explain why less hygroscopic polymers separate lessqualitativerumondor2010c E1, C26, C31, C39
indomethacin–polymer meltsfree energy of mixing used to argue a lower driving force with stronger interactiongrowth, 80–135 °C[tian2017 E2, C30, C31]

Evidence table: Flory-Huggins theory.

Pitfalls and disagreements

The glasses are non-equilibrium, χ is assumed independent of composition and temperature, and the critical χ for miscibility depends on how the lattice is defined and is system specific [marsac2006b C3, C18; marsac2009 P8]. The melting relation is linear only at low polymer content, so the fitted χ is a composite [marsac2009 C7]. The entropy curves exist for nifedipine only and carry no ordinate scale [marsac2006b X7, X8]. The hydrogen-bond picture cannot be represented by solubility parameters inside the theory [marsac2006b C24]. The ternary form fitted to moisture sorption gave ambiguous χ values [rumondor2010a C30]. The comparison of the 20 dextran–PVP pairs rests on a χ that is independent of molecular weight, which was assumed and not measured, and two of the 20 plotted entropy curves do not follow from the stated inputs [vaneerdenbrugh2012a C33, X1]. For itraconazole–HPMC no χ, n or φ was given [purohit2015a E1]. In the extrusion work the theory neglects the temperature and composition dependence of \chi and treats the polymer as a chain on a lattice; for IDM–PVPVA a single \chi fits 50–90% DL but not 40% DL, where viscosity hindered the measurement [moseson2018 R4, C18, C17]. The printed SI equation of the four-component model lacks the operator joining the combinatorial and χ sums and leaves the chain length undefined, so it is not directly implementable li2020 X15. The ternary sorption model assumes that binary interactions carry over unchanged into the blend, which the authors consider "unlikely" [rumondor2010a C26, C27]. χ in the ternary free energy also holds non-ideal entropy, so a positive χ term need not be enthalpic [rumondor2009c X14]. In the three-polymer moisture study it is applied without parameter values, and the data do not separate the thermodynamic from the mobility reading rumondor2010c X13, X12.

← Concepts and formulas

concept · as used in Dissolution

fragility

How steeply molecular mobility or viscosity changes as a liquid approaches Tg: strong liquids follow Arrhenius behaviour, fragile ones depart from it [baird2012 C37]. It is expressed by the fragility index m (strong below 40, fragile above 75) or by the VTF strength parameter D (strong above 30, fragile below 10) [baird2010 R30]. Good glass formers were expected to be strong liquids [baird2010 C3].

Findings

F5, F12.

Related concepts

measured by melt viscosity; depends on glass transition temperature; proposed predictor of glass-forming ability; related to reduced glass transition temperature.

Formulas

Vogel-Tammann-Fulcher equation.

How it is measured or obtained

m from the heating- and cooling-rate dependence of Tg (Moynihan) and D from m, or D from the VTF equation with T0 set to the Kauzmann temperature [baird2010 P10, E14, E15, E18]; D also by fitting the VTF equation to melt viscosity [baird2012 P5, E4].

Values in the library
materialvalue or classconditionspaper ids
tolazamidem 18DSC rate dependence[baird2010 R18.k]
itraconazolem 731DSC rate dependence[baird2010 R18.r]
nifedipinem 33, D 36 from m, D 9 from VTF with TKDSC[baird2010 R18.i]
28 compounds of classes I-B to IIID 4.3–8.7VTF fit of melt viscosity[baird2012 R12]
Pitfalls and disagreements

The category depends on the estimate used: aceclofenac, tolazamide and nifedipine are strong by m but fragile by the VTF-based D [baird2010 X14]. Fitted T0 values do not satisfy the paper's own T0–D–Tg relation [baird2012 X5]. Fragility did not separate good from poor glass formers [baird2012 C43], and invoking it for outliers in growth data is untested [trasi2014a X18].

← Concepts and formulas

concept · as used in Dissolution

free drug concentration

The concentration of molecularly dissolved drug that can cross a membrane, as against drug in micelles, complexes, droplets or aggregates [raina2015c C30, C49; alhalaweh2016 C1]. In rat studies of enzalutamide the free drug is inferred from flux: the cellulose acetate suberate dispersion gave free drug like the crystalline form, matching their equal exposure (F24, F25) [wilson2020 C10, C40]. In micellar media the buffer solubility is taken as the free drug and the excess as micelle-associated elkhabaz2019b C26, C31. New aspect (Supersaturation from ASD dissolution): the free drug concentration, not the total, sets the supersaturation that drives crystallization and membrane transport (cited), and it stops at the amorphous solubility once a drug-rich phase forms jackson2015 C26, C31. Flux separated free from complexed resveratrol: more HPMCAS dispersion gave more total but less free drug, free resveratrol being at most about twice saturation wegiel2015 C19, C41; six tacrolimus products reached the free-drug maximum of the pure drug trasi2016 C38.

Findings

Bioperformance: F3, F6, F7, F15, F18, F24, F25. Supersaturation from ASD dissolution: F7, F8, F11, F17.

Related concepts

equals thermodynamic activity in effect; lowered by micellar solubilization; related to additive cases for amorphous solubility, speciation, micelle-water partition coefficient; measured by membrane flux; capped by amorphous solubility.

Formulas

activity from concentration, supersaturation from membrane flux ratio, membrane flux in terms of solute activity, activity-based supersaturation ratio, ideal-mixing reduction of amorphous solubility.

How it is measured or obtained

Supernatant after ultracentrifugation [alhalaweh2016 P10]; flux against a reference [raina2015c E9]; fluorescence or filtration are less reliable above the amorphous solubility [hate2018 X15]. In the ASD dissolution papers: by flux across a membrane against a standard curve jackson2015 P4, by flux relative to the crystal alonzo2011 P4, by solution NMR alonzo2011 P7, and by ultracentrifugation trasi2015b P9.

Values in the library
materialvalue or classconditionspaper ids
ritonavir, atazanavir (PVP ASD)4.3–4.75 × 10⁻⁵ M and 1.38–1.54 × 10⁻⁴ M alone; falls linearly with mole fractionpH 6.8[alhalaweh2016 R12]
atazanavir + SDSabout 65 µg/mL at the amorphous solubility whatever the SDS level37 °Cindulkar2017a R11, C19
ritonavir, lopinavir HPMCAS and PVP dispersionsRTV-PVP maximum about 22 µg/mL even after 2 hultracentrifugedtrasi2015b R12, R13
resveratrol–HPMCASat most about twice saturation; enhancement from a soluble complexwegiel2015 C41
telaprevir + CA Subnot measured; flux 0.91 µg/min with the predissolved polymer[mosqueragiraldo2018b R13]
enzalutamideabout 42 µg/mL molecularly dissolved of 70 µg/mL added; the rest colloidal amorphous aggregatespH 6.5 buffer[wilson2020 R2; wilson2018 R10]
posaconazole, atazanavirfree concentration at either solid phase taken as the buffer value in every mediumsix media, 37 °Celkhabaz2019b C26, C27, C31
danazol dispersions with a drug-rich phase7.1–9.1 µg/mL (amorphous solubility 8)flux, 25 °Cjackson2015 R9
danazol 50:50 HPMCAS (no drug-rich phase)5.4 ± 0.8 µg/mLflux, 25 °Cjackson2015 R9
ritonavir + lopinavir drug-rich phasesRTV 14.2–15.8, LPV 7.0–7.5 µg/mL for 5 hultracentrifugedtrasi2015b R16
felodipine 90:10 and 50:50 HPMC dispersionsflux ratios 10.5 and 9.5 to the crystal37 °Calonzo2011 R14
resveratrol–HPMCAS 15:85, 6–35 mg/mLtotal ≈530 → ≈1610 µg/mL while flux ≈4.4 → ≈2.6 µg/min (crystal 2.0)pH 6.8, 37 °Cwegiel2015 R19, R20
six tacrolimus products0.0048–0.0054 µg/min against a pure-drug plateau of ≈0.0050–0.0055pH 4.5, 37 °Ctrasi2016 R15, R14
Pitfalls and disagreements

Free drug was not measured in the donor in the hollow-fibre studies, so statements that it equals the amorphous solubility are assumptions [hate2018 X11]. Equating the buffer solubility with the free drug assumes that bile salts and lecithin do not mix into the drug phases, which the small fall of the posaconazole flux ratio questions (F18) elkhabaz2019b C31, C44. Ueda 2024 (p. 39) gives the general form: the buffer value equals the free drug only in Case I, and in Case III the free drug at the limit falls. In the ASD dissolution papers in situ UV and 0.45 µm filtrates count droplets or particles as dissolved alonzo2011 C27; trasi2015b C22. The danazol standard curve does not pass through zero, so flux cannot be converted to concentration by proportion jackson2015 X5. The inverse link of flux and concentration for resveratrol holds only up to about 18.8 mg/mL loading wegiel2015 X9.

← Concepts and formulas

concept · as used in Dissolution

free energy of mixing

The free energy change on mixing drug and polymer, ΔGmix = ΔHmix − TΔSmix: a negative ΔGmix with one minimum versus composition means complete miscibility, a positive ΔGmix complete immiscibility, and two minima (the binodal points) with a metastable region between them and an unstable region bounded by the spinodal points partial miscibility; this liquid-mixture theory is extended by the authors to amorphous solids [rumondor2009a C35]. In Flory–Huggins form the first terms are the entropy of mixing, small for a polymer, and the last the interaction term χ [marsac2006b E1, C10]. Large positive χ gives a positive ΔGmix and immiscibility, small χ a negative ΔGmix with one minimum [marsac2006b C17]. In the dextran–PVP paper ΔGmix = ΔHmix − TΔSmix is used to argue that a blend mixes only when the combinatorial entropy outweighs a positive enthalpy [vaneerdenbrugh2012a E3, C32]; the itraconazole–HPMC paper writes the Flory–Huggins form for the same argument [purohit2015a E1, C41].

Findings

F5, F6, F3, F18, F22.

Related concepts

made of enthalpy of mixing and entropy of mixing; gives drug-polymer miscibility; part of Flory-Huggins theory.

Formulas

Flory-Huggins free energy of mixing, Gibbs free energy of mixing.

How it is measured or obtained

By calculation from χ, volume fractions and molecular volumes (Eq. 1 of the 2006 paper, Eq. 10 of the 2009 paper); no calorimetric ΔGmix is measured in these papers [marsac2006b E1, R2; marsac2009 E10, R10]. The curves in the two papers carry no numbers on the vertical axis, so depths can be compared only within a panel [marsac2006b X7; marsac2009 X12].

Values in the library
materialvalue or classconditionspaper ids
nifedipine–PVP K29/32positive at χ = 2.0 (maximum near Φ ≈ 0.37); shallow at 0.5 and 1.0; single deep minimum near Φ ≈ 0.54 at −3.8, −4.2Flory–Huggins[marsac2006b R2]
indomethacin–PVPminimum ≈2.4 times (melting χ) and ≈5 times (solubility χ) as deep as the athermal minimumΦ_polymer ≈ 0.5–0.6[marsac2009 R10]
felodipine, ketoconazole with PVPthree curves (athermal, melting χ, solubility χ) nearly coincideas above[marsac2009 R10]
sucrose–dextranmelting-route curve above the athermal curve (χ = 0.20)as above[marsac2009 R10]
Pitfalls and disagreements

The condition "the binodal points are the two minima" (first derivative zero) coincides with the common-tangent binodal only for a symmetric curve like the schematic in the paper; the authors apply it to no data [rumondor2009a E6, X15]. Curves for the immiscible pairs are not drawn, because their enthalpy of mixing cannot be accessed [marsac2009 C31]. The temperature and the PVP grade of the 2009 curves are not stated [marsac2009 X12].

← Concepts and formulas

concept · as used in Dissolution

gastric pH variability

Evidence table: gastric pH variability. Content from the ASD dissolution chapter (delamanid 2023, praziquantel 2024–2025) and the Release mechanism and LoC chapter.

The spread of stomach pH between and within patients, from about 1.6 fasted to 5 or above after a meal, and with age or acid-reducing drugs, which changes how much drug and polymer dissolve during the gastric stage of a dispersion and how long the dispersion sits wetted before the pH rises nguyen2023c C5, C57. In vitro tests are usually standardized at one gastric pH and so do not see it nguyen2023c C5. Food also prolongs gastric residence, cited as 15–60 min fasted and 2–5 h fed, with a gastric pH of 6–6.5 about 30 min after a meal nguyen2023b R22, C19.

Findings

F25, F27, F24.

Related concepts

acts through pH-dependent polymer solubility and pH-dependent solubility of weak bases; risk of surface crystallization; mitigated by an enteric polymer coat; read with food effect.

Formulas

none.

How it is measured or obtained

By repeating a two-stage test with the gastric stage set at several pH values (pH 1.6, 3.0 and 5.0, or FaSSGF and a fed gastric medium) and the same intestinal stage, so that only the gastric pH changes nguyen2023c P8; alvarenga2025 P10, P11, P12; by soaking a coated tablet across the same range to find where the coat fails nguyen2023b P6.

Values in the library
materialvalue or classconditionspaper ids
delamanid salt dispersions, five enteric gradesfinal release ≈101 / ≈41 / ≈82% (HPMCP-50), ≈94.5 / ≈80.5 / ≈12.5% (HPMCP-55), down to ≈18 / ≈1 / ≈0% (HPMCAS-HF)60 min at pH 1.6 / 3.0 / 5.0 → pH 6.5nguyen2023c R11
delamanid free base with HPMCP-50≈62.5 / ≈33.5 / ≈6.5 µg/mL of 100the samenguyen2023c R7
uncoated delamanid–HPMCP-50 tablets, three drug forms≈0.3–93 µg/mL after the shift against ≈82–96 µg/mL in a single stagethe samenguyen2023b R2, R1
coated delamanid tablets, three drug forms≈76–86 µg/mL after every gastric pH, a spread of about 4–8 µg/mL within a formthe same, transfer to fresh mediumnguyen2023b R10
praziquantel–HPMCAS dispersions, 0.667 mg/mL≈92–103% after pH 1.6 or FaSSGF against ≈62–77% after pH 3.0 or 5.01 h gastric stage → pH 6.5alvarenga2025 R7, R10, R13
bedaquiline–HPMCAS 5/95 dispersions (Release mechanism and LoC)≈19.5–25 µg/mL of 100 at 120 min from all three gastric pH values60 min at pH 1.6 / 3.0 / 5.0 → pH 6.5kaur2025 R12
Pitfalls and disagreements

The worst gastric pH is not the lowest and differs by drug form: pH 3.0 for the delamanid edisylate tablet and pH 5.0 for the free base and the chloride nguyen2023b X5. A neutral drug is not exempt: praziquantel, neutral above about pH 3, still recovered less after pH 3.0 and 5.0 starts, which the paper does not explain alvarenga2025 R4, R10. The gastric supersaturation reached does not order the final release nguyen2023c C39. All of these tests used one 60-min gastric stage and simple media without food components nguyen2023c X8.

← Concepts and formulas

concept · as used in Dissolution

gel layer

The swollen, porous, polymer- and water-rich layer that forms at a hydrating ASD surface, below any drug-enriched outer layer, and from which the polymer disentangles into the medium. For 30% bicalutamide–PVPVA compacts it has the starting composition (F/F0 of drug 0.93 ± 0.06) [moseson2022b R15]; in ritonavir–PVPVA tablet edges it is the green (polymer- and water-rich) phase that carries drug-rich droplets and moves into solution as the polymer disentangles benson2025 R14, R16. (synthesis: release is polymer-controlled while the gel layer lasts and drug-controlled once the polymer has gone and drug-rich material is left; see polymer-controlled release.) New aspect (Release mechanism and LoC): the release-mechanism papers of 2020–2022 place the switch between polymer- and drug-controlled release inside this layer. A glassy polymer dissolves by solvent ingress, swelling, plasticization and gel-layer formation, chain disentanglement and diffusion of the free chains (cited); above its Tg the polymer forms a gel layer, while below it the layer thins and dissolution changes from disentanglement to cracking (cited) correasoto2022b C33; saboo2020 C54. For dispersions the polymer rate "is expected to depend" on the water absorbed to form the gel layer, which falls with drug loading, and on the Tg of the hydrated matrix against the test temperature saboo2020 C55. Saboo and co-workers (2021) propose a transient gel layer in which water plasticizes the chains before they disentangle, and in which the shape of the drug-rich phase formed by phase separation largely decides between drug- and polymer-controlled release at high loading saboo2021 C37. Hiew and Taylor (2022) argue that drug and polymer that separate in the gel layer should still both leave at the neat-polymer normalized rate as long as the separated drug cannot form a continuous barrier layer hiew2022b C46. For the enteric polymer HP-50 the gel is tied to ionization: less hydration at lower ionization at the dissolving surface, with the solvent fraction of the gel setting the disentanglement rate (cited); the pre-ionized salts are said to hydrate faster and more and so give a more mobile gel layer qi2022 C30, C42. The gel forms when water plasticizes the polymer chains into a rubbery state, which greatly lowers the Tg of the matrix (cited); ritonavir–PVPVA compacts of 10–40% all formed a gel layer with a sharp boundary to the glassy core yang2022a C23, C42. HPMCAS-MF formed a gel layer only above a buffer capacity of 13 mM/ΔpH, thickening with buffer capacity, and its gel had a lower apparent pH than the bulk bapat2023 C27, C28. A gel layer formed on every PVPVA compact of two phenolphthalein analogues, which suggests the dispersions may dissolve by a mechanism similar to that of neat polymers deac2023a C44. The 2024 PVP paper places droplet release at the gel–solution boundary, where the viscosity of overlapping and, above the entanglement weight, entangled chains falls enough for the polymer to leave deac2024a C32, C33, C34. The 2024 phase-diagram paper draws the gel layer as a region of the drug–polymer–water diagram between the glass–gel boundary (water content at which Tg = 37 °C) and the gel–solution boundary (from the measured average water and a linear gradient), and finds the MePHPH miscibility gap covering most of it deac2024b C36, E4, R28.

Findings

ASD process: F27, F38, F48. Release mechanism and LoC: F15, F20, F23, F24, F25, F29, F30, F31.

Related concepts

lies under the drug-rich surface layer; controls polymer-controlled release; ends at the limit of congruency; delayed by a coating defect density that is too low. The site of polymer chain disentanglement; formed by plasticization by water; the place where phase separation morphology decides the release regime; can turn into a drug-rich barrier layer.

Formulas

none.

How it is measured or obtained

SEM-EDX of cross-sections of compacts exposed face down (fluorine of the drug as F/F0) and confocal fluorescence with a drug-rich dye (Nile red) and a polymer- and water-rich dye (Alexa Fluor 488); confocal imaging of the hydrating edge of 100 mg tablets at 37 °C [moseson2022b P14, P15, P16, P17; benson2025 P5, P13]. In the release-mechanism papers: not characterized directly in these papers; inferred from release rates, from micro-CT of tablets after 10 min of dissolution and from films exposed to about 100% RH, whose contiguous drug-rich network "likely also forms" in the transient gel layer saboo2021 C39, R19, R21. Thickness of the gel in confocal cross-sections of surfactant-containing compacts after 5–20 min (ImageJ, unit not printed) yang2023 P9, R15, X8; position of the glass–gel and gel–solution boundaries on the ternary diagram deac2024b R26, R27.

Values in the library
materialvalue or classconditionspaper ids
30% BCL–PVPVA compact, 1 hporous gel layer F/F0 0.93 ± 0.06 under a 94 ± 8 µm drug-rich layerSEM-EDX[moseson2022b R15]
same, confocalgel layer 440 ± 6 µm; compact swelled from 2092 ± 24 to 2696 ± 50 µm in 60 minNile red, Alexa Fluor 488[moseson2022b R16, R17]
50% BCL–PVPVA compactno gel layer distinguished; swelled from 1988 ± 11 to 2441 ± 12 µmsame[moseson2022b R17]
uncoated ritonavir–PVPVA tablet edgesmall discrete red droplets throughout a green gel layer that moves into solutionconfocal, 37 °Cbenson2025 R14, R16
coated ritonavir–PVPVA tablet edgegreen and red networks along particle boundaries within 2 min; connected red regions remain outside the receding tablet at 4 minsamebenson2025 R14, R16
felodipine–PVPVA 30% with 0, 2% TPGS; 5, 10% TPGSporous surface layer with voids at the dissolution front; homogeneous sectionmicro-CT after 10 minsaboo2021 R19
PVPVAat least 11% water to start chain disentanglement at 37 °Cestimatedhiew2022b R21
ritonavir–PVPVA 10–40%gel layer with a sharp boundary to the glassy core at every loading; no grain boundaries in the gelconfocal cross-sections, pH 6.8yang2022a R7, C42
ritonavir–PVPVA 0–20%; 30%, 40%gel–glass front through ≈100% of the compact at 20 min; ≈29 and 17% with a plateaureal-time imagingyang2022a R8
neat HPMCAS-MF in pH 6.8 phosphate 5; 13; 51 mM/ΔpHno gel; 3 ± 1 µm; 19 ± 5 µmconfocal with prodan, 60 minbapat2023 R14
neat HPMCAS-MF gel, pH 6.8 phosphate 13–51 mM/ΔpHapparent pH 5.6–6.2gel scraped after the rotating-disk testbapat2023 R15
MePHPH–PVPVA 5–50%; PHPH–PVPVA 5–20%gel layer on every compact; 5% PHPH gel 356 ± 18 µmgravimetric and cross-sectional, steady statedeac2023a R4, C44, C31
ritonavir–PVPVA + Tween 80, 30%≈147.6 → 279.6 (5 → 20 min)confocal cross-sections, unit not printedyang2023 R15, X8
ritonavir–PVPVA + Span 20, 40%≈90.7 → 50.7 (5 → 20 min)sameyang2023 R15
neat PVPVA; 5% PHPH; 5 and 20% MePHPHgel–solution boundary from a linear water gradientternary diagram, 37 °Cdeac2024b R27, E4
Pitfalls and disagreements

Layer thicknesses come from compacts, whereas the authors say polymer loss is much faster from particles than from compacts [moseson2022b C39, X20]. Dye assignments and the polymer-depleted state of the crust are inferred [moseson2022b X16]. The confocal tablet images come from a different compaction and size than the release tablets, and the large red blobs of the uncoated row at 2–3 min are a mounting artefact benson2025 X5, R15, C29. That croscarmellose and starch glycolate raise the viscosity of the PVPVA gel is a speculation benson2025 C50. Hydrophilic surfactants "would reasonably be expected" to draw more water into the gel–water interface and so speed polymer dissolution, an argument without data correasoto2022b C42. Yang and co-workers read thickness as the balance of water penetration and disentanglement, but water ingress was not measured on the compacts yang2023 C26, C27. The gel-layer region of the 2024 diagrams rests on a fitted water Tg and on gel water contents cited from 2023 deac2024b X11, R40.

← Concepts and formulas

concept · as used in Dissolution

Gibbs-Duhem equation

The relation between the changes of chemical potential of the components of a mixture; integrated with the measured water activity against composition from a sorption isotherm, it gives the activity of the drug in the water-saturated amorphous phase, the term e^{-I(a_2)} of the amorphous solubility estimate (the Murdande method) almeidaesousa2015 E16, P7; ilevbare2013a P2. In the solution-crystallization papers the factor lowers the Hoffman estimate of the amorphous solubility, and I(a2) is the sum of a Henry's-law term from zero water to the limit of linearity and a numerical integral \sum \langle (n_1/n_2)(1/a_1)\rangle\,\Delta a_1 over the sorption isotherm up to unit water activity hsieh2012 E5, E6, P13; ilevbare2013c E6.

Findings

Amorphous solubility and LLPS: F5. Crystallization from solution: F2, F21.

Related concepts

yields the water sorption correction of amorphous solubility; input is water sorption; related to thermodynamic activity; corrects the Hoffman equation; used for the amorphous solubility advantage.

Formulas

Gibbs-Duhem equation, amorphous solubility advantage with water-sorption correction.

How it is measured or obtained

Numerical integration of moles of water per mole of drug against 1/a_1 over the sorption isotherm hsieh2012 E5. The papers of this chapter only name the method. The crystallization-from-solution papers measured the isotherm by dynamic vapour sorption of the amorphous solid at the test temperature (37 °C, 5–95% RH in 10% steps, three samples; 25 °C for danazol), with the water content extrapolated to water activity 1 hsieh2012 P8, P13; jackson2014 P3, P4.

Values in the library

The resulting factors are listed under water sorption correction of amorphous solubility ilevbare2013a M1; almeidaesousa2015 M6. Values printed in the crystallization-from-solution papers:

materialvalue or classconditionspaper ids
danazol\exp[-I(a_2)] = 0.935DVS 5–95% RH, 25 °Cjackson2014 E1, R2
five weak baseswater correction lowers the estimate for every base, for ketoconazole from 202 to 56.6 µg/mLDVS, 37 °Chsieh2012 R10.d
ritonavir, efavirenz, celecoxibI(a2) values not printed; theoretical amorphous solubilities 20.6, 19.8, 22.6 µg/mL37 °Cilevbare2012b E8; ilevbare2013c E6, R2
six dihydropyridinese^(−I(a2)) 0.74–0.91moisture sorption, TA Q5000raina2015b M1–M6
Pitfalls and disagreements

The expression is not printed in the 2015 and 2016 papers (named only) and the integral is not shown in any paper of 2013–2016 almeidaesousa2015 E16; almeidaesousa2016 E4. The sorption isotherms, the values of I(a2) and the preparation of the amorphous samples are not printed in the 2012 paper, so the estimates cannot be recomputed hsieh2012 X14. The amorphous solids for sorption (melt-quenched) and for dissolution (solvent-evaporated) differ in preparation ilevbare2013c X17. The sorption conditions and water contents are not printed raina2015b P3.

← Concepts and formulas

concept · as used in Dissolution

glass–liquid phase separation

Phase separation of a supersaturated solution into a water-rich phase and a drug-rich phase that is a glass at the test temperature, because its water-plasticized Tg lies above that temperature; the term was judged "more appropriate" than LLPS for atazanavir (Tg of the precipitate about 51 °C at 37 °C) indulkar2015 C38. It is the title phenomenon for telaprevir (pellet Tg 52 °C) mosqueragiraldo2015 C13, C21. Griseofulvin and sorafenib were also treated as GLPS drugs almeidaesousa2015 C40. The papers of 2017–2022 add pazopanib: the colloids formed after a pH shift were called glass–liquid phase separation from a Tg of about 83 °C measured on the dried precipitate sugihara2018 R17, C27, C28, and telaprevir with bile salts (GLPS onset 146–149 µg/mL in buffer) lu2017b R2. New aspect (Bioperformance): telaprevir with a dry Tg of 103 °C and a wet precipitate Tg of 52 °C [mosqueragiraldo2018b M1, C8]; enzalutamide, whose water-saturated amorphous Tg by Fox estimate lies above 37 °C, forms a glassy precipitate, and its colloidal aggregates are called products of GLPS [wilson2018 R4, C7, C14]. New aspect (Crystallization from solution): telaprevir above its amorphous solubility (about 90–100 µg/mL) separates into glassy drug-rich particles of 200–400 nm, which the authors think may provide interfaces for nucleation; in solutions that contain them the apparent concentration drops twice, the first drop being assigned to the aggregates mosqueragiraldo2016 R1, R3, C7, C11; lu2017 R12.

Findings

Amorphous solubility and LLPS: F2, F7, F5, F4, F17, F23. Bioperformance: F1, F7, F23. Crystallization from solution: F25, F32, F37, F43.

Related concepts

special case of liquid-liquid phase separation; depends on plasticization by water and structural relaxation; contrasts with supercooled liquid; gives a drug-rich phase; related to heterogeneous nucleation (the glassy particles as possible nucleation interfaces).

Formulas

amorphous-crystalline free energy difference from heat capacity.

How it is measured or obtained

As LLPS (extinction, probe, NMR, flux), with the glassy state read from the Tg of the isolated phase, from storage at high humidity, or from the free-energy match (F2) mosqueragiraldo2015 P4; indulkar2015 P16; almeidaesousa2015 P8. The GLPS concentration of telaprevir is about 90–100 µg/mL [mosqueragiraldo2018b M1, R1, R2]. Cryo-SEM of a 150 µg/mL solution and the double fall of the 270 nm signal; zeta potential of droplets formed at 180 µg/mL mosqueragiraldo2016 R2, R3; lu2017 R8.

Values in the library
materialvalue or classconditionspaper ids
telaprevir phaseTg 52 °C (dry 103 °C); redissolves in about 2 min on dilutionpH 6.8, 37 °Cmosqueragiraldo2015 R2, R8
atazanavir phaseTg about 51 °C (dry 104 °C)water, 37 °Cindulkar2015 R22
griseofulvin; sorafenibwet Tg 88 and 49 °C at 97% RH; onset matches the supercooled-liquid estimate25 °Calmeidaesousa2015 R9, R5, R6, R11
pazopanib precipitateTg about 83 °C (dried); wet Tg not measuredpH 6.5, 37 °Csugihara2018 R17, X5
telaprevironset 146–149 (buffer), 311–360 (12 mM STDC, SGDC), 238–290 µg/mL (12 mM STCDC)50 mM pH 6.5, 37 °Clu2017b R2
telaprevironset 92 ± 2 µg/mL; precipitate Tg 52 °CpH 6.8, 37 °Cmosqueragiraldo2015 R4, C13
telaprevir, bile salts149 / 146 µg/mL (pH 6.5, 50 mM); 104 / 102 µg/mL (pH 6.8, 100 mM)ultracentrifugation / UVlu2017b R9
enzalutamideonset about 42.5 µg/mL; amorphous precipitate glassy under cross-polarized lightpH 6.5, 37 °C[wilson2018 R2, R4]
telaprevir 150 µg/mL, no polymerconcentration about 162 → 100 µg/mL by about 12 min, then a steep fall at 15–25 minpH 6.8, 37 °Cmosqueragiraldo2016 R3
telaprevir δ 28.8, 1.86 mM bile saltinduction time SGDC >960, STDC 550, STC 60, SGC 30 minpH 6.5, 37 °Clu2017 R4
telaprevir at δ 28.8 with 150 µg/mL HPMCAS-MFturbid in all media (glassy drug-rich phase)five media, 37 °Clu2018 R8, C35
enzalutamide above 42 µg/mLglassy droplets of about 100–200 nm; agglomeration without polymer "most likely"pH 6.5wilson2021 R11, C29
Pitfalls and disagreements

The glassy phase behaves like a liquid one in onset, probe uptake and redissolution; the phase was never isolated for griseofulvin and sorafenib, and "relaxed" is inferred almeidaesousa2015 C37, C38; mosqueragiraldo2015 C30. The state depends on temperature: loratadine droplets are glassy at 5 °C and liquid at 37 °C yang2021 C16. The glassy state of the pazopanib phase rests on a dry Tg; with a water uptake of about 4.6% the rule of about 10 °C per 1% would bring 83 °C close to 37 °C (synthesis) sugihara2018 X5; ilevbare2013a E15; mosqueragiraldo2015 M1. The onset of telaprevir depends on buffer strength and pH lu2017b R9. Neither HPMCAS dispersion of enzalutamide showed GLPS: the 10% one crystallized and the 50% one did not dissolve above the ceiling (F23) [wilson2018 C23]. For telaprevir the dihydroxy bile salts STCDC and SGCDC cap the activity at δ 21–24, so they could not be tested at δ 28.8 lu2017 R1.

← Concepts and formulas

concept · as used in Dissolution

glass transition temperature

The temperature that separates the glass from the supercooled liquid [lu2016 C2]; it is a kinetic transition where the system falls out of equilibrium [trasi2014b C2]. Tg is called "probably" one of the most important properties of an amorphous solid, because storage temperature relative to Tg affects stability [towler2008 C20]. This draft is written from the crystallization-tendency chapter; the evidence table covers far more papers that later chapters will add. New aspect (PEG dispersions): the Tg of the drug relative to the solidification temperature as a possible determinant of whether an amorphous drug is excluded from the crystalline carrier. In polymer blends the additive's mobility, through the blend Tg, is one of three factors that decide exclusion [zhu2011 C2]. In the drug/PEG study a drug Tg above the 25 °C solidification temperature (nilutamide about 33 °C, ketoconazole 44 °C) did not change the pattern [zhu2011 C28, C31]. For water in PEO, Tg describes plasticization (water −136 °C, PEO about −67 °C) [marsac2008b M12, M7, C26].

Findings

Crystallization tendency: F4, F12, F20. PEG dispersions: F6, F11.

Related concepts

used in reduced glass transition temperature and Tm − Tg temperature gap; bounds the supercooled liquid; related to fragility, amorphous salt, plasticization and interlamellar incorporation.

Formulas

reduced glass transition temperature, Vogel-Tammann-Fulcher equation.

How it is measured or obtained

By DSC on reheating a melt-quenched or freeze-dried sample, as onset or midpoint [baird2010 P1; trasi2014b M1; towler2008 P6]; for fast crystallizers that give no Tg, estimated from a Tg/Tm ratio or a Trg–molecular-weight fit [vaneerdenbrugh2010a E7; baird2010 E27]. In the PEG papers the Tg values of the drugs were cited from the crystallization-tendency classification, or measured by DSC (acetaminophen) or estimated with a Tg/Tm ratio (naproxen) [zhu2011 M5, M6; marsac2008b M1, M3, E5].

Values in the library
materialvalue or classconditionspaper ids
propranolol base; hydrochloride−9.3; 35.9 °CDSC[towler2008 R4]
nicardipine base; hydrochloride3.2; 81.0 °CDSC[towler2008 R5]
nilutamide32 °C (onset)DSC[trasi2014b M1]
vemurafenib108 °CDSC at 10 °C/min[lu2016 M1]
felodipine; nifedipine; indomethacin45 °C eachDSC midpoint[baird2010 M37, M32, M40]
lumefantrineabout 18 °C; 19.7 °C (onset)DSC[trasi2020 R5; hiew2022a R3]
five drugs with 10 mol% PVPraised by about 2–3 °CDSC[trasi2014a R7]
nilutamide; ketoconazoleabout 33 °C; 44 °Ccited[zhu2011 M5, M6]
benzocaine−31 °Ccited[zhu2012 M3]
acetaminophen; ketoprofen; naproxen; ibuprofen; felodipine; ketoconazole22.1; −3.0; 24 (estimated); −43.6; 43.1; 44.4 °CDSC and cited[marsac2008b M1, M2, M3, M4, M5, M6]
amorphous PEO; waterabout −67 °C (reported −67 to −55 °C); −136 °Ccited[marsac2008b M7, M12]
Pitfalls and disagreements

Whether a Tg is onset or midpoint is not always stated [towler2008 X7]; Tg of 16 class I molecules is an estimate [baird2010 X17]. Crystallization tendency cannot be predicted from relaxation times and Tg alone [marsac2010 C29], and a high Tg did not prevent a propranolol salt from crystallizing [towler2008 R4.a, R12]. In the solvent screen the Tg contribution separates the classes partly because the storage criterion selects high-Tg compounds [vaneerdenbrugh2010a C41]. The Tg conclusion in the drug/PEG study rests on two drugs whose Tg lie 8 and 19 °C above 25 °C and that also differ in interaction and crystallization tendency [zhu2011 X13]. The Tg of haloperidol is given as below 25 °C in the card of Zhu and co-workers and as 33 °C (calculated from the molecular weight) in the classification paper [zhu2011 M1; baird2010 M17]. The naproxen Tg of 24 °C does not follow from the Tg/Tm rule it cites: the Table 1 melting point gives 26.7 °C [marsac2008b E5, X4]. (synthesis: papers also give different Tg for the same drug, nilutamide 32 °C (onset) against about 33 °C, and felodipine 45 °C (midpoint) against 43.1 °C [trasi2014b M1; zhu2011 M5; baird2010 M37; marsac2008b M5].)

← Concepts and formulas

concept · as used in Dissolution

Henderson-Hasselbalch equation

The relation between pH, pKa and the ratio of un-ionized to ionized drug, \mathrm{pH} = \mathrm{p}K_a + \log_{10}([\mathrm{B}]/[\mathrm{BH}^+]) for a weak base indulkar2015 E1. It is used in this chapter in three ways: to split a measured total concentration into its un-ionized part, C_U = \frac{X}{1+X}C_T with X = 10^{\mathrm{pH}-\mathrm{p}K_a} indulkar2015 E6; to predict the total solubility at any pH from the free-base solubility indulkar2015 E8; and to express concentrations at pH 4.6, equal to the pKa, as un-ionized drug almeidaesousa2016 E3, C13. The pH-shift titration uses modified forms before and after precipitation indulkar2015 E4, E5. The papers of 2017–2022 add the total-solubility form C_T = \frac{1+X}{X}C_U with X = 10^{\mathrm{pH}-\mathrm{p}K_a}, used for pazopanib with the pH 8.4 solubility as C_U and pKa 6.4 sugihara2018 E1, C9.

Findings

F10, F14, F23.

Related concepts

quantifies ionization; uses pKa; gives pH-dependent solubility.

Formulas

Henderson-Hasselbalch equation, pH-solubility profile.

How it is measured or obtained

Calculated from the measured pH and the pKa indulkar2015 E6.

Values in the library

Clotrimazole at pH 6 with total crystalline solubility 1.08 µg/mL and pKa 5.89 gives an un-ionized 0.61 µg/mL (recomputed); atazanavir at pH 1.5, free-base solubility 1.04 µg/mL, pKa 4.52, gives 1090 µg/mL against 1.1 mg/mL printed indulkar2015 E6, E8.

Pitfalls and disagreements

The printed percentage ionized of nicardipine at pH 9 (0.9%) differs from the recomputed value (1.6%) indulkar2015 X4. Eqs. 4 and 5 print the denominator in a way that subtracts a concentration from 1 indulkar2015 X18.

← Concepts and formulas

concept · as used in Dissolution

heterogeneous nucleation

Nucleation at an interface (a foreign particle, a container wall, a second phase), which lowers the nucleation barrier, so nucleation there proceeds more readily wilson2021 C44. New aspect (PEG dispersions): a crystalline carrier as the nucleating surface. Zhu and co-workers conclude that crystalline PEG acts as a favourable heterogeneous nucleation site for the slowly crystallizing ibuprofen and fenofibrate, which explains why the drugs began to crystallize in the dispersion (after about 100 and 120–180 min) earlier than most neat samples, despite a smaller thermodynamic driving force ("it appears") [zhu2012 C4, C34, R23.a]. New aspect (Crystallization from solution): In solution, impurities in large volumes at high supersaturation may induce heterogeneous nucleation, which the authors give as a reason for the small scatter (below 15%) of induction times ("it is reasonable to expect") ilevbare2013c R17, C16. For danazol the interface of the drug-rich droplets is a candidate site: crystals could form from the drug-rich or the drug-lean phase, the change to a two-phase solution can alter nucleation, and polymer at the droplet–water interface is "likely" to disrupt nucleation there jackson2014 C45, C53. Micelles of dihydroxy bile salts "may" offer interfaces for heterogeneous nucleation, and the surfaces of drug-rich telaprevir particles are expected to enable it; adsorbed bile salt is expected to modify it lu2017 C34, C36, C39. New aspect (Supersaturation from ASD dissolution): the ASD dissolution papers invoke it three times: polymer adsorbed on parent γ nifedipine crystals could reduce heterogeneous nucleation of α on them, and many small solution-grown crystals offer more surface for it raina2014b C31, C36; the interfaces of a drug-rich phase "may" act as heterogeneous nucleation sites trasi2015b C31; surfactants promoted ritonavir crystallization only when the ritonavir–water interface of droplets was present ilevbare2013d C43.

Findings

Crystallization tendency: F10, F17. PEG dispersions: F9. Crystallization from solution: F14, F15, F25, F32, F34, F37, F38. Supersaturation from ASD dissolution: F3, F11, F13.

Related concepts

part of nucleation; contrasts with classical nucleation theory (homogeneous form); related to surface crystallization, stochastic nucleation, nucleation induction time and semicrystalline solid dispersion; related to secondary nucleation and polymer adsorption to drug-rich droplets; related to drug-rich nanodroplets and surfactant-induced crystallization.

Formulas

classical nucleation theory.

How it is measured or obtained

Rarely measured directly; inferred from scatter of crystallization temperatures in DSC pans [baird2010 C19], from crystals forming at a seeded interface [zhu2012 R15, R19], from the effect of shear in a rheometer [baird2012 C8] or from the change of slope of induction time against supersaturation duong2022b C28. In the seeding test a small piece of crystalline PEG is placed in the supercooled neat drug at 25 °C and observed by polarized light microscopy for where the first crystals form; crystals formed at the PEG edge within minutes and none in the bulk [zhu2012 P7, R15, R19]. In the crystallization-from-solution papers it is not measured; the site of nucleation (droplet, interface or bulk) was not determined jackson2014 X15. Seeds added on purpose test the related seeded growth (F5, F20) alonzo2012 P4. In the ASD dissolution papers it is not measured either, but argued from conversion kinetics and induction times raina2014b C32; ilevbare2013d R16.

Values in the library
materialvalue or classconditionspaper ids
ibuprofen; fenofibratecrystals form at a crystalline PEG interface within minutes, none in the bulk25 °C[zhu2012 R15, R19, C4]
neat ibuprofen; fenofibrate0.20 and 0.34 of 50 samples crystallized after 3 weeks25 °C, no carrier[zhu2012 R2, R3]
ibuprofen; fenofibrate in 20/80 PEG 3350onset about 100 min; 120–180 min25 °C[zhu2012 R23.a]
class I-A meltscrystallization temperatures higher in the rheometer than in DSC, ascribed to the upper plateshear 30 s⁻¹[baird2012 R5, C8]
class I moleculesscatter of crystallization temperatures ascribed to stochastic and heterogeneous nucleationDSC pans[baird2010 C19; baird2013 C18]
felodipine filmsnucleation "most likely heterogeneous"spin-coated films[konno2006 C33]
posaconazolehomogeneous at high supersaturation, heterogeneous at low; shallow slope of log t against 1/log²S below S about 12 read as heterogeneous ("has been attributed")PBS pH 6.5, 37 °Cduong2022b R10, C28
enzalutamide with drug-rich dropletsdroplets enhance crystallization; droplet/water interface "likely" a favourable site; induction times fall on crossing 42 µg/mLpH 6.5, 2.5–100 µg/mL polymerwilson2021 C45, C46, R3
bicalutamidefractures of mechanically activated samples favour heterogeneous nucleationdispersions[moseson2022b C45]
induction-time replicates, 50–80 mL, S 2.4–15.4scatter below 15%triplicateilevbare2013c R17
danazol, HPMC-ASinduction time 516 → 277 min as drug concentration rises from 10 to 20 µg/mL25 °Cjackson2014 R17
telaprevir δ 28.8, buffercrystallizes immediately with a drug-rich phase presentpH 6.5, 37 °Clu2017 R4
atazanavir ASD particlesdissolving ASD did not seed nucleation (about 300 against 350 min)PVPVA + SDS, pH 6.8indulkar2019b R5, C25
ritonavir with SDS; Tween 80, below and above LLPSabout 262 against 34.7 min; about 289 against 23.6 min37 °Cilevbare2013d R16, R12
nifedipine dispersions against glassγ → α complete in ≈5–40 min against ≈40–145 min with dissolved polymer25 °Craina2014b R12, R10
Pitfalls and disagreements

Heterogeneous nucleation by a carrier breaks the link between the crystallization of the pure drug and of the drug in the dispersion [zhu2012 C41]. Homogeneous classical theory is applied to systems that are most likely heterogeneous [konno2006 C33; marsac2006a C32]. The PEG seeding was done in pure supercooled drug, not in the dispersion, and enrichment of the drug in the remaining non-crystalline fraction after PEG crystallizes is an alternative that the experiments cannot separate [zhu2012 X13]. Whether other slowly crystallizing drugs (nilutamide, ketoconazole) are nucleated by crystalline PEG was not tested; in the same PEG at the same ratio neither was fully crystalline at 24 h [zhu2011 R18.e, R18.f]. Nucleation by polymers in solution has been reported, outside the library, and most reports of drugs in polymers find retardation of crystallization [zhu2012 C35, C36]. The attribution to nucleation at the droplet interface is an inference; solutions at 10 µg/mL with HPMC or HPMC-AS are already above their measured onsets jackson2014 X3, X15. Impurity-induced nucleation was expected, not tested ilevbare2013c C16. Neither micelles as nucleation sites nor the nucleation site in the two-phase solutions were observed lu2017 C34, C40. Neither the enzalutamide nor the posaconazole paper located the nucleation site; the homogeneous–heterogeneous assignment rests on a slope change wilson2021 C45; duong2022b X11. None of the three proposals of the ASD dissolution papers was tested directly raina2014b C36; trasi2015b C31; ilevbare2013d C43.

← Concepts and formulas

concept · as used in Dissolution

Higuchi two-component dissolution model

Evidence table: Higuchi two-component dissolution model. Content from the release-mechanism chapter (2019–2020), with a comparison row from the ASD dissolution chapter.

The diffusion-controlled model of Higuchi and co-workers (cited) for a non-interacting, non-disintegrating mixture of two components: the composition of the dissolving interface stays constant only at one critical mixture ratio; at any other ratio the surface enriches in one component, which then controls dissolution, and for components of very different solubility the drug fraction that gives polymer control is very low indulkar2019a C23; saboo2020a C35. Corrigan (cited) noted that such models "appear to" describe high-loading dispersions controlled by a drug-rich surface layer but not low-loading ones, where drug and polymer are released together over a range of compositions indulkar2019a C24.

Findings

Release mechanism and LoC: F2.

Related concepts

contradicted by congruent release at low loading; predicts a drug-rich surface layer at high loading; related to polymer-controlled release.

Formulas

Higuchi-Corrigan critical mixture ratio.

How it is measured or obtained

Applied by calculation: for felodipine–PVPVA with an amorphous solubility of 8 µg/mL, a PVPVA solubility of 46 mg/mL and a diffusion-coefficient ratio of 10, the critical ratio is about 1.7 × 10⁻³ (printed 1.7 × 10⁻⁶) saboo2020a R27, X1.

Values in the library
materialvalue or classconditionspaper ids
felodipine–PVPVAcritical drug:polymer ratio ≈1.7 × 10⁻³, far below the 5–50% testedcalculatedsaboo2020a R27, C36
ritonavir–PVPVAcongruent at 10–25%, contrary to the single-ratio predictiontabletsindulkar2019a C24, C25
celecoxib (ASD dissolution chapter)Corrigan's condition as the basis of polymer control at low and drug control at high loadingcitedxie2016a E2, C4
Pitfalls and disagreements

The model "may adequately describe" high-loading dispersions but fails for congruent release at 10–15% loading saboo2020a C37; judging release by the drug:polymer ratio alone is "clearly an over simplification", since the PVPVA limit varies with the drug and HPMCAS and EUDS stay congruent to 50% saboo2020a C38.

← Concepts and formulas

concept · as used in Dissolution

HME operating design space

A map of product melt temperature against residence time for hot melt extrusion with regimes: thermal degradation at the top, melting above the drug's melting point, dissolution between Tc and Tm (the drug dissolves into the softened polymer, not melts) and suspension below Tc, plus an inaccessible zone below the polymer's minimum processing temperature [moseson2018a R1; moseson2018 C40, C48]. Higher temperature and longer residence time raise the risk of thermal degradation; lower temperature and shorter residence time the risk of residual crystallinity [moseson2018 C65]. The 2018 map put thermal degradation at the top as a schematic region; the thermogravimetry and assay studies of the ASD process papers give it a measured form, time–temperature contour maps of mass loss and assays of drug after exposure, and show that the lower boundary also moves with the input crystal size [moseson2020 R15, R18; moseson2021 R6]. For 30% bicalutamide–PVPVA, with Tc = 145 °C as the slowest dissolution case, the residence time needed to reach a crystal-free extrudate ranged from 2 min for micronized crystals to more than 20 min for large or broad-distribution crystals [moseson2022c R10].

Findings

F9, F10, F35, F36, F37, F41.

Related concepts

bounded by formulation critical temperature and temperature-composition phase diagram; governs residual crystallinity and crystal dissolution into a polymer melt; the chemical-stability side is the HME processing window.

Formulas

Noyes–Whitney equation.

How it is measured or obtained

By extruding one composition at several melt temperatures and residence times, reading crystallinity with several methods and placing each run on the plane; the zone lines are drawn by the authors between data points and could instead be set by XRPD thresholds (<1%, <2%, <5%) with performance tests [moseson2018 R15, C60].

Values in the library
materialvalue or classconditionspaper ids
50% IDM–PVPVA15 runs; 117–161 °C; 2–20 min; amorphous by all techniques first at 131 °C 20 min, 141 °C 10 min, 161 °C 2 min5 mL recirculating extruder[moseson2018 R10, R15]
1:1 IDM–PVPVAextrudate at 131 °C and 20 min on the lower edge of the dissolution regionschematic from earlier work[moseson2018a R1]
30:70 BCL–PVPVAdissolution regime between Tc = 145 °C and Tm = 195 °C; at 155 °C small input crystals left crystals visible only by TEM, medium and large ones 3.5% and 30%; at 180 °C small crystals left none5 mL extrudermoseson2021 M1, P1, R6
50/50 IDM/PVPVA and 30/70 BCL/PVPVA, chemical sideIDM/PVPVA under 1% mass loss for short times to 200 °C; BCL/PVPVA 1% within 10 min at 180 °C, after 40 min at 165 °C, after more than 100 min at 155 °Cisothermal TGA, 4 h[moseson2020 R15, C44, C45]
20% RTV with PVPVA 64, HPMCAS MF, HPMCextrusion at 130–160 °C, 5 min: assay 95.7–100.5%, polymer-dependent2 mL extruder[alvarenga2022 R22]
30% BCL–PVPVA at Tc = 145 °C, lots of D50 3.51 / 37.0 / 38.0 / 42.2 / 92.7 µmbelow the limit of detection at 2 / 5 / 6 min; about 2.5% and 15.0% at 20 min for the last two5 mL micro-extruder, PXRD[moseson2022c R10]
PCZ–HPMCAS MF, 10 / 25 / 50% DLcrystals 0.3 / 3.2 / 19.3 wt% at 125 °C, none at 175 °C2 min, SHGshah2024 R10
Pitfalls and disagreements

The map assumes controlled particle size, screw configuration and speed; residence time is the time to the first extrudate in a micro-compounder; the X-ray criterion behind the Fig. 8 classes is not stated [moseson2018 C61, X15, X5]. Thermal degradation was not measured and its region is schematic [moseson2018 C65]. The runs of the bicalutamide study are placed by melt temperature only because the residence time and screw speed are in a table that was not supplied moseson2021 P1. The ceiling of the window is treated in HME processing window. Processing at Tc is not practical for most products, and screw speed and shear were not studied [moseson2022c C56, C55].

← Concepts and formulas

concept · as used in Dissolution

Hoffman equation

An approximation for the free-energy difference between the supercooled liquid and the crystal at a temperature T below Tm, needing only Tm and the heat of fusion [vaneerdenbrugh2010a E2; lu2016 E1]. It assumes that the enthalpies of crystal and supercooled liquid vary linearly with temperature, that is a constant heat-capacity difference, and applies above Tg [marsac2006b C37; ilevbare2013a C58]. In this chapter it supplies the crystallization driving force; most other library papers use it to estimate the amorphous solubility advantage. New aspect (solution methods): in the solution-methods papers the Hoffman equation supplies the free-energy advantage of the amorphous form in the amorphous solubility estimate, printed with a positive sign and \Delta T = T_m - T: \Delta G = \frac{\Delta H_f\,\Delta T}{T_m}\cdot\frac{T}{T_m} [raina2015a E2]. New aspect (C. Amorphous solubility and LLPS): those papers print it as the free-energy term of Eq. 1, \Delta G = \Delta H_f\,(T_m - T)\,T/T_m^{2}, and list its assumptions: a constant, temperature-independent ΔCp, small undercooling and Tg close to T∞; it also does not address the crystal-to-glass conversion ilevbare2013a E2, C58; almeidaesousa2015 E2, C8; mosqueragiraldo2015 E2; almeidaesousa2016 E2. For atazanavir Eq. 2 is printed with DSC Tm 208 °C and ΔHf 90.1 J/g, and the paper's own ratio of 62 follows from them when 0.22 is read as exp[−I(a)], although Table I heads that column I(a) (synthesis) indulkar2017a E2, E3, X1; indulkar2015 M2. New aspect (Bioperformance): the equation estimates the amorphous-to-crystalline solubility ratio \sigma_a/\sigma_c = e^{\Delta G/RT} and is combined with a water-sorption correction [raina2014a E3, E5; raina2015c E1, E2]. New aspect (Crystallization from solution): in the solution-crystallization papers \exp(\Delta G_c/RT) is the activity ratio taken as the solubility ratio before a water-sorption correction, evaluated at 25 or 37 °C, and the ratio times the measured crystalline solubility is compared with plateaus after pH shifts and with onsets of phase separation (F2) hsieh2012 E3, E4, R10; hsieh2014 E2, E3; jackson2014 E2, R5. New aspect (Supersaturation from ASD dissolution): the ASD dissolution papers use it to estimate the amorphous solubility advantage of felodipine and indomethacin; the felodipine inputs of 2008 come from earlier work, which found the equation estimated felodipine's free-energy difference well (cited) konno2008a E2, R20.

Findings

Crystallization tendency: F6, F7, F13. Solution methods: F5. C. Amorphous solubility and LLPS: F5, F7. Bioperformance: F1, F23. Crystallization from solution: F2, F16, F21. Supersaturation from ASD dissolution: F5, F7.

Related concepts

measures thermodynamic driving force for crystallization; depends on enthalpy of fusion and degree of supercooling; related to entropy of fusion, amorphous-crystalline free energy difference and amorphous solubility; compared with the heat-capacity route in amorphous-crystalline free energy difference; accuracy set by degree of supercooling. Related to amorphous solubility advantage; corrected by the Gibbs-Duhem equation route.

Formulas

Hoffman equation, amorphous solubility advantage from free energy difference.

How it is measured or obtained

Calculated from DSC Tm and ΔHfus at the temperature of interest, per mole, per gram or, with the crystal density, per volume [baird2010 E25; vaneerdenbrugh2010a P11]. Its agreement with MDSC-based free energies was checked for felodipine and nifedipine [marsac2006a C14]. In solution work it enters \exp\left(\frac{\Delta G}{RT}\right) as the amorphous-to-crystalline solubility ratio alonzo2010 R3; duong2022a R27. ΔHf and Tm were measured by DSC at 10 °C/min in pinhole aluminum pans; the values are not printed [raina2015a P4, E2]. With a heat-capacity term it becomes \frac{\Delta G_{a\to c}}{RT} = \frac{\Delta H_f}{RT}\left(1 - \frac{T}{T_m}\right) + \frac{1}{RT}\int_{T_m}^{T}\Delta C_p\,dT - \frac{1}{R}\int_{T_m}^{T}\frac{\Delta C_p}{T}\,dT mosqueragiraldo2015 E3. In the amorphous solubility papers ΔHf and Tm are DSC values at 10 °C/min (5 °C/min in one paper), evaluated at 25 or 37 °C almeidaesousa2015 P5; indulkar2015 P6, P5; almeidaesousa2016 P9. In the Bioperformance papers ΔHf and Tm come from DSC melting onset and enthalpy, and the water sorption from gravimetric moisture sorption [raina2014a P3, P4]. The DSC method is not given in the 2014 pH-shift paper and the heats of fusion are not printed in the 2012 paper hsieh2012 P13, X14; hsieh2014 X11. In the ASD dissolution papers: from the DSC enthalpy of fusion and melting temperature (felodipine 30.12 kJ/mol, 143.41 °C; indomethacin 32.48 kJ/mol, 153.4 °C) and the crystalline solubility alonzo2010 P10, P12, M1, M2; inputs not printed in the 2008 and 2011 papers konno2008a E2; alonzo2011 E3.

Values in the library
materialvalue or classconditionspaper ids
felodipine; nifedipine6.2 and 8.8 kJ/mol25 °C[marsac2006a E3, R4]
34 drugsΔGv −8.6 (lidocaine) to −54.7 J/cm³ (acetaminophen)298 K[baird2012 M5, M12]
vemurafenib α against βα lower in free energy up to a virtual transition at 319 °CTm and ΔHm of both forms[lu2016 R22, E1]
felodipineestimated amorphous solubility about 9 µg/mL37 °Calonzo2010 R3
delamanidsolubility ratio 31.8 calculated against 42.3 measured37 °Cduong2022a R27
ritonavir, efavirenz, celecoxib≈10.2, ≈2.70, ≈7.74 kJ/mol (extractor calculation)37 °Cilevbare2013c E7
six dihydropyridinesused for the yardstick of F5; no ΔG value printed25 and 37 °C[raina2015a E2, R11]
diverse drugsCp method closer to the measured LLPS onsets than the Hoffman equation25 °Calmeidaesousa2015 R11, C43
ritonavir10.1 kJ/mol (extractor recomputation from Table 2 inputs)37 °Cilevbare2013a E2
ibuprofen to griseofulvin3.24, 4.84, 5.69, 8.51, 10.33, 9.69 kJ/mol25 °Calmeidaesousa2015 R11
telaprevir13.31 kJ/mol (recomputed); amorphous solubility 245 ± 5 µg/mL, 2.7 times the onset37 °Cmosqueragiraldo2015 E1, R13, R17
clotrimazole6.26 kJ/mol with a molar mass not printed in the paper (extractor)310 Kindulkar2015 E3
CRH15.68 kJ/mol; estimate 11.2 µg/mL at pH 4.625 °Calmeidaesousa2016 M1, R2
atazanavir14.55 kJ/mol (recomputed from Table I); ratio about 62, as printed, with 0.22 read as exp[−I(a)]; about 228 read as I(a)310 Kindulkar2017a E2, X1; indulkar2015 M2
felodipineHoffman ratio 10.92 (25 °C), 8.64 (37 °C); water factor 0.74, 0.83Tm 147 °C, ΔHf 28.67 kJ/mol[raina2014a R7]
nifedipineprinted ratio 8.78; recomputed 14.45Tm 173 °C, ΔHf 32.5 kJ/mol[raina2014a R7, X3]
atazanavirratio 62, predicted 68 µg/mL310 Kindulkar2017a R5
indomethacin17–25 µg/mL (25 °C), about 37 µg/mL (37 °C)Hoffman estimatealonzo2010 R8
enzalutamideprinted estimate about 39 µg/mL (13-fold); the printed inputs give 27.737 °C, Tm 470 K[wilson2018 E1, R3, X1]
ritonavirΔHf 60.4 kJ/mol, Tm 121 °C, 37 °C: ΔG = 10.1 kJ/mol and exp(ΔG/RT) = 50.8 (extractor calculation); calculated amorphous solubility 20.6 µg/mL with the water term37 °Cilevbare2012b E8, E9, R1
glyburide; warfarinabout 60-fold and 48-fold (59.9 and 47.7 recomputed) from Tm 175.6 °C, ΔHf 45.5 kJ/mol and Tm 169.2 °C, 43.6 kJ/mol25 °C (assumed)hsieh2014 R16, E3, M3, M4
danazolTm 225.4 °C, ΔHf 28.9 kJ/mol: ΔG = 6.95 kJ/mol; ratio with the 0.935 water factor 15.4 recomputed against 19.6 printed25 °Cjackson2014 E1, E2, X1
five weak basesratios 22.2, 11.9, 20.4, 54.6, 7.0 without water correction (carvedilol, clotrimazole, clozapine, ketoconazole, loratadine)37 °Chsieh2012 R10
felodipine (six-dihydropyridine study)e^(ΔG/RT) recomputed 10.84 at 298.15 K from 74.6 J/g and 147 °CDSC data of the paperraina2015b E1, R1.b
posaconazoleTm 169.1 °C, ΔHf 76.95 J/g; printed amorphous/crystalline ratio 37.9 with water factor 0.33, estimate 10.22 against 9.08 µg/mL measured310 K; the extractor obtains ΔG = 16.13 J/g and a ratio of about 26.5duong2022b R7, E3, X2
felodipineratio about 10; about 9.5 µg/mL37 °Ckonno2008a R17
felodipineΔG 5729 J/mol, ratio 9.22 (recomputed) against "around 9"37 °Calonzo2010 E1
felodipineabout 9.1 µg/mL (37 °C); 5–6 µg/mL (25 °C)pH 6.8alonzo2011 M1
Pitfalls and disagreements

The approximation "can lack accuracy": it assumes a constant ΔCp and small undercooling almeidaesousa2015 C8, C34, and was judged inappropriate for telaprevir, far below its melting point mosqueragiraldo2015 C24. It ignores ionization and water sorption [raina2014a C10]. Printed values are sometimes not reproducible from the printed inputs [baird2012 X2; raina2014a X3]. Sign conventions differ: some papers plot crystal minus liquid [lu2016 X17] or print a leading minus sign duong2022a E2. In the solution-methods papers the Hoffman-based estimate was above the measured danazol onset (16 against 13 µg/mL) and cannot follow polymer effects jackson2014 R5. In the amorphous solubility papers, for telaprevir (Tm 238 °C, 37 °C test) the authors judge it inappropriate for large undercooling mosqueragiraldo2015 C24, M1. In the 2013 paper four of eight predictions cannot be reproduced from the printed Table 2 inputs ilevbare2013a X1. Eq. 2 of the weak-base paper is printed with a sign that does not give its stated ratios indulkar2015 X1. Eq. 3 of the atazanavir paper is printed with an inverted sign indulkar2017a X1. The nifedipine ratio of raina2014a does not follow from the printed inputs [raina2014a X3]. The enzalutamide estimate cannot be reproduced from its printed inputs, and the stated S of "approximately 13" matches the estimate rather than the measured 42/2.9 = 14.5 [wilson2018 X1, X2]. The danazol ratio cannot be reproduced from the printed inputs, and the weak-base estimates cannot be recomputed from the 2012 paper jackson2014 X1; hsieh2012 X14. The equation neglects water mixed into the amorphous phase, which can lower the amorphous solubility by up to a factor of 2 hsieh2014 R17. Its use for warfarin assumed 25 °C because the temperature is not printed hsieh2014 E2. For posaconazole the printed ratio of 37.9 does not follow from the printed melting data, and the exponent of the printed amorphous-solubility equation has the wrong sign duong2022b X2. The indomethacin estimate at 25 °C does not reproduce from the printed inputs alonzo2010 X2. The estimate becomes increasingly approximate far below Tg, and a configurational heat-capacity estimate is more rigorous (cited) alonzo2011 C5.

← Concepts and formulas

concept · as used in Dissolution

hydrogen bonding

In the papers of this chapter, a bond between a donor group of the drug (the carboxylic acid OH of indomethacin, the NH of felodipine and nimesulide, hydroxyl groups of sucrose) and an acceptor group of the polymer (the lactam carbonyl of PVP, the acetate groups of PVAc and PVP/VA, the carboxyl of PAA, the groups of HPMCAS), or between molecules of the same kind (acid dimers of the drug, self-association of PAA) [taylor1997 C25, C35; kestur2010a C18; rumondor2009a C45]. A lower NH wavenumber means a stronger bond [kestur2010a C18]. PVP carries a better acceptor than the drug's own groups, so its bonds replace weaker drug–drug bonds [marsac2009 C39]; the more acidic carboxyl of indomethacin is expected to bond more strongly than the NH of felodipine or nifedipine or the OH of sucrose [marsac2009 C42]. A drug donor can also be bound within its own molecule (see intramolecular hydrogen bonding), which leaves little to bond to a polymer [kestur2011 C27]. Later papers add polyphenol OH groups bonding to the PVP carbonyl (a lower OH wavenumber and a larger carbonyl shift mean a stronger bond: OH band at 3138 and 3135 cm⁻¹ with PVP against 3329–3399 cm⁻¹ with the other polymers) [wegiel2013a C8, C9, C11, R2, R4]; dextran hydroxyls bonding to the PVP carbonyl in a polymer–polymer pair, where dextran–dextran bonds are assumed to be stronger or more numerous [vaneerdenbrugh2012a C10, C36]; and a donor and acceptor classification of the groups of 15 drugs and 7 polymers by bonding atom, acidity and the pKBHX scale [vaneerdenbrugh2011a C13, C14, C19]. Lumefantrine did not hydrogen-bond to PVPVA in dried films hiew2022a C20, R17.

Findings

F1, F2, F3, F4, F12, F13, F14, F17, F20, F22, F24, F25.

Related concepts

part of drug-polymer interactions; includes intramolecular hydrogen bonding and self-association; contrasts with dipole-dipole interactions; related to hydrogen-bond basicity, pKa and binding constant; contrasts with halogen bonding and acid-base interaction; classified by Etter's hydrogen-bond rules.

Formulas

fraction of hydrogen-bonded carbonyl groups from band areas.

How it is measured or obtained

By IR and Raman. Cyclic acid dimers are found by the mutual exclusion rule: an acid band present in the IR and absent in the Raman [taylor1997 C14]. Drug–polymer bonds are read from shifts of the drug NH or acid C=O band and of the polymer carbonyl band, in spin-coated or solvent-cast films at one donor per polymer carbonyl or at 20–50 wt% polymer, always against the amorphous drug and a physical mix, not against the crystal [marsac2009 P4; kestur2010a P6, P7; taylor1997 C7, C24]. A dilution series in a non-polar solvent tests for intramolecular bonds [kestur2011 P9]. In dispersions, a second principal component of the IR spectra beyond a calculated physical mixture is read as "presumably" hydrogen bonding [rumondor2009a C20]. DFT gives the geometry of single molecules [kestur2011 P11]. Further methods: the fraction of PVP carbonyls bonded, from a free and a maximally bonded band fitted to the carbonyl region (fraction of hydrogen-bonded carbonyl groups from band areas) [vaneerdenbrugh2012a P5, E1]; the polyphenol OH band and the polymer C=O shift at 30% polyphenol [wegiel2013a P4]; crystal-structure statistics of competition between groups [vaneerdenbrugh2011a P5, R14]; DFT for intramolecular bonds [vaneerdenbrugh2011a P6].

Values in the library
materialvalue or classconditionspaper ids
indomethacin–PVP-K90PVP C=O at 1636 against 1679 cm⁻¹; drug acid C=O at 1726 cm⁻¹5–70 wt% PVP, solvent-evaporated[taylor1997 R5.l, R11, R12]
amorphous indomethacinacid dimer at 1710 cm⁻¹ (IR) with no Raman bandquench-cooled melt[taylor1997 R5.h, R6]
indomethacin, felodipine, sucrose, ketoconazole with PVP K12PVP C=O shift 45, 25, 25 and 0 cm⁻¹one donor per carbonyl, spin-coated[marsac2009 R12]
felodipine with PVP, PVP/VA, HPMCAS, PVAcNH at 3294, 3298, 3348, 3354 cm⁻¹ against 3341 cm⁻¹50 wt% polymer films[kestur2010a R9]
nimesulideNH at 3345 cm⁻¹ at every concentrationdichloromethane, 1–100 mg/ml[kestur2011 R11]
nimesulide with PVPPVP C=O ≈1684 → ≈1680 cm⁻¹, shoulder ≈1657 cm⁻¹20–50 wt% PVP[kestur2011 R14]
felodipine–PVP, nifedipine–PVPsecond PC with NH and carbonyl loadings10–90% and 25–70% PVP[rumondor2009a R7, R9]
naringenin, quercetin with PVPpolyphenol OH band 3138 and 3135 cm⁻¹; PVP C=O shift 21 and 24 cm⁻¹spin-coated films, 30% polyphenol[wegiel2013a R2, R4]
dextran–PVPPVP C=O 1680 → 1661 cm⁻¹; hydrogen-bonded fraction 1.00 (DEX1–PVP12) to about 0.09 (DEX450–PVP90) at 0.8 dextranspin-coated films[vaneerdenbrugh2012a R2, R14]
benzamide, phenacetin crystalsamide–amide only 100 and 94% alone; 0% with a COOH partner; 14 and 33% with C(O)NC2CSD survey[vaneerdenbrugh2011a R14]
lumefantrine–PVPVAcarbonyl bands fixed at 1736 and 1684 cm⁻¹ at 10, 25 and 50% drugdried spin-coated filmshiew2022a R17

Evidence table: hydrogen bonding.

Pitfalls and disagreements

Assignments rest on analogy with liquid models: the same non-bonded acid C=O is assigned at 1735 cm⁻¹ (chain ends) and 1726 cm⁻¹ (PVP-bonded molecule), and how one turns into the other is not shown [taylor1997 C32, X4]. IR bonds were recorded at 20–50 wt% polymer, whereas the growth effects were measured at 0.5–5 wt% and 70–110 °C [kestur2010a X5; kestur2011 X10]. The felodipine–PVP carbonyl shift is 25 cm⁻¹ in one paper and about 20 cm⁻¹ in a cited study [marsac2009 R12.b; kestur2011 R20]. A drug without a donor (ketoconazole) shows no shift yet mixes about athermally [marsac2009 R7.c, R12.h]. For bifonazole the donor–acceptor picture rests on crystal-structure reasoning and was not measured [kestur2011 X9]. The bond between indomethacin and PVP is proposed as the reason PVP inhibits crystallization, but no crystallization was measured in that paper [taylor1997 X8]. The PVP shoulder at 1661 cm⁻¹ with naringenin overlaps the drug's own band, and HPMC and PAA are placed on the IR trend line by projection [wegiel2013a X9, X12]. The bonded fraction of dextran–PVP rests on references set by one system and on films prepared differently from the DSC samples [vaneerdenbrugh2012a X12, X8]. No hydrogen bond was measured in the 15-drug screen, and its melt spectra are not shown [vaneerdenbrugh2011a X13].

← Concepts and formulas

concept · as used in Dissolution

hydrophilic-lipophilic balance

Evidence table: hydrophilic-lipophilic balance. Content from the release-mechanism chapter (2019–2025), with rows from the Physical stability chapter.

The balance of hydrophilic and lipophilic parts of a surfactant, used in the library to rank surfactants from hydrophobic (Span 85) to hydrophilic (SDS). Que and co-workers (2019) screened five surfactants at 5 parts per 100 parts drug plus polymer in ledipasvir–PVPVA and found that the more hydrophilic poloxamer 407 and SDS raised the limit of congruency to 7.5 and 30% que2019 A2, C12. For clopidogrel SDS (HLB 40) was the only surfactant that raised release, and its higher effective level for droplet stability "most likely" reflects its high HLB correasoto2022a R1, C42, C55; for atazanavir, charge and hydrophilicity did "not appear" to affect release substantially among the low-molecular-weight additives correasoto2022b C50. In ritonavir–PVPVA at 30% the outcome did not follow HLB: SDS (40) and Span 85 (1.8) released fast or fully, Tween 80 (15) and Span 20 (8.6) stalled, and the authors saw no correlation between surfactant properties and performance indulkar2022 M4, M5, M7, M8, C64. In the 2023 surfactant study the most hydrophilic surfactant (SDS) raised the water needed for separation and the most lipophilic (Span 85) softened the drug-rich layer; at 40% only SDS and Tween 80 kept partial release yang2023 R21, C18, R2.

Findings

Release mechanism and LoC: F13, F16, F21, F31.

Related concepts

related to critical micelle concentration and polymer-surfactant interaction; raises the limit of congruency.

Formulas

none.

How it is measured or obtained

Not measured; the surfactants are ranked by name, and no HLB values are printed que2019 X19. HLB values are cited correasoto2022a R1; correasoto2022b M3.

Values in the library
materialvalue or classconditionspaper ids
Span 85, Tween 80, vitamin E TPGS in ledipasvir–PVPVA 7.5%no rescue of release (≤ ≈4% drug at 60 min)pH 6.8, 37 °Cque2019 R6
poloxamer 407; SDSLoC 7.5%; 30%sameque2019 C12
SDS, Tween 80, Span 20, Span 85 in ritonavir–PVPVA (Physical stability)hydrophilic SDS mainly in the polymer-rich phase, the more hydrophobic surfactants preferentially in drug-rich domainshumidified films[yang2022b C61, C35]
SDS, CTAB, TPGS, Tween 80HLB 40, 22, 13.2, 15citedcorreasoto2022a R1
Span 20, Span 80, Span 85HLB 8.6, 15 (as printed), 11citedcorreasoto2022b M7, M8, M9
SDS, Tween 80, TPGS, Span 20, Span 85 in ritonavir–PVPVA 30:70HLB 40, 15, 13.2, 8.6, 1.8 (cited); ritonavir ≈78, ≈25, ≈89, ≈41, ≈87% at 90 minpH 6.8, 37 °Cindulkar2022 M4, M5, M6, M7, M8, R5, R6, R9, R7, R8
SDS, Tween 80, Span 20, Span 85 in ritonavir–PVPVAHLB 40, 15.0, 8.6, 1.8 (cited)10 parts per 100 parts drug and polymeryang2023 M3, M4, M5, M6
Pitfalls and disagreements

Why SDS works was not tested; the authors offer that the surfactants "possibly" reduce the rate or tendency of phase separation que2019 C53. Surfactant location was not measured in the ledipasvir dispersions que2019 C53. Span 80 is printed with the same HLB as Tween 80 (15) correasoto2022b X8. Span 85 is given HLB 11 in the atazanavir paper against 1.8 in the two ritonavir surfactant papers (synthesis: comparison of the cited values) correasoto2022b M9; indulkar2022 M8; yang2023 M6. For ledipasvir the 2019 study gives the gain with SDS as 5 → 30% (F13) que2019 C12, while the 2023 surfactant paper cites it as 7.5 → 30% yang2023 R27.

← Concepts and formulas

concept · as used in Dissolution

hydrophobic interactions

The association of non-polar drug molecules to minimize contact with water; Ilevbare and Taylor call it "intuitive" that LLPS of drugs with Log P 2.24–5.98 is driven by hydrophobic interactions and attribute the lower LLPS concentration at higher ionic strength to salting-out, which strengthens them ("may be attributed") ilevbare2013a C37, C38, C41. The papers of 2017–2022 add that the lower GLPS onset of telaprevir in 100 mM than in 50 mM phosphate (104/102 against 149/146 µg/mL) is also attributed to hydrophobic aggregation promoted by ionic strength, again untested lu2017b R9, C20; and that the signs of the transfer of polymer into a drug-rich phase (positive ΔH and ΔS) are related to the hydrophobic effect ueda2022 C50 (see hydrophobic effect). New aspect (Crystallization from solution): in the crystallization-inhibition papers hydrophobic interaction is the proposed driver of polymer adsorption on drug crystals and of polymer–polymer association; salts make water a poorer solvent for hydrophobic groups, so if hydrophobic forces drive the polymer to the crystal, a higher buffer concentration should strengthen the interaction and the inhibition ilevbare2013b C27, C28. The cellulose polymers gained from 50 to 100 mM phosphate, which the authors read as hydrophobic interaction "verified"; PVPVA did not and is explained by a hydrogen bond ilevbare2013b R10, C48, C51. Polymer pairs were also more effective in 100 mM, taken as support for hydrophobic interpolymer complexes ilevbare2012a C43. New aspect (Mesoporous silica): the possible binding of lipophilic drugs to the hydrophobic siloxane part of a silica surface, expected for drugs of log P above 4 ("considered feasible") but not found: adsorption of ritonavir (log P 5.98), indomethacin (4.27) and its methyl ester (4.6) did not change with ionic strength [dening2019 C51, C22, M1; mccarthy2020 C6, C31, M1, M2]. A second sense appears for loaded silica: as hydrophobic drug fills the pores the formulation becomes more hydrophobic and water enters more slowly, which "may contribute" to low release at high loading [hate2020a C44, C45; hate2020b C43].

Findings

Amorphous solubility and LLPS: F1, F9, F18, F21. Crystallization from solution: F8, F11, F17, F36, F44. Mesoporous silica: F5, F11.

Related concepts

proposed driver of liquid-liquid phase separation; related to the critical micelle concentration analogy for the temperature profile; related to polymer hydrophobicity, interpolymer complex and polymer adsorption; contrasts with drug-silanol hydrogen bonding as a mechanism of drug adsorption onto silica.

Formulas

none.

How it is measured or obtained

Not measured: neither solvent polarity nor drug association was tested ilevbare2013a C41. In the crystallization-inhibition papers it is inferred by comparing effectiveness ratios at two buffer concentrations (50 and 100 mM phosphate, pH 6.8), with buffer molarity standing in for ionic strength ilevbare2013b P13, X11; ilevbare2012a P12. In the Mesoporous silica papers the same salting-out logic is applied to adsorption: adsorption in distilled water, 0.1 M and 0.5 M NaCl, where a hydrophobic contribution should raise adsorption at higher ionic strength [dening2019 P4, C16; mccarthy2020 P10, C30].

Values in the library

None printed in the amorphous solubility and LLPS papers beyond the telaprevir onsets; the crystallization-from-solution and Mesoporous silica papers give the following.

materialvalue or classconditionspaper ids
HPMC on celecoxib; efavirenz6.45 → 10.15; 1.1 → 2.55 (50 → 100 mM)S 6.6; S 1.2ilevbare2013b R10
PVPVA on celecoxib; efavirenz7.6 → 7.4; 4.5 → 4.9sameilevbare2013b R10
eight polymer pairs on ritonavir1.1–2.6 → 1.7–4.8S 4.3 against 7.7ilevbare2012a R14
telaprevir GLPS onset (amorphous solubility chapter)lower in 100 than in 50 mM phosphate, attributed to hydrophobic aggregation37 °Clu2017b R9, C20
A5a, ECB, ECD with telaprevir and atazanavirdrug–CH3 RDF peaks about 25–36 at 0.4–0.5 nm against carboxylate peaks 10–23 at 1.6–2.6 nmMD, 10 nsmosqueragiraldo2018a R11, C35
HPMCAS grades with posaconazolehydrophobic drug–polymer interaction proposed to rise with acetyl content and lower pHnot measuredshah2025 C6, C48
ritonavir on SBA-15about 91–95, 162–182, 249–294 mg/g at initial 2.5, 7, 14 µg/mL; no significant salt effectwater, 0.1 and 0.5 M NaCl[dening2019 R9]
indomethacin; methyl ester on SBA-15about 0.8–0.9 and 8–9; about 11 and 65–76 mg/g at 2 and 8 µg/mL; no significant salt effectsame[mccarthy2020 R15]
Pitfalls and disagreements

The Log P of ritonavir is 5.6 in the table and 5.98 in the text ilevbare2013a X2. Buffer molarity, solubility and supersaturation change together in the pair test, and the growth rate without polymer at 50 mM is not reported ilevbare2012a X12; ilevbare2013b X11. The hydrophobic contribution for ritonavir rests on the SP trend alone ilevbare2013b X14. Mesoporous silica: the ritonavir salt series was run in unbuffered water, where adsorption was higher than in buffer [dening2019 X5]; the indomethacin series used equal concentrations, not equal activities, and an unstated pH [mccarthy2020 X9]. The formulation hydrophobicity invoked for high loadings was not measured [hate2020a C44]. The same salting-out test reads as a hydrophobic contribution for cellulose polymers on drug crystals ilevbare2013b R10, C48 but finds none for drug on silica [dening2019 R9; mccarthy2020 R15]; the chapters agree on the test and differ in its outcome for the two surfaces.

← Concepts and formulas

concept · as used in Dissolution

hydrophobic ion pairing

Evidence table: hydrophobic ion pairing. Content from the release-mechanism chapter (2024–2025), with rows from the Miscibility chapter.

The pairing of an ion with an oppositely charged amphiphile into a poorly soluble complex, driven by electrostatic attraction and hydrophobic interaction; ionic polymers form such insoluble complexes with oppositely charged amphiphiles bapat2024 C33, C34. In the release papers a lipophilic drug cation pairs with the ionized succinoyl groups of HPMCAS, and the pair reduces polymer hydration and release bapat2025a C5, C34. In the lumefantrine study of the Miscibility chapter the ion pair reduces the number of carboxylates available for hydration, so a polymer needing a high critical ionization cannot dissolve once part of its acid groups is paired hiew2022a C53, C57.

Findings

Release mechanism and LoC: F32, F33.

Related concepts

a form of drug-polymer ionic interactions; gives an insoluble drug-polymer complex; acts against the critical ionization for polymer dissolution.

Formulas

none.

How it is measured or obtained

Inferred from insoluble complex formation in buffer and from drug protonation by XPS; not measured directly in a gel bapat2024 P9, R8; bapat2025a C5.

Values in the library
materialvalue or classconditionspaper ids
cinnarizine, loratadine, clotrimazole with HPMCAS-MF70–90% of the polymer complexed at about 1:1pH 6.0bapat2024 R12
lumefantrine with CAP, HPMCP (Miscibility chapter)CAP needs ≈0.94 of its groups ionized against 0.88 left free; HPMCP slightly below 0.8325% loading, calculatedhiew2022a C57
Pitfalls and disagreements

Cinnarizine complexed beyond the 1:1 ratio expected for electrostatic pairing (plateau near 1.5:1), which the authors attribute "likely" to shielding by buffer ions bapat2024 C36. The neutral phenolphthalein also complexed HPMCAS, by hydrogen bonding in the authors' "conjecture", so not every complex is an ion pair bapat2024 C41.

← Concepts and formulas

concept · as used in Dissolution

hygroscopicity

How much water a material takes up at a given humidity

For HPMC grades at 21 °C: E3 3.22, E6 3.56, E50 3.43 and AFFINISOL 2.03% w/w at 40% RH; the polymer's hygroscopicity is held to set how much water a film takes up during formation and so the size of drug-rich domains [mugheirbi2017 R2, C23]. Solvents can be hygroscopic too: methanol takes up almost an equimolar amount of water at 50% RH [li2017 R26, C39]. In the coating papers hygroscopicity is a powder-level property read from dynamic vapour sorption of coated and uncoated particles; the abstract of the ezetimibe paper generalizes lower hygroscopicity to all coated powders, which only the thick coatings show [duong2022c C59, X6]. New aspect (Physical stability): for drug–polymer dispersions the polymer sets the hygroscopicity, because the drug is hydrophobic, so a dispersion takes up more water than the amorphous drug, the amount depending on polymer type and content [konno2008 C6, C18]. Nifedipine and its dispersions are more hygroscopic than felodipine's [marsac2008a C12]. New aspect (Release mechanism and LoC): since water-induced AAPS depends on the water absorbed, polymer hygroscopicity "likely" also matters for the limit of congruency; the congruent release of high-loading HPMCAS and EUDS dispersions "conceivably" reflects water uptake too low to induce AAPS saboo2020a C44.

Findings

ASD process: F4, F2, F44, F45, F49. Physical stability: F6, F11, F16, F23, F33, F35. Release mechanism and LoC: F8, F11, F12.

Related concepts

measured as water sorption and by water sorption isotherm; sets moisture-induced phase separation; drives plasticization by water; acts with hydrophobicity in the water–drug term. Ranks with wettability; drives amorphous-amorphous phase separation on hydration; related to polymer hydrophobicity.

Formulas

Flory-Huggins water sorption isotherm.

How it is measured or obtained

Gravimetric moisture sorption (SGA-100; 42–44 mg of as-received powder dried at 60 °C, equilibrated at 21 °C at 5, 7, 20 and 40% RH, n = 3) [mugheirbi2017 P14]. Gravimetric sorption isotherms of bulk dispersions at 25 °C [konno2008 P7; marsac2008a P6]. In the release-mechanism papers: gravimetric water sorption of neat polymers and amorphous felodipine at 37 °C from 5 to 95% RH, single runs; uptake of 40% HPMCAS dispersions at 100% RH extrapolated from isotherms saboo2020a R3, R18.

Values in the library
materialvalue or classconditionspaper ids
HPMC E33.22, 1.517, 0.48% w/w40, 20, 7% RH[mugheirbi2017 R2.a]
AFFINISOL2.03, 0.89, 0.19% w/w; about 63% of E3 at 40% RHsame[mugheirbi2017 R2.d, C21]
PVP, HPMC, HPMCAS (outside)PVP absorbs more water than HPMC, HPMC more than HPMCAS, at the same RH and temperature25 °C[rumondor2010a C6, R1]
ritonavir ASDs (outside)PVP and PVPVA are more hygroscopic than HPMCAS, so their ASDs are expected to be more prone to moisture-induced AAPSargumentpurohit2017b C45
polymer hygroscopicity and AAPS (outside)the water–drug contribution to the free energy of mixing depends on the water sorbed, which depends on polymer hygroscopicityfelodipine, indomethacin and others in PVP, PVPVA, HPMCASrumondor2010c C30
PVP, HPMC, HPMCAS, felodipine≈33.5, 10.9, 6.2, 0.7 g/100 g75% RH, 25 °C[konno2008 R8]
felodipine with 25% PVP, HPMC, HPMCAS≈4.7, 2.3, 1.7 g/100 g75% RH[konno2008 R9.d]
nifedipine vs felodipine with 25% PVP≈5.5 vs 4.6 g/100 g75% RH[marsac2008a R2]
felodipine–PVP vs HPMCAS dispersionsPVP dispersions more hygroscopic (cited)93% RH[rumondor2009b R25]
75:25 felodipine and quinidine with PVP, PVPVA, HPMCAS6.4/3.6/2.4 and 5.3/3.4/2.4 g per 100 g25 °C/85% RHrumondor2010c R18
PVP, PVPVA, HPMCAS alone≈50, ≈24, ≈8 g per 100 g at ≈85% RHcited isotherms, 25 °Crumondor2010c R19
40% resveratrol–PVP dispersion against its physical mixture≈12.8 against ≈36.5% at 95% RH25 °C[wegiel2013b R19]
PVP K29/32, K12, PVPVA, HPMC, HPMCAS; amorphous celecoxib≈68, 67, 48, 31, 12; ≈2.2 g/100 g at 95% RHDVS, 25 °C[xie2016b R12]
six tacrolimus capsule fills1.6–12.8% at 95% RH, most with the most croscarmelloseDVS, 25 °Ctrasi2017 R4, C16
PVP, PVPVA, HPMC, EUDS, HPMCAS≈34, ≈20, ≈9, ≈7.8, ≈5.9% at 75% RH; ≈71, ≈47, ≈28, ≈12.7, ≈10.2% at 95% RH37 °Csaboo2020a R3
amorphous felodipine≈1.3% at 75% RH37 °Csaboo2020a R3
40% HPMCAS dispersions of nilvadipine, felodipine, cilnidipine≈5.83, ≈5.67, ≈5.45% at 100% RH (extrapolated)37 °Csaboo2020a R18
Pitfalls and disagreements

Sorption of dry powders at equilibrium is a proxy for uptake during a seconds-long coating; no water was measured during coating [mugheirbi2017 X4]. Plotted against water content the polymers' nucleation rates fell together within scatter, but at similar water content 7% PVP still nucleated faster than 7% cellulose polymer [konno2008 C30, X4]. The uptake used to explain the polymer order was measured on 75:25 powders at 85% RH, not on the 50:50 test samples rumondor2010c X7. Hygroscopicity is not a variable of the 20-system model [rumondor2011 X5]. Water uptake did not rank celecoxib dispersions at 94% RH: PVPVA, with about twice the uptake of HPMCAS, lasted longer [xie2016b R13, R23, C50]. In tacrolimus capsules extra croscarmellose raised sorption but did not destabilize the innovator product trasi2017 C30. Water uptake separated the hydrophilic from the hydrophobic polymers but did not rank the limits within the hydrophilic group: HPMC takes up less water than PVPVA yet had the lower limit saboo2020a X7. The uptake was measured on neat polymers saboo2020a X7.

← Concepts and formulas

concept · as used in Dissolution

ideal mixing

Entropy-driven mixing of two amorphous components in the drug-rich phase with no heat of mixing, so that the chemical potential of each falls by RT\ln x and its amorphous solubility becomes the pure-drug value times its mole fraction in that phase trasi2015a C37, E2, E3, E4. Ritonavir and lopinavir are said to mix "nearly ideally" trasi2015a C40. The papers of 2017–2022 add the polymer case: in the ideal-mixing form S_a = S_a^{0}\,x_{drug} a polymer in the drug-rich phase lowers the amorphous solubility, but the authors note that a polymer's large molar volume and specific interactions make mixing non-ideal, and the volume-fraction Flory–Huggins form over-predicts the measured solubility of ibuprofen with PVP-VA and HPMC 603 ueda2021 E2, C28, C33. New aspect (Supersaturation from ASD dissolution): ideal mixing (cited) is applied to dissolving films and dispersions of two drugs: each drug reaches its amorphous solubility times its mole fraction in the amorphous mixture trasi2015b C38, E1. Li and Taylor draw the amorphous solubility scaled by drug weight fraction as "ideal behavior" for lopinavir mixed with an undissolved polymer; HPMCAS lay slightly above it, CAP near it at 15–50% and EC near it at 50–85% drug, HPMCP below it li2018 E7, C20.

Findings

Amorphous solubility and LLPS: F11, F19, F20, F21. Supersaturation from ASD dissolution: F11, F18.

Related concepts

lowers the chemical potential in the drug-rich phase; consequence for the amorphous solubility. Papers of 2017–2022: extended by the interaction term in the Flory-Huggins interaction parameter; requires drug-drug miscibility.

Formulas

ideal-mixing reduction of amorphous solubility.

How it is measured or obtained

The mole fraction in the drug-rich phase follows from mass balance of bulk concentrations after ultracentrifugation; a melting point depression of ritonavir by lopinavir greater than the Schröder–van Laar prediction is offered as confirmation (data not shown) trasi2015a P12, R17. For dissolving two-drug films and dispersions: film plateaus and ultracentrifuged dispersion concentrations against Eq. 1, with amorphous solubilities from the antisolvent study trasi2015b P6, P9, M1, M2.

Values in the library
materialvalue or classconditionspaper ids
ritonavir–lopinavirbulk ritonavir 3.0 → 21.4 µg/mL and lopinavir 15.2 → 4.6 µg/mL for x = 0.06–0.70; ritonavir 2–4 µg/mL above the line25 °Ctrasi2015a R16
ritonavir–lopinavir, 30 + 30 µg/mLpredicted about 10.8 and 10.1 µg/mL against 13.3 and 9.1 measuredextractor checktrasi2015a X9, R13
ibuprofen with PVP-VA, HPMC 603ideal Flory–Huggins: about 129 and 127 µg/mL at polymer ratio 1.0; measured about 89–106 µg/mL37 °Cueda2021 R12, R5
ibuprofen with PVP, PVP-VA, HPMCideal per-chain mole fraction of drug 0.97 or more at the highest ratios, against Sa/Sa0 of 0.52–0.54 (extractor calculation)15–60 °Cueda2022 X3, R17
RTV:LPV films 7:3 / 5:5 / 3:7RTV 15.2 / 11.4 / 6.3 against 16.7 / 11.6 / 6.8 µg/mLpH 6.8trasi2015b R5
HPMCAS dispersions, three ratiosRTV on the line; LPV on or up to about 15% below itultracentrifugedtrasi2015b R17, X8
lopinavir, ideal line at 50% drug17.4 × 0.50 = 8.7 µg/mLpH 3, 25 °Cli2018 E7
lopinavir with HPMCAS at 50% drug≈12.3 µg/mLpH 3, 25 °C, 48 hli2018 R3
Pitfalls and disagreements

Tested for one pair; no fit statistic; other pairs "are likely" to be non-ideal trasi2015a X9, C43. Later work draws the same ideal-mixing line for lopinavir–polymer dispersions li2018 E7. Used only qualitatively for polymers; the mole basis of the polymer is not stated ueda2022 X3. In the two-drug dissolution study the predictions use cited amorphous solubilities, and the pure films reached about 8% less trasi2015b X14; one nearly ideal pair was tested trasi2015b C39. The diagonal of the lopinavir–polymer study is proportional dilution by weight, not the χ = 0 case of the Flory–Huggins term, which with a large polymer would lie above it li2018 X2.

← Concepts and formulas

concept · as used in Dissolution

in situ salt formation

Evidence table: in situ salt formation. Content from the ASD dissolution chapter (delamanid 2022–2023).

Forming the drug salt in the same solution and evaporation or drying step that forms the dispersion, so that drug, counterion and polymer are processed together and the dispersion contains the protonated drug. It was used to keep a fast-crystallizing weak base amorphous at a drug loading at which the free base left crystals behind: the salts have a much higher Tg, and the authors "speculate" that protonating the piperidine ring keeps the long, thin molecules from lining up into a crystal duong2022a P8, C50. Salts inside dispersions were rare before, with meloxicam–meglumine and naproxen–meglumine formed during melt extrusion duong2022a C6. The counterion is added at a 1:1 molar ratio to the spray-drying or evaporation solution, and alcohols are avoided with sulfonic acids to prevent sulfonate esters nguyen2023b P1, C13; duong2022a C8.

Findings

F23, F25, F27.

Related concepts

raises the Tg of an amorphous salt; prevents residual crystallinity from preparation; limited by salt disproportionation and plasticization by water; read with crystallization tendency.

Formulas

none.

How it is measured or obtained

Salt formation is confirmed by the downfield shift of the protons at the basic nitrogen in the proton NMR spectrum and by a broad N+–H band in the infrared spectrum, with the free-base band gone; the solid is then characterized by PXRD, DSC and water sorption, and stored at 40 °C/75% RH duong2022a R16, R17, P6, P13.

Values in the library
materialvalue or classconditionspaper ids
eight delamanid sulfonate salts, neatseven amorphous, Tg 83.7–117.8 °C against 43.3 °C for the free base; water uptake 5.8–21.1% at 95% RH; four liquefied on storage2 weeks at 40 °C/75% RHduong2022a R20
delamanid edisylate 1:1 with excess acidTg 53.9 °C and 59% water uptake, against 117.8 °C and 11.6% for the 2:1 salt95% RHduong2022a R21
salt dispersions at 20% drug with HPMCASTg 100.4–117.0 °C against 86.7 °C for the free base; water uptake ≈10–13.6% against ≈8.2%95% RHduong2022a R23, R22
four salt dispersions at 25% drug with HPMCP against the free base≈95–97 against ≈20 µg/mL at pH 6.5; ≈85–91 against ≈55 µg/mL after a pH shifttablets, 100 µg/mL = completeduong2022a R26
delamanid edisylate dispersions with HPMCP, 10–40% drug≈99 / ≈98 / ≈95 / ≈59 / ≈21 µg/mL of 100PBS pH 6.5, 37 °Cduong2022a R24
chloride and edisylate dispersions with HPMCP-50, uncoated tablets≈86 and ≈93 µg/mL after a pH 1.6 stage against ≈62 µg/mL for the free basepH 1.6 → 6.5nguyen2023b R2
Pitfalls and disagreements

No PXRD of any salt dispersion and no storage data for salt dispersions appear in the main text, so the crystal-free state is asserted rather than shown, and the free-base and salt dispersions were cast from different solvents with an unstated drug-loading basis duong2022a X8, X7, X6. The salt does not stop crystallization where the polymer stays undissolved: salt dispersion films crystallized at pH 3.0 like the free base, and the salt "only partially remediated" the pH dependence nguyen2023b C17; nguyen2023c C20. Three of the four salts chosen for their stability liquefied at 40 °C/75% RH, and release of several salt dispersions was lower after an acid stage than in a single stage duong2022a X19, C63.

← Concepts and formulas

concept · as used in Dissolution

incomplete drug release

Release that stops below the dose although the drug has not crystallized; in the library it is the defining problem of drug-loaded mesoporous silica under supersaturating conditions [dening2018 C2, C1; dening2019 C1]. The papers attribute it to adsorption of dissolved drug back onto the silica, in a dynamic and partly irreversible equilibrium [dening2018 C4, C63; dening2019 C32; mccarthy2020 C52; hate2020a C5], with loading, wetting and pore filling as further causes [dening2018 C60; hate2020a C44, C45].

Findings

F7, F8, F9, F10, F11, F12, F13, F14, F15.

Related concepts

caused by drug adsorption onto silica in a dynamic adsorption-desorption equilibrium; contrasts with desupersaturation by crystallization; assessed by absorptive dissolution testing and membrane flux; depends on drug loading.

Formulas

supersaturation ratio, total release by mass balance.

How it is measured or obtained

Closed non-sink dissolution dosed at the amorphous solubility of the medium, with centrifuged or filtered samples over 1–4 h, against the nominal or assayed dose [dening2018 P6; mccarthy2020 P14; hate2020a P7; hate2020b P5]. Free drug by membrane flux against amorphous drug at the same concentration [dening2018 P12]. Recovery, XRPD and assay of the solid after release [dening2018 P9; mccarthy2020 P14]. Release with an absorptive compartment, by mass balance [hate2020a P9, E4].

Values in the library
materialvalue or classconditionspaper ids
ritonavir–SBA-15about 50% (dose at amorphous solubility), 70% (half)pH 6.8, 75 mL, 120 min[dening2018 R6]
ritonavir–SBA-15about 67 → 9% at 50 → 1000% of the amorphous solubilitypH 6.8[dening2018 R23]
ritonavir–SBA-1560–65% after dilution to S about 1; about 71% in FaSSIFpH 6.8; FaSSIF[dening2018 R18, R21]
lopinavir–SBA-1540–50%pH 6.8[dening2018 R19]
indomethacin; methyl ester, 50% monolayerS 7.2 of 15.3; 7.0 of 21.4; 58.8 and 61.8% retainedpH 2.2, HPMC[mccarthy2020 R20, R21, R23]
atazanavir–SBA-15, 20% w/wabout 46.5% closed; about 89.5% with an absorptive sink (240 min)pH 6.8, HPMC[hate2020a R20]
atazanavir–SBA-15, 5–50% w/wabout 73 / 80.5 / 66.5 / 52 / 36% in 90 minabsorptive, pH 6.8[hate2020a R15]
ketoconazole; clozapine; atazanavir, 20% w/wabout 55; 73.5; 40% at pH 6.8; 92; 93; 70% at pH 1 (60 min)HPMC[hate2020b R7, R8, R9]
ketoconazole; clozapine after pH 1 → 6.8about 64–69%; 68–69%HPMC[hate2020b R10, R11]
itraconazole–SBA-15 (outside the library)plateau about 55%simulated gastric fluid[dening2018 R28]

Evidence table: incomplete drug release.

Pitfalls and disagreements

Percent release depends on dose, medium volume and the drug content assumed: the ritonavir percentages rest on a nominal 28 µg/mL, and the dose masses imply about 22% instead of 25% w/w [dening2018 X5]; the indomethacin percentages do not reconcile across text, axes and dose [mccarthy2020 X5]. "Sink" in the dilution test means a total dose equal to the crystalline solubility [dening2018 X7]. "Complete release" with an absorptive sink was about 90% [hate2020a X10]. Release is not incomplete for every drug and medium: charged, soluble bases released 87–97% at pH 1–4.5 [hate2020b R7, R8]. The isotherm accounted for only about a twentieth of the atazanavir held back [hate2020a X14].

← Concepts and formulas

concept · as used in Dissolution

incongruent release

Polymer and drug leave the dispersion at different rates; above the limit of congruency the polymer leaves first, the undissolved solid becomes drug-rich and release slows moseson2021 C34, C58. For bicalutamide–PVPVA at 30% DL, PVPVA reached about 90% of its dose within 20 min while only about 30–60% of the drug dissolved in 4 h, and the undissolved solid went from PVPVA:BCL 7:3 to 1:1 within 5 min (computed from solution data) moseson2021 R25, R26, R17. Incongruent release can also come from a coating: in tablets of coated ritonavir–PVPVA particles slower hydration let phase separation outpace dissolution, which the authors describe as a lower effective limit of congruency benson2025 C34. New aspect (Release mechanism and LoC): above the limit of congruency the polymer leaves faster than the drug, and the ritonavir tablets show a transition loading (30%) that starts congruent and turns incongruent after about 40 min indulkar2019a R5, C3, C32. Humidity can make a congruent dispersion incongruent saboo2019 R9, C41. The papers of 2020–2022 add drug release that starts only after a lag while PVPVA dissolves from the start: from 30% lumefantrine benzoate about 20% of the polymer and almost no drug had been released at 30 min, "indicative of" incongruent release hiew2022b R13, C18; and incongruent release that develops after minutes when crystals cover the surface of a congruent compact saboo2020 R8, C17. Partly connected drug-rich domains at 40% MePHPH gave release that was not fully congruent: drug lagged polymer by 30 min and accumulated in the gel deac2023a C61, R1, R3.

Findings

ASD process: F27, F38, F40, F48. Release mechanism and LoC: F3, F6, F7, F8, F12, F19, F22, F25.

Related concepts

above the limit of congruency; produces surface drug enrichment; precedes matrix crystallization; with a drug-rich barrier layer.

Formulas

surface-normalized release rate.

How it is measured or obtained

Polymer by size-exclusion chromatography and drug by UV or HPLC against time; surface by SEM, IR, XPS or EDX after short exposures moseson2021 P14, R24; indulkar2019a R16, R17. In the release-mechanism papers: as for congruent release, from separately assayed drug and polymer saboo2019 R8.

Values in the library
materialvalue or classconditionspaper ids
BCL–PVPVA S/180 (crystal-free)PVPVA about 36 µg/mL at 2.5 min, about 58.8 µg/mL at 60 min (of 70)30 µg/mL BCL dosemoseson2021 R25
BCL–PVPVA M/155 (3.5% crystals)PVPVA about 54.6 µg/mL at 2.5 min, levelling at about 64samemoseson2021 R25
undissolved solid after 5 minPVPVA:BCL 1:1 (crystal-free), 1:2 (with residual crystals)computedmoseson2021 R26
ritonavir–PVPVA 50% DL tablet (outside)surface drug-rich after 5 minIR, SEMindulkar2019a C18, C41
nilvadipine and cilnidipine–PVPVA compacts (outside)XPS shows surface drug enrichment of incongruently releasing compacts, none for congruent ones10 minsaboo2019 C25
BCL–PVPVA 20 / 30% DLpolymer about 82 / 68% against drug about 33 / 18% at 10 min; ends about 88 / 86%dose of at most 30 µg/mL[moseson2022b R6, R7]
BCL–PVPVA 50% DLpolymer about 18% at 10 min and 80% at 2 h; drug plateau about 73% from about 120 minsame[moseson2022b R6, R7]
BCL–PVPVA 30% DL with 1.5% TPGSincongruent; about 54% (106–250 µm) at 30 min, about 93–94% at 4 hsame[moseson2022b R11, R13]
coated RTV–PVPVA 20% DL tabletsconnected drug-rich regions along particle boundaries; about 35–75% at 60 min at pH 6.8tabletsbenson2025 R10, R14
ritonavir–PVPVA 30%lag ~15 min; together to ~40 min; then PVPVA ≈96 against drug ≈48.5% at 120 minpH 6.8, 37 °Cindulkar2019a R5, R3
ritonavir–PVPVA 35%PVPVA ≈49 against drug ≈11% at 300 minsameindulkar2019a R6
nilvadipine 15:85, 20:80; cilnidipine 20:80, 25:75 in PVPVApolymer/drug rate ratio about 20, 40, 40, 105samesaboo2019 R5, R6
nilvadipine 10:90 compact after 12 h at 97% RH≈0.34% drug against ≈2.6% polymer in 15 minsamesaboo2019 R9
felodipine 15–30% in PVPdrug ≈0.005–0.020 against PVP ≈1.7–1.9 mg/min/cm²samesaboo2020a R14
indomethacin–PVPVA 15, 20, 25%drug ≈0.04, 0.02, 0.01 against PVPVA ≈0.72, 0.64, 0.50 mg/min/cm²5-min rates, pH 2.1, 37 °Csaboo2020 R3, M5
clopidogrel–PVPVA 60%drug ≈0.2 against PVPVA ≈4.1 mg/min/cm²compactscorreasoto2022a R18
atazanavir–PVPVA 10%drug ≈0.07 against PVPVA ≈0.24 mg/min/cm²pH 6.8, 37 °Ccorreasoto2022b R3, P5
lumefantrine benzoate–PVPVA 30%≈0 drug and ≈20% PVPVA released at 30 min; ≈8.5 and ≈50% at 90 mincompacts, 37 °Chiew2022b R13
Pitfalls and disagreements

The drug-rich layer is inferred from the shape of the PVPVA release curve and pitted surfaces, "presumably drug-rich"; its composition was not measured moseson2021 C32, C58. Incongruent release does not by itself doom a dispersion: a TPGS dispersion released incongruently yet completely because little solid was left when nucleation began [moseson2022b C50]. Polymer release was not measured in the ritonavir tablets, so the shift of the limit is inferred benson2025 X18. The 35% ritonavir tablet is placed with 30% in one passage and with 40–50% in another indulkar2019a X13.

← Concepts and formulas

concept · as used in Dissolution

insoluble drug-polymer complex

Evidence table: insoluble drug-polymer complex. Content from the release-mechanism chapter (2024–2025), with a row from the Physical stability chapter.

A precipitate of drug and dissolved polymer that forms when both meet in buffer at a pH where the polymer alone stays dissolved, so that polymer in the pellet marks a complex bapat2025a C9; bapat2024 C8. With HPMCAS it forms from lipophilic weak bases ionized at the gel pH, and from the neutral phenol phenolphthalein, and its low solubility is read as lowering the polymer's interfacial solubility and hence release ("likely largely accounts") bapat2024 C19, C32, C47. Bedaquiline complexes formed from pH 6.0–7.0 held the polymer's carbonyl band and disordered drug, and the drug in them was about half protonated, so the authors call them ionic rather than free base kaur2025 R11, C14, C35. The phenolphthalein–PVPVA drug-rich phase of the 2023 PVPVA work is read as an insoluble complex of the same kind (F27) deac2023b C43.

Findings

Release mechanism and LoC: F32, F33, F34, F17, F23.

Related concepts

formed by drug-polymer ionic interactions as a hydrophobic ion pairing product, or by hydrogen bonding of a phenol; a case of drug-polymer complexation; suppressed by micellar solubilization of the drug; lowers pH-dependent polymer solubility at the gel surface.

Formulas

percent polymer complexed.

How it is measured or obtained

Drug and polymer are dissolved together in THF and spiked into stirred buffer (0.5–1.0 mg/mL polymer, drug above its amorphous solubility), the pellet is removed by ultracentrifugation and the polymer left in the supernatant is assayed by HPLC or the phenol–sulfuric acid method; controls are drug alone (precipitates as drug) and polymer alone (stays clear) bapat2024 P9, R10; bapat2025a P9, R17; kaur2025 P7.

Values in the library
materialvalue or classconditionspaper ids
IND, INDester, RTV, CIL / PHPH, LOR, CNZ with HPMCAS-MF at 1:15–17% / 60, 70, 90% complexedpH 6.0, 50 mM phosphatebapat2024 R12
cinnarizine with HPMCAS-MF12% (0.125:1) to ≈99–100% (≥1.5:1)pH 6.0bapat2024 R11, R12
cinnarizine with HPMCAS LF; HF30 → 95%; 70 → 98% (0.25:1 → 2:1)pH 6.0bapat2025a R9
bedaquiline with HPMCAS LF; MF, highest ratio≈96 / 94.5% (pH 6.0) to ≈7 / 5.5% (pH 10.5)bufferskaur2025 R5, R7
bedaquiline with HPMCAS LF in FaSSIF-V1; FeSSIF-V2≈25; 17% against ≈58.5 and 90% in the blank buffersbiorelevant fluidskaur2025 R6, R5
lumefantrine–polymer granules (Physical stability chapter)complex "could conceivably" explain low release, set aside because 20% loading dissolved much betterrelease[trasi2020 C43]
Pitfalls and disagreements

The complex is measured in dilute buffer spiked from THF, at an unstated temperature or at 25 °C, not in a dissolving gel, so its link to release is a correlation across drugs and media bapat2024 X10, X13; kaur2025 X14. Complexation also fell in a stronger phosphate buffer at equal pH (about 70 to 48% for loratadine), which the authors take as a sign that the complex survives physiological ionic strength bapat2024 R16, C37, X11. The extent of complexation does not equal the loss of release: a "relatively low extent" can be "extremely detrimental" kaur2025 C45.

← Concepts and formulas

concept · as used in Dissolution

interfacial free energy

The free energy per unit area (or length of a step edge) of the interface between a crystal or nucleus and the solution; a lower value gives a smaller critical nucleus and faster nucleation or growth, and the authors use it to explain why SDS speeds felodipine growth schram2016 E3, C36. New aspect (Physical stability): more generally, the free energy cost per area of creating an interface between a new phase (a nucleus or crystal) and its surroundings; in classical nucleation theory the thermodynamic barrier to nucleation grows with its cube [konno2006 E8, C33; baird2012 E2]. Additives can raise it (a polymer layer at a nucleus) or lower it (surfactants) [konno2006 C39; schram2016 C36]. Crystal–solution interface (formerly the page "crystal-solution interfacial free energy", from Crystallization from solution): the free energy per unit area of the boundary between a crystal or a crystal nucleus and the surrounding solution, written γ; in classical nucleation theory it enters the nucleation rate as \gamma^{3} in the exponent, so a small change in γ changes the rate steeply duong2022b E6; indulkar2018 E6. In the solution-crystallization papers it is the quantity through which surface-active additives are proposed to speed nucleation: lecithin adsorbing on the growing nucleus ("possibly"), SDS hemimicelles on the crystal surface ("is hypothesized to play a role") and phospholipid digests ("it is postulated") indulkar2018 C40; indulkar2019b C33; enright2020 C26. This content comes from the papers of 2018–2022 in Dissolution / D. Crystallization from solution; the free energy per area of a three-dimensional nucleus is distinct from the edge free energy per length of a two-dimensional nucleus used for step pinning (the felodipine edge value below). Interfacial tension (formerly the page "interfacial tension", from Crystallization from solution and Supersaturation from ASD dissolution), the name several papers use for the same quantity: the free energy per area of the interface between a crystal (or a crystal nucleus) and the solution, γ. It enters classical nucleation theory through the barrier \Delta G^{*} and the Kubota–Mullin effectiveness factor α through the surface excess energy alonzo2012 E7; ilevbare2013c E4. A surfactant that adsorbs at the crystal–solution interface lowers it, which can speed growth when this outweighs blocking of kink sites ilevbare2012a C51. The polymer is said to lower the surface tension needed to form the drug-rich phase of danazol, and SDS to lower the interfacial energy of felodipine; neither was measured jackson2016 C36; schram2016 C36. The danazol statement concerns the boundary of a liquid drug-rich phase, not of a crystal (synthesis: the drug-rich phase forms by liquid–liquid phase separation). New aspect (Supersaturation from ASD dissolution): the interfacial tension between an embryonic crystal and a water-saturated supercooled drug liquid is expected to be lower than against dilute aqueous solution, which together with the higher drug concentration favours nucleation in drug-rich droplets ("not unreasonable") ilevbare2013d C40. It enters the printed nucleation rate of the felodipine study as γ konno2008a E3.

Findings

Crystallization from solution: F18, F22, F24, F34, F38, F39, F42. Physical stability: F4, F17. Supersaturation from ASD dissolution: F4, F13.

Related concepts

related to critical radius of a two-dimensional nucleus; general form of crystal-melt interfacial free energy; part of classical nucleation theory; sets the critical nucleus; related to kinetic barrier to nucleation, hemimicelle, mixed micelles, polymer-surfactant interaction, heterogeneous nucleation and drug-rich phase.

Formulas

critical radius of a two-dimensional nucleus (formula table only); classical nucleation theory, classical nucleation barrier, pre-exponential factor of classical nucleation theory, Kubota-Mullin impurity effectiveness factor. The critical nucleus radius r^{*} = 2\gamma\nu/(kT\ln S) follows from γ duong2022b E9.

How it is measured or obtained

For felodipine the edge free energy γ = 3.9 × 10⁻²⁰ J/nm came from water and ethylene glycol contact angles (Wu harmonic mean, angles not printed) schram2016 P9, R13, X10. Not measured in the solid-state physical-stability papers, where it enters arguments only [konno2006 C39]. In solution, values follow from linearized nucleation-rate data duong2022b E7. The crystal–solution value is not measured directly in the library. One paper obtained it from the slope of \ln(J/S) against 1/\ln^{2}S fitted to induction times converted into nucleation rates, with a molecular volume of 920 ų and T = 310 K, for posaconazole in buffer and three intestinal media duong2022b P15, E7. The other papers infer a change of γ from shorter induction times, from pyrene signals of adsorbed surfactant, or from a cited surface tension of a medium (32.6 against 54.4 mN/m) indulkar2019b R6, R7; enright2020 R32. Not measured in the crystallization-from-solution papers that call it interfacial tension. For paclitaxel the crystal–water value could not be determined and literature values of representative compounds were used que2018 C37. Surface tension measurements were used only to find polymer adsorption on seeds alonzo2012 P6. Not measured in the ASD dissolution papers either ilevbare2013d C40.

Values in the library
materialvalue or classconditionspaper ids
felodipine crystal edgeγ 3.9 × 10⁻²⁰ J/nm (contact angles, not printed); ρc 3.98 nm at S 425 °Cschram2016 R13, R14, X10
atazanavir in lecithin media; with lecithin, lyso-PC and oleatelecithin "possibly" lowers the interfacial energy between solute and emerging crystal; proposed to be lowered, more by the digests; not measured3 mM STC, pH 6.5; bile salt media, pH 6.5indulkar2018 C40, E6; enright2020 C26
felodipine with polymera polymer-rich layer at the nucleus "may also increase" the surface penaltyargument[konno2006 C39]
felodipine solution with SDSfaster growth explained by a lower interfacial energyS = 4schram2016 C36
felodipine–PVPVA–TPGSTPGS lowering the energy between separated phases slows coarseningASD hydrationsaboo2021 C40
flutamide prenucleiunfavourable interfacial term outweighs the volume term below a critical radiusframework[trasi2012b C46]
posaconazole, PBS pH 6.53.52 mJ/m²37 °C, fit of the high-supersaturation induction timesduong2022b R16
posaconazole, FaSSIF V1, FaSSIF V2, FeSSIF V12.61, 2.73, 3.24 mJ/m²; FeSSIF V2 not fittableas aboveduong2022b R16, R15
naproxen, acetaminophen, tolazamide, lovastatin, cefodizime sodium, prasugrel hydrochloride, spironolactone (cited)0.60–2.80 mJ/m²literatureduong2022b R18
atazanavir with SDS hemimicellesproposed to be lowered; not measured0.075–0.3 mg/mL SDSindulkar2019b C33, X4
felodipine–HPMCγ, a and L of eq 7 not givenKubota–Mullinalonzo2012 C27
surfactants on ritonavirgrowth about twice as fast with TPGS or Tween 80 at 5 µg/mLseeded, S 7.6ilevbare2012a R17, C51
paclitaxel critical radius 5–7 nmfrom literature surrogates of γS 88que2018 R15, C37
supersaturated drugs in surfactant mediasurfactants should lower γ and speed nucleation; human fluid slowed it insteadclassical nucleation theory, 37 °Celkhabaz2021 C20, C21
Pitfalls and disagreements

The interfacial energy in SDS or HPMCAS solution was not measured schram2016 X8. The solid-state papers use homogeneous theory although nucleation in the films is "most likely heterogeneous" [konno2006 C33]. The papers disagree on whether γ carries the medium effect: the posaconazole fits find no trend of induction time with γ and assign the effect to the pre-exponential factor, whereas the lecithin, SDS and digest papers assume a lower γ duong2022b C51, C52; indulkar2018 C40; indulkar2019b C33. The fits rest on 3–9 points per medium, and γ also falls in the induction-time order for three of four media, so a γ contribution is not excluded duong2022b X11, X12. The human-fluid paper notes that surfactants that lower γ should speed nucleation, while human fluid slowed it, and adds an attachment-rate term elkhabaz2021 C20, C22. In the celecoxib work on polymer combinations the differences between polymers were not attributed to interfacial tension, because polymer adsorption on the nucleus would lower it and raise the nucleation rate, the opposite of what was observed; the point is argued, not measured xie2015 C43. This is opposite in sign to the felodipine argument that a polymer-rich layer at the nucleus "may also increase" the surface penalty [konno2006 C39] (synthesis: two papers assume opposite effects of polymer on γ; neither measured it). The lower interfacial tension in droplets is an expectation, not a measurement ilevbare2013d C40. Interfacial tension with and without polymer was not measured, and the text cites the wrong equation for it xie2015 C43, X1. The same γ is reported per area (mJ/m²) for three-dimensional nuclei and per length (J/nm) for the step edge of a two-dimensional nucleus, so the two kinds of value are not comparable schram2016 R13; duong2022b R16 (synthesis: different units and geometry).

← Concepts and formulas

concept · as used in Dissolution

intramolecular hydrogen bonding

A hydrogen bond between two groups of the same molecule

It matters for polymer selection because it removes a donor or acceptor from the pool available to the polymer: the sulfonamide NH of nimesulide bonds to its own ether oxygen, which the authors say "considerably diminished" its capacity to bond to polymers and "most likely" explains why the polymers differ less than anticipated [kestur2011 C20, C27, C28]. Flufenamic acid holds its aniline N–H in a resonance-assisted hydrogen bond (N···O 2.682 Å in form III and 2.646 Å in form I, against a range of 2.66–2.74 Å for such bonds) and is therefore regarded as interacting only through its acid group [vaneerdenbrugh2010b R12, C12]. Further cases: the 5-OH and keto group of naringenin and the 5-OH and 3-OH of quercetin, which leave two and three phenolic OH groups free for the polymer [wegiel2013a M1, M2, C30]; the aniline N–H of flufenamic acid (DFT) and the energy profile of anthranilic acid, where one aniline hydrogen stays free [vaneerdenbrugh2011a R5, R6, C18]; and the OH of lumefantrine, bonded to its own nitrogen in the crystal hiew2022a R33, C61.

Findings

Miscibility and drug-polymer interactions: F14, F15, F17, F24, F25, F26. Physical stability: F18, F24.

Related concepts

part of hydrogen bonding; limits drug-polymer interactions and hydrogen-bond donor and acceptor groups; contrasts with self-association; makes acid-base interaction the alternative [wegiel2014 C44].

Formulas

none.

How it is measured or obtained

By a donor band that stays at the same wavenumber on a 100-fold dilution in a non-polar solvent (nimesulide NH at 3345 cm⁻¹, 1–100 mg/ml); by no change on adding a strong acceptor or donor (1-ethyl-2-pyrrolidinone, acetic acid); by comparing the band of the amorphous and crystalline forms; by crystal structure and DFT geometry [kestur2011 R10, R11, R12, R17, R19]. For flufenamic acid, from N···O distances in two crystal structures [vaneerdenbrugh2010b P11, R12]. By a conformer energy profile of the single molecule in vacuum [trasi2012b P9, R24]; by an IR band of the amorphous drug that matches the intramolecularly bonded form of the crystal [wegiel2014 R2, C11].

Values in the library
materialvalue or classconditionspaper ids
nimesulideNH 3345 cm⁻¹ at 1–100 mg/ml in dichloromethane; unchanged with added acid or lactamIR, 100 µm cell[kestur2011 R11, R17]
nimesulideNH ≈3288 (crystal), ≈3276 cm⁻¹ (amorphous)KBr; spin-coated film[kestur2011 R12]
flufenamic acidN···O 2.682 Å (form III), 2.646 Å (form I)crystal structures[vaneerdenbrugh2010b R12]
flutamide; curcumin (other chapters)intramolecular CH···O leaves a poor acceptor; intramolecular bond limits polymer bondingcalculation; IR, stability[trasi2012b C35; wegiel2014 C3]
naringenin, quercetin5-OH to keto O (both); 3-OH to keto O (quercetin); PVP still bonds the free OH (OH band 3138 and 3135 cm⁻¹)structure; IR[wegiel2013a M1, M2, R2]
anthranilic acidenergy about 31–33 kJ/mol up to 30° (acid O–H to N), about 50 at 80–90°, about 0 at 180° (N–H to carbonyl O); no bifurcated bondDFT dihedral scan[vaneerdenbrugh2011a R6, C18]
lumefantrineOH···N bond in the crystal; no PVPVA carbonyl shiftcrystal structures (cited); IRhiew2022a R33, R17
flutamideplanar lowest-energy conformer with the carbonyl next to C(5)–H; second minimum ≈2.7 kJ/mol higher; barriers ≈23 kJ/molDFT, vacuum[trasi2012b R23, R24]
flutamide crystalamide carbonyl in a bifurcated bond, one contact intramolecularcited structure[trasi2012b R26]
amorphous curcuminketo–enol band at 1626 cm⁻¹ as in the crystal; no carbonyl band near 1700 cm⁻¹IR[wegiel2014 R2, C11]
curcumin against resveratrol with PVPbonded PVP carbonyl dominant only at 60% curcumin, already at 50% resveratrolIR of films[wegiel2014 R8, R9, C32]

Evidence table: intramolecular hydrogen bonding.

Pitfalls and disagreements

For the amorphous state the evidence is that a broad band lies near the crystal's, and the crystal contains an intermolecular NH bond too [kestur2011 R19, R12]. The NH maximum shifts as much with PVAc as with PVP in the films, which weakens the argument that the intramolecular bond alone sets the polymer ranking [kestur2011 X16]. The treatment of flufenamic acid as purely acidic is an assumption supported by crystal geometry, not by a spectrum in the films [vaneerdenbrugh2010b C12]. An intramolecular bond limits but does not exclude polymer bonding when other donors remain (naringenin and quercetin bonded PVP strongly) [wegiel2013a R2, R4]. Whether the lumefantrine OH bond persists in the dispersion was not measured hiew2022a C61. No curcumin analogue without the intramolecular bond was tested, and within the curcumin paper PVP still gave the largest shifts [wegiel2014 X13]. For flutamide the bond in the glass is inferred from a vacuum calculation, and PAA's failure may reflect poor mixing instead [trasi2012b C35, X12].

← Concepts and formulas

concept · as used in Dissolution

intrinsic dissolution rate

Evidence table: intrinsic dissolution rate. Content from the release-mechanism chapter (2018–2022) and two papers of the ASD process and Peptide permeability chapters.

The dissolution rate per unit area of a compact of one pure material, with one face of fixed area exposed; for a dispersion each component's rate divided by its weight fraction gives the rate per area "as if it were the pure material" bhardwaj2018 R4; saboo2020a E3. Bhardwaj and co-workers equate the ratio of the intrinsic dissolution rates of two solid forms with the ratio of their solubilities, carried over from polymorphs to amorphous against crystalline ITZ ("should be the same") bhardwaj2018 E3, C45.

Findings

Release mechanism and LoC: F1, F2, F11, F15, F18, F24.

Related concepts

basis of congruent release read-outs; related to the Noyes-Whitney equation; sets the ceiling of polymer-controlled release.

Formulas

surface-normalized release rate, ratio of intrinsic dissolution rates and of solubilities.

How it is measured or obtained

Compacts of 25–100 mg in an 8 mm die (face ~0.5 cm²), Wood's apparatus or a backed die, rate from the initial linear slope bhardwaj2018 P6, P7; saboo2019 P9, E4; saboo2020a P6. In the papers of 2020–2022 the neat PVPVA compact is run beside every series as the reference rate saboo2020 R3; correasoto2022a R18; correasoto2022b R3. The same surface-normalized rotating-disk method gave the dissolution rates of the enteric polymer HP-50, its salts and its miconazole dispersions qi2022 P10.

Values in the library
materialvalue or classconditionspaper ids
crystalline ITZ; melt-quenched ITZ2.8 ± 0.2; 51 ± 2 µg/min/cm² (ratio ≈18)0.1 N HCl, 37 °C, 300 rpmbhardwaj2018 R4, R5
PVPVA as received10.4 mg/min/cm² over 4.5 min (8.1 cited)samebhardwaj2018 R9, R10
PVPVA; amorphous nilvadipine3.49 ± 0.07; 0.002 mg/min/cm²pH 6.8, 100 rpm, 37 °Csaboo2019 R5
PVP, PVPVA, HPMC, HPMCAS, EUDS; amorphous felodipine≈3.6, ≈3.4, ≈0.37, ≈0.77, ≈0.23; ≈0.0008 mg/min/cm²pH 6.8 (EUDS 7.4)saboo2020a R13
OCA, SNAC, PVPVA (Peptide permeability)OCA about twice SNAC; neat OCA above neat PVPVApH 6.8, 0.5 cm²bapat2025b C2, C12
amorphous ritonavir against 20% ritonavir–PVPVA (ASD process, cited)amorphous drug significantly sloweras citedbenson2025 R24
neat PVPVA (indomethacin; ester series)≈3.4; ≈3.8 mg/min/cm²5-min rates, 37 °Csaboo2020 R3
neat PVPVA≈2.6–2.7 mg/min/cm²compactscorreasoto2022a R18
neat PVPVA at 37 and 55 °C≈2.7; ≈3.7 mg/min/cm²compactscorreasoto2022b R7
neat PVPVA at 37 and 5 °C≈3.45; ≈1.68 mg/min/cm²compactsyang2021 X16, R21
HP-50; nine HP-50 salts≈0.92; ≈2.35–3.09 mg/min/cm²compacts, 50 mM pH 6.8 phosphate, 37 °Cqi2022 R10
HP-50-BIS-TRIS, 20–100 mol% base≈1.22 → 2.93 mg/min/cm²sameqi2022 R13, X9
Pitfalls and disagreements

The neat PVPVA values differ with medium, paddle speed and compact mass (10.4, 3.49 and ≈3.4 mg/min/cm²), and an extractor check of the 2020 curve gives ≈1.7 bhardwaj2018 R9; saboo2019 R5; saboo2020a X10. The visible part of the 2018 PVPVA curve corresponds to about 8 mg/min/cm² bhardwaj2018 X8. The amorphous-to-crystalline ITZ solubility ratio behind the rate ratio was not measured bhardwaj2018 C45. Packed particles present a renewed surface, so the rate reflects layers of particles bhardwaj2018 C64. Ueda 2024 (p. 44) exclude these rate methods from measuring the amorphous solubility: intrinsic dissolution rates of multicomponent systems do not reflect it, because of their phase behavior, and those of crystalline poorly soluble drugs are typically inaccessible.

← Concepts and formulas

concept · as used in Dissolution

intrinsic solubility

The solubility of the neutral (un-ionized) form of an ionizable drug in equilibrium with its stable crystal; in the pH-titration work it is the neutral-species concentration at the point where the pH gradient crosses zero, so that there is no net dissolution or precipitation hsieh2012 C6, C11. The 2014 paper uses the heading "intrinsic solubility" for the crystalline solubility of the neutral form measured with or without polymer hsieh2014 R4.

Findings

F1, F2, F19.

Related concepts

equals the crystalline solubility of the neutral form; related to ph-dependent solubility and pH-induced precipitation.

Formulas

Bjerrum function.

How it is measured or obtained

From the CheqSol titration at 37 °C and 0.15 M KCl, and by 72 h shake-flask runs at least two pH units above the pKa with HPLC after ultracentrifugation, to compare the two hsieh2012 P4, P11. For the polymer series, 72 h shake-flask runs at 25 °C in pH 10 or pH 2 buffer with or without 1 mg/mL polymer hsieh2014 P5.

Values in the library
materialvalue or classconditionspaper ids
bifonazole; dipyridamole; droperidol; papaverine; pyrimethaminetitration 0.3; 5.7; 3.1; 17.2; 25.4 µg/mL against HPLC <1; 4.0 ± 0.5; 4.1 (30 °C); 20.6 ± 0.5; 25.0 ± 0.437 °Chsieh2012 R5
carvedilol; clotrimazole; clozapine; ketoconazole; loratadineHPLC 1.1; 0.4; 8.8; 3.7; 1.6 µg/mL37 °Chsieh2012 R10
papaverine, dipyridamole, warfarin12.2, 5.4, 3.7 µg/mL; glyburide 0.2 (titration)25 °C, no polymerhsieh2014 R4
papaverine with HPMC; HPMCAS-LF; HPMCAS-HF20.9; 21.9; 19.0 µg/mL1 mg/mL polymerhsieh2014 R4.d–f
posaconazoleC_o in the diprotic Henderson–Hasselbalch fit; crystalline 0.27 and amorphous 8.92–9.20 µg/mL where unionized (pH 5.5–7.0)37 °C, 0.14 Mduong2022b E4, R1
Pitfalls and disagreements

Droperidol degraded in the 72 h run at 37 °C, so a literature value at 30 °C is used hsieh2012 X15. Titration and HPLC values agree for type 1 bases ("good agreement") hsieh2012 C11. The glyburide value of 0.2 µg/mL lies below the HPLC limit of about 1 µg/mL and was assumed for all polymers hsieh2014 X9, X10.

← Concepts and formulas

concept · as used in Dissolution

ionization

The fraction of a drug that carries a charge at the pH of the medium, set by the pKa through the Henderson–Hasselbalch equation. In this chapter the un-ionized concentration is what the amorphous solubility limits: "LLPS cannot occur until the concentration of the un-ionized form is exceeded", so more total drug is needed at lower pH for a base indulkar2015 C47. An ionized second solute does not mix into a hydrophobic drug-rich phase trasi2015a C44. The papers of 2017–2022 add pazopanib (strongest basic group pKa 6.4): fully ionized in gastric fluid and essentially un-ionized at pH 8.4, with a crystalline solubility that falls by more than four orders of magnitude between pH 1.2 and 6.5 sugihara2018 M1, C9, C19. New aspect (Bioperformance): only the unionized free drug is thought to cross a membrane passively [raina2015c C49]. In a PAMPA receiver at pH 3 atazanavir (pKa 4.48) ionizes on crossing and keeps the receiver free drug near zero [hate2022 C52]. Most model drugs of the Bioperformance papers were unionized or nearly so at the pH used (synthesis: from the table rows below). New aspect (Crystallization from solution): In the pH-shift studies the ionization of a weak acid or base sets the supersaturation: raising the pH of a base (or lowering that of an acid) beyond the pKa leaves the less soluble neutral form above its crystalline solubility; the final pH was at least two units beyond the pKa hsieh2012 C1; hsieh2014 P2. In the growth and nucleation papers the ionization of the polymer matters instead: the carboxylated cellulose esters are nearly fully ionized at pH 6.8 and less than 25% ionized at pH 3.8, whereas the drugs are un-ionized at both (see polymer ionization) ilevbare2013b R18, C33. Media were chosen to keep 11 drugs un-ionized (naproxen about 18%, indomethacin about 9% and compound 1 about 20% still ionized by the card's arithmetic); celecoxib is about 7.5% ionized at pH 10 and flibanserin 80% un-ionized at pH 6.5 chen2015 C6, X3; li2016a R3. New aspect (Release mechanism and LoC): ionization of the dispersion polymer rather than the drug. For the enteric polymer HP-50, partially neutralized BIS-TRIS salts dissolved more slowly as ionization fell from 100 to 20%, with the largest drop, almost 2-fold, from 100 to 80% qi2022 C21, R13; the series "confirms" the importance of the ionized form, and the critical ionization of about 83% estimated for HP-50 "may explain" the drop qi2022 C36. Polymer solubilization via ionization, linked to transport of protons across the boundary layer, is called the rate-limiting step of HP-50 dissolution qi2022 C2. For weak bases with HPMCAS the 2024–2025 papers compute ionization at the gel pH from pKa: at pH 6.0 HPMCAS about 96% (printed), cinnarizine above 99%, clotrimazole 46% and loratadine 14%; loratadine complexation fell with its calculated ionization from about 20% (pH 5.8) to 0.5% (pH 7.5) bapat2024 R19, X4; bapat2025a R13, C32. Bedaquiline was about half protonated (55 ± 4%) in its complex with HPMCAS and in a dry dispersion (52 ± 7%) by XPS kaur2025 R20.

Findings

Amorphous solubility and LLPS: F10, F11, F13, F14, F23. Bioperformance: F1, F11, F22, F26. Crystallization from solution: F1, F2, F11, F16, F28, F29, F44. Release mechanism and LoC: F24, F32, F33.

Related concepts

quantified by pKa; gives pH-dependent solubility; calculated with the Henderson-Hasselbalch equation; sets the amorphous solubility in total-concentration terms. Related to pH-shift dissolution and polymer dissolution pH threshold. Related to polymer ionization and pH-induced precipitation; of the polymer: critical ionization for polymer dissolution. Of the polymer: critical ionization for polymer dissolution, polymer salt formation, microenvironmental pH.

Formulas

Henderson-Hasselbalch equation, pH-solubility profile. Amorphous solubility advantage with water-sorption correction (ionization term).

How it is measured or obtained

Calculated from the pKa and the pH; the pKa of atazanavir was measured by UV-metric titration in 0.15 M NaCl at 37 °C, the others were taken from the literature or predicted indulkar2015 P2, E1. In the Bioperformance papers the ionization is taken from the pKa and not measured: felodipine pKa below 2 and nifedipine below 3.5 at pH 6.8 [raina2014a C9, E4]; ezetimibe phenol 9.72 [elkhabaz2017 C6]; nevirapine 2.8 [hate2017 C8]; clotrimazole about 6, 99% unionized at pH 8 [indulkar2016 C8]; atazanavir 4.52 or 4.42 [hate2018 C15, X1]. In the pH-shift studies: pKa by UV-metric titration (and cosolvent extrapolation for the poorly soluble bases) at 37 °C and 0.15 M KCl; the neutral-species concentration by mass and charge balance hsieh2012 P1, P2, P3, P4. In the release-mechanism papers: degree of ionization set by the amount of base used to make the partial salt, not measured qi2022 X9. Henderson–Hasselbalch from pKa kaur2025 E2; bapat2025a P11; XPS N 1s with a protonated component near 402 eV kaur2025 R19; bapat2024 R8.

Values in the library
materialvalue or classconditionspaper ids
clotrimazole98.7% ionized at pH 4; 0.8% at pH 8pKa 5.89indulkar2015 R18
atazanavir90.9% ionized at pH 3.5 (91.3% recalculated); 0.0% at pH 9pKa 4.52indulkar2015 R18, X4
nicardipine94.1% at pH 6; 0.9% at pH 9 (1.6% recalculated)pKa 7.2indulkar2015 R18, X4
ritonavirun-ionized at pH above 7.0pKa 1.8 and 2.6ilevbare2013a C13
diclofenacionized at pH 6.8; did not mix with the ritonavir-rich phasepKa 4.2trasi2015a M5, R11
CRH1un-ionized and ionized equal at equilibrium at pH 4.6pKa 4.6almeidaesousa2016 C13
pazopanibdissolves in SGF (pH 1.2); essentially un-ionized at pH 8.4pKa 6.4sugihara2018 C9, C19
felodipine, nifedipineionization term set to 1pH 6.8[raina2014a C9]
clotrimazoleabout 99% unionizedpH 8[indulkar2016 C8]
ezetimibebuffer solubility measured at pH 2 because of degradation at neutral pH[elkhabaz2017 C9, X5]
atazanavir, clotrimazoleamorphous solubility rises as pH falls toward the pKa; ratio constantindulkar2015 C46
atazanavirpH 3 receiver acts as a sink like 2% SDSPAMPA, pKa 4.48[hate2022 C52, R15]
bifonazole; carvedilol; clotrimazole; clozapine; dipyridamolepKa 6.22; 7.75; 5.89; 3.83 and 7.54; below 1 and 6.0837 °C, 0.15 M KClhsieh2012 M1–M5
droperidol; ketoconazole; loratadine; papaverine; pyrimethaminepKa below 2, 7.38 and 10.96; 3.16 and 6.13; 5.26; 6.29; 7.07samehsieh2012 M6–M10
papaverine; dipyridamole; glyburide; warfarinpKa 6.4; 6.2 and 0.8; 4.9; 5.325 °Chsieh2014 M1–M4
final pH of the 2014 pH shifts8.4–9.0 (papaverine), 8.2–9.0 (dipyridamole), 1.9–2.9 (glyburide), 2.2–3.3 (warfarin)1 mg/mL polymerhsieh2014 R4
naproxen, indomethacin, compound 118%, 9%, 20% ionized (extractor arithmetic)pH 3.5, 3.5, 4chen2015 X3
posaconazolepKa 3.6 and 4.6 (cited); unionized at pH 5.5–7.5; crystalline 0.31–0.34 µg/mLFaSSIF-V2 buffer, 37 °Cshah2025 M1, R1, C9
posaconazolefitted pKa 3.53 and 1.24 at 37 °C, 0.14 M; crystalline 0.27 (pH 7.0) to 347 µg/mL (pH 1.0)phosphate buffers pH 1.0–7.0duong2022b R2, R1
HP-50-BIS-TRIS, 20–100 mol% baserate ≈1.22 → 2.93 mg/min/cm²50 mM pH 6.8 phosphate, 37 °Cqi2022 R13
cinnarizine in HPMCAS-MF 25%protonated 0 (neat), 20 (dry dispersion), 11% (after partial dissolution)XPS N 1sbapat2024 R8
bedaquiline: free base, complex, dry 40% dispersion4, 55, 52% protonatedXPS N 1skaur2025 R20
HPMCAS and bedaquiline at pH 6.0 and 5.891.5 / 88.1% and above 99% ionizedHenderson–Hasselbalchkaur2025 R21, X18
Pitfalls and disagreements

Loratadine (pKa 5.0) may be partly ionized at the final pH 4–6 of the pH-shift runs, although the paper calls it un-ionized ilevbare2013a C13, X9. Two printed percentages in the weak-base table do not match their pKa indulkar2015 X4. The atazanavir pKa is printed as 4.52 or 4.42 in one card and as 4.48 in the PAMPA study [hate2018 X1; hate2022 C52]. Dipyridamole's pKa is "<1" in one table and 0.8 in the model inputs hsieh2012 X10. The charge of the polymer at the final pH (cationic Eudragit E100 at pH 2–3, anionic polymers at pH 8–9 with the bases) was not varied independently hsieh2014 R4. The plotted quantity is mol% BIS-TRIS added, read as % ionization, and the 0% point is HP-50 in sodium phosphate buffer, not a salt qi2022 X9. Several printed ionization values do not reproduce from the stated pKa (HPMCAS 96% printed against about 93%; 88.1% for HPMCAS at pH 5.8) bapat2024 X4; kaur2025 X18.

← Concepts and formulas

concept · as used in Dissolution

kinetic barrier to nucleation

The activation energy for moving molecules across the nucleus–matrix interface, \Delta G_a in classical nucleation theory, related to diffusivity or reciprocal viscosity; distinct from the thermodynamic barrier set by interfacial energy and driving force [konno2006 E8, C33; marsac2006a E9, C31]. Experimentally the Arrhenius activation energy of the nucleation rate is used as its measure [marsac2006a R3, E2].

Findings

F1, F2, F4.

Related concepts

part of classical nucleation theory; contrasts with thermodynamic driving force for crystallization; related to molecular mobility and polymer rejection at the crystal growth front.

Formulas

classical nucleation theory, Arrhenius equation.

How it is measured or obtained

Not measured directly; nucleation rates at several temperatures give an Arrhenius slope, taken separately above and below Tg [marsac2006a P5, R2, R3]; otherwise argued from the size of a polymer effect at low content [konno2006 C40, C41].

Values in the library
materialvalue or classconditionspaper ids
nifedipine, felodipineactivation energy below Tg 122 (11) and 145 (3) kJ/mol; above Tg 78 and 95Arrhenius, ≈25–75 °C[marsac2006a R3]
with 3 wt% PVPbelow Tg 127 and 201; above Tg 103 and 111 kJ/molsame[marsac2006a R3.c, R3.d]
felodipine with 3–25% PVP, HPMCAS, HPMCspeculated rise of ΔGa, set by amount rather than type of polymer22 °C, dry[konno2006 C40, C41]

Evidence table: kinetic barrier to nucleation.

Pitfalls and disagreements

The Arrhenius plot carries no rate unit and its temperatures are given only by the axis; the activation-energy difference between the two drugs is significant only below Tg, a restriction the abstract drops [marsac2006a X2, X6]. The polymer-raised barrier is speculation ("it seems reasonable to speculate") [konno2006 C40].

← Concepts and formulas

concept · as used in Dissolution

kinetic stabilization

Stabilization of an amorphous drug against crystallization by slowing the process (molecular mobility, nucleation, interfacial factors) while the thermodynamic driving force stays large. Marsac and co-workers conclude from a small predicted reduction of the driving force, a low predicted solubility in PVP and the faster nucleation of the pure drugs that inhibition "can therefore be attributed predominantly to a kinetic stabilization"; molecular-level miscibility is "of critical importance" because it alters "thermodynamics and, more importantly, dynamics" [marsac2006b C41, C42, C55, C56, C59]. The same group states that thermodynamically stable dispersions are hard to achieve and that apparent stability is "most likely achieved through modification of the kinetics" [marsac2009 C34]. For the growth of felodipine with PVP the effect "is believed to be kinetic rather than thermodynamic" [kestur2010b C28].

Findings

F9.

Related concepts

contrasts with thermodynamic driving force for crystallization; depends on drug solubility in polymer; related to crystallization inhibition and amorphous solid dispersion.

Formulas

Hoffman equation.

How it is measured or obtained

Not measured directly in this chapter. It is inferred by elimination: the thermodynamic estimates (Hoffman driving force, predicted solubility) are small or low, while the dispersions stay amorphous [marsac2006b R12, R17, X12; marsac2009 R11, X17]. Kinetic quantities (nucleation rates, mobility) are cited from a companion study or not measured [marsac2006b R16, C59].

Values in the library
materialvalue or classconditionspaper ids
nifedipine with 40% PVPdriving force −7.95 against −9.0 kJ/mol pure at 20 °CHoffman[marsac2006b R12]
nifedipine, felodipine in PVPpredicted solubility 0.06–0.07 and 0.25–0.31 g/gFlory–Huggins[marsac2006b R17]
five compounds in PVP K29/3282–99% of the drug above solubility at 0.50 polymerpredicted[marsac2009 R11]
pure nifedipine and felodipine against their dispersionsnucleation much faster for the pure drugscited[marsac2006b R16]

Evidence table: kinetic stabilization.

Pitfalls and disagreements

The kinetic reading is an inference: no crystallization, nucleation or mobility data are reported in either paper [marsac2006b X12; marsac2009 X17]. Being below the estimated solubility did not make PEG dispersions stable, which points to nucleation by the carrier as another route [zhu2012 X13]. A small dissolved fraction may explain why crystallization of a dispersion is not always complete [marsac2009 C35].

← Concepts and formulas

concept · as used in Dissolution

lever rule

Evidence table: lever rule. Content from the release-mechanism chapter (2023–2025), with rows from the Physical stability chapter.

The rule that gives the relative amounts of two coexisting phases from the position of the overall composition on the tie line joining them: the ratio of the amount of phase A to phase B equals the ratio of the lengths BX to AX [yang2022b E1]. In the Physical stability chapter it was used on a schematic ritonavir–PVPVA–water diagram to argue that relative phase amounts set bicontinuous or discrete morphology along different hydration paths [yang2022b C50]. In the 2023 phenolphthalein-analogue paper the majority phase after separation is the binode closer to the initial composition: a polymer/drug ratio above the plait point gives a majority hydrophilic phase with discrete hydrophobic domains, one below it a majority hydrophobic phase, and the hydrophobic-phase volume against drug load is "approximately" a step function with the step at the plait point deac2023b C34, C36. Used quantitatively in 2024: along a hydration path at constant drug-to-polymer ratio the lever rule at the spinodal gives the mass fraction of drug-rich phase, W^{\alpha} = (W_i^T - W_i^{\beta})/(W_i^{\alpha} - W_i^{\beta}), taken as continuous above 0.5 deac2024b E12, P20, C51; in 2023 it was used on a schematic ritonavir diagram with and without SDS yang2023 E2, C41.

Findings

Release mechanism and LoC: F27, F30, F31.

Related concepts

needs a tie line on the ternary phase diagram; its step lies at the critical point; decides phase inversion.

Formulas

lever rule.

How it is measured or obtained

Applied in 2022 and 2023 to schematic ternary diagrams only; no tie line was measured in those papers [deac2023b E5, X14; yang2022b E1]. In 2024 applied to computed PC-SAFT diagrams deac2024b E12, P20.

Values in the library
materialvalue or classconditionspaper ids
ritonavir–PVPVA–water, schematic (Physical stability chapter)relative phase amounts set bicontinuous against discrete morphologyargument only[yang2022b C50]
phenolphthalein analogue–PVPVA–water, schematichydrophobic-phase volume steps at the plait pointargument onlydeac2023b C36
MePHPH–PVPVAW^{\alpha} ≈0.15 at 27% → ≈0.82 at 39.5%PC-SAFT diagram, spinodal onsetdeac2024b R35
PHPH–PVPVA≈0.16 at 3.0% → ≈0.82 at 4.5%samedeac2024b R35
Pitfalls and disagreements

The 2023 use assumes complete separation to the binodal compositions as soon as the hydration path enters the two-phase region deac2023b E5, and on phases reaching equilibrium as fast as water penetrates, the local equilibrium assumption deac2023b C38. No computed MePHPH point lies between 27 and 39.5% except the critical point, and the fraction comes from the model only deac2024b X8, X16.

← Concepts and formulas

concept · as used in Dissolution

light scattering by particles

Particles suspended in a solution remove light from a beam by scattering and, if they absorb, by absorption; the sum is the extinction. Small particles scatter more at short wavelength (Tyndall effect), larger ones give a flatter, wavelength-independent baseline [vaneerdenbrugh2011b C28, C16, C37]. Extinction measured where the drug does not absorb is used as a read-out for a new phase, which may be crystals or a liquid [raina2015a C9].

Findings

F1, F2, F3, F11.

Related concepts

part of extinction; contrasts with particle absorption of light; related to liquid-liquid phase separation and Mie theory.

Formulas

attenuation coefficient from particle cross-sections, extinction cross-section as sum, Mie theory, scattering baseline correction of UV absorbance.

How it is measured or obtained

Fiber-optic UV/Vis spectra (200–700 nm, 1 cm transflectance dip probes) of suspensions [vaneerdenbrugh2011b P9]; extinction at 450 nm by a dip probe during drug addition or dissolution [raina2015a P6; tres2018 P8]; Mie calculation of the extinction of spheres [vaneerdenbrugh2011b P11].

Values in the library
materialvalue or classconditionspaper ids
felodipine nanosuspensionabsorbance at 425 nm ≈0.10, 0.26, 0.45, 0.5510, 25, 40, 50 µg/mL total, 25 °C[vaneerdenbrugh2011b R3]
felodipine, jetmilledabsorbance at 425 nm ≈0.011 to ≈0.04610 to 50 µg/mL total[vaneerdenbrugh2011b R4]
nonabsorbing spheresextinction at 276 nm ≈0.01 (30 nm) to ≈0.93 (300 nm)Mie, 50 µg/mL, 1 cm[vaneerdenbrugh2011b R13]
ritonavir, 10% and 50% dispersionsextinction at 450 nm ≈0.51 (3 min) against ≈0.01–0.02non-sink dissolution[tres2018 R7]
lopinavir, 10% and 50% dispersions≈0.70 (54 min) against ≈0.01same[tres2018 R15]
Pitfalls and disagreements

Scattering depends on particle size and number, so extinction is not a measure of the amount or composition of the new phase (synthesis: the ritonavir and lopinavir curves differ in time course) [tres2018 R7, R15]. For spheres of 600–1000 nm nonabsorbing particles lose the Tyndall shape and may upset the usual corrections [vaneerdenbrugh2011b C33, C34].

← Concepts and formulas

concept · as used in Dissolution

limit of congruency

The highest drug loading at which a dispersion still releases drug and polymer congruently; for ritonavir–PVPVA it is 25% DL indulkar2019a C2; li2020 R23. The ritonavir spray-drying paper uses it as the reference point: phase separation has its largest effect on release at or below the limit, and above it release is already as slow as the neat amorphous drug li2020 C67, C66. For bicalutamide–PVPVA the limit was not located; drug and polymer released together at 5 and 10% DL and apart at 20% [moseson2022b R6, R7, X15]. Benson (2025) studied 10 and 20% DL ritonavir–PVPVA coated powders and tablets below the limit of 25% and describes coated tablets as having a lower effective limit benson2025 C34. New aspect (Release mechanism and LoC): defined by Indulkar and co-workers (2019) as the highest drug loading at which congruent release is observed, 25% for ritonavir–PVPVA indulkar2019a C2. Each value is the last congruent loading tested, so the switch lies inside the next step indulkar2019a X7; saboo2020a X11. The 2019 dihydropyridine study calls it the "drop-off" loading below which formulations must stay if rapid release is required saboo2019 C33. Across the papers of 2018–2020 it was not set by drug log P or molecular weight saboo2019 C35; que2019 C48, was raised by a surfactant in the dispersion que2019 C12, was absent up to 50% felodipine with HPMCAS and Eudragit S 100 saboo2020a R15, and coincided with water-induced phase separation of films, which the authors read as its cause ("likely") saboo2020a C43; indulkar2019a C33. Papers of 2020–2022 relate it to drug–polymer hydrogen bonding (analogues with donors 5–10% against 25–40% without) saboo2020 C14, C48; que2021 R19, C33 and to the drug's Tg against the dissolution temperature (cooling below the wet Tg lowered it) saboo2020 C51; yang2021 C35, raise it with surfactants inside the dispersion saboo2021 C16; correasoto2022a C55; correasoto2022b C12, and find that salt formation raising the Tg of lumefantrine lowered it hiew2022b C42. It is also expressed per mole que2021 E3. The 2022 ritonavir surfactant paper calls strategies to raise the limit "essential" for all but the most potent compounds, and showed rescue at one loading above it (30%) without locating a new limit indulkar2022 C5, A1. Yang and co-workers (2022) tied the ritonavir limit (cited 25%) to the loading at which the drug-rich phase at the gel surface becomes continuous yang2022a C15, C58. Plasticizers raised the limit of the high-Tg drugs atazanavir and ledipasvir three- to fivefold and that of low-Tg ritonavir 1.2-fold correasoto2023 R16, C12, C17. For MePHPH–PVPVA the drug content of the gel rose at 40 and 50%, which suggests a true limit below the cited 40% although at least 80% release is still reached at 40% deac2023a C14, R3, R14. For four phenolphthalein analogues the limit trends with the PVPVA content of the hydrophobic phase formed by water-induced separation, and strong drug–polymer interactions are proposed to lower it by shifting the plait point to a lower drug/polymer ratio deac2023b C67, C63. The papers of 2023–2025 add two causes beside drug–polymer interactions and drug Tg: the polymer's molecular weight (clotrimazole–PVP below 5% with K12 and K17, 20% with K25 and about 33–38% from K29/32, near the entanglement weight) and the critical point of the drug–polymer–water phase diagram, whose loading followed the cited limits of four phenolphthalein analogues within 7% deac2024a R12, C37; deac2024b R37, C59. The PVP paper defines the limit operationally as the highest loading releasing more than 80% of the drug deac2024a C36.

Findings

ASD process: F21, F38, F48. Release mechanism and LoC: F6, F7, F8, F9, F10, F11, F13, F14, F17, F18, F19, F21, F22, F25, F26, F27, F29, F30, F31.

Related concepts

ends congruent release; above it release is incongruent and drug-controlled. Marked by the falling-off-the-cliff effect; proposed to follow from phase separation kinetics of the hydrating surface; above it a drug-rich barrier layer forms; not ranked by lipophilicity; lowered by drug-polymer hydrogen bonding; depends on the wet glass transition temperature against the test temperature; set by phase inversion near the critical point, or lower by nanodroplet agglomeration when chains are below the critical entanglement molecular weight.

Formulas

molar drug loading, surface-normalized release rate, mole-based limit of congruency.

How it is measured or obtained

From the last drug loading in a series with congruent release of drug and polymer; the criterion varies (simultaneous release; at least 80% of drug released) and each value is the last loading tested, so the threshold lies between it and the next loading deac2024a C36; saboo2020a X11; hiew2022a X17. In the release-mechanism papers: from a loading series dissolved as constant-area compacts with drug and polymer assayed (see F1); an earlier film study read the same switch from LLPS in the medium indulkar2019a A1; saboo2019 A2; purohit2017b R11. Loadings can be expressed in mol% saboo2019 E1. Later criteria: last congruent loading by 5-min rates saboo2020 C14; congruent with at least 80% of the drug in 90 min que2021 P9; highest loading without a significant drug–polymer difference by t-test yang2021 P17; highest loading with good drug release, no stated criterion hiew2022b X6.

Values in the library
materialvalue or classconditionspaper ids
ritonavir–PVPVA25% DL; 30% initially congruent then incongruenttablets, pH 6.8, 37 °Cindulkar2019a C2, C32
felodipine, five polymersPVP 10, PVPVA 15, HPMC 10% DL; HPMCAS and EUDS no limit to 50%30% DL test setsaboo2020a R15
ledipasvir–PVPVA5% DL (between 5 and 7.5%); 30% with 5 wt% SDS (5 parts per 100 parts drug and polymer); 7.5% with poloxamer 407compactsque2019 C10, R9, C12
atazanavir–PVPVA5% DL; 10–15% with surfactants (10% with SDS or CTAB, 15% with Span 80)compactscorreasoto2022b C12
clopidogrel–PVPVAabout 40% DL; 50% with SDScompactscorreasoto2022a C46, C55
lumefantrine–PVPVA35% DLcompactshiew2022a C31
loratadineHPMCAS 20% at 37 °C, 5% at 5 °C; PVPVA 30% and 2%compactsyang2021 R22
BCL–PVPVAbetween 10 and 20% DL (not located)powders, polymer by size-exclusion chromatography[moseson2022b R6, R7, X15]
coated RTV–PVPVA tabletseffective limit described as below the 10 and 20% DL studiedconfocal, tabletsbenson2025 C34
ITZ–PVPVAswitch between 25 and 20% (spray-dried), 20 and 10% (melt-extruded)0.1 N HCl, compactsbhardwaj2018 X6, R4
ritonavir films with PVP; PVPVALLPS up to 20%; only at 10%25 °C, 100 mM pH 6.8purohit2017b R10, R11
nilvadipine; cilnidipine in PVPVA10% (6 mol%); 15% (7 mol%); switch at about 6–9 and 7–9 mol%pH 6.8, 37 °Csaboo2019 R5, R6, C14
indomethacin; its methyl ester in PVPVA10%; at least 25% (5-min rates)37 °Csaboo2020 C14, P5
indomethacin–PVPVA10% (25–57 °C), 5% (17 °C), below 5% (10 °C)temperature seriessaboo2020 R29
PHPH, TIPP, Me-TIPP, Me-PHPH in PVPVA5, 10, 30, 40%; 0.016, 0.012, 0.035, 0.115 mol per 100 gpH 6.8 (TIPP 2.5)que2021 R19, R20, P9
felodipine–PVPVA with 0, 2, 5, 10% TPGS15, 25, 35, 45%pH 6.8saboo2021 R12, P6
lumefantrine free base; eight salts in PVPVAat least 35%; 2–25%drug release onlyhiew2022b R20, X7
atazanavir–PVPVA with 5 g plasticizer per 100 g5 → 7.5–25% (citrate esters 20–25%)compacts, pH 6.8, 37 °Ccorreasoto2023 R1, C12
ledipasvir–PVPVA with 10 g TEAC, TBC; GTB5 → 15; 20%samecorreasoto2023 R11, C17
ritonavir–PVPVA with 5 g GTB or TBCcomplete release at 30%, not at 35% (cited limit 25%)samecorreasoto2023 R14, R16
MePHPH–PVPVA 40%; 50%gel drug content 40 → 49%; 50 → 59.5% over 30 minscraped gel, dry basisdeac2023a R3
PHPH, TIPP, MeTIPP, MePHPH–PVPVAlimit 5 / 10 / 30 / 40% (cited) against PVPVA in nanoparticles ≈77 / 36.5 / 9 / 5 wt%nanoparticles at 60 °Cdeac2023b R8, R3
clotrimazole–PVP K12, K17, K25, K29/32, K60, K90<5, <5, 20, ≈33, 35, ≈38%compacts, pH 8.0, >80% drug in 90–120 mindeac2024a R12, X5
PHPH, TIPP, MeTIPP, MePHPH in PVPVAcited 5, 10, 30, 40% against critical-point loadings ≈3.7, 13.7, 32.6, 33.2%PC-SAFT phase diagrams, 37 °Cdeac2024b R37
ritonavir–PVPVA + 10 parts Span 20 or Span 85between 30 and 40% (cited 25% without)compacts, pH 6.8yang2023 R2, R1
Pitfalls and disagreements

The limit depends on temperature, drug, polymer and additives, and on how it is defined; the lopinavir–HPMC films of F14 show that phase separation can raise release above a loading at which the miscible film is already drug-controlled [li2019 R2]. For ritonavir–PVPVA the next loading above 25% was 30% in the later release studies yang2022a C15. For coated ritonavir–PVPVA tablets the shift is inferred because polymer release was not measured benson2025 X18. The ritonavir release at the first failing loading (30%) differed about 1.6-fold between two series indulkar2019a X3. The molar loadings of the dihydropyridine study cannot be reproduced with one convention saboo2019 X2. The coincidence of interaction saturation with the ledipasvir limit "may be coincidental" que2019 C45. The link to water-induced phase separation rests on films and humidified compacts, not on dissolving tablets indulkar2019a X6; saboo2019 X10. The same pair gave different limits by LLPS in films at 25 °C and by congruency in tablets at 37 °C (ritonavir–PVPVA, 10–20% against 25%) purohit2017b R11; indulkar2019a C2. Limits from 5-min rates and from 30-min release differ for a fast crystallizer saboo2020 X7, R8; hydrogen bonding and Tg go together across drugs and are hard to separate yang2021 C25; correasoto2022a C49. In the 2022 ritonavir imaging paper release below 30% was measured only at 20%; the 25% limit is cited yang2022a X7. The MePHPH limit is given as 40% from an earlier paper, while the methods of the 2023 interface paper call 30% "at the LoC" deac2023a X1. The plait-point mechanism is drawn on schematic diagrams; no ternary diagram, tie line or plait point was measured deac2023b X14. The phase-diagram paper did not measure release: its limits are cited, and the MePHPH data it shows place the limit only between 30 and 50% deac2024b X9. In the PVP paper the 80% criterion is applied at an unstated time in tests of 90 or 120 min, with some profiles still rising deac2024a X6. For ledipasvir with SDS the 2019 study gives 5 → 30% que2019 C10, C12, while the 2023 surfactant paper cites the gain as 7.5 → 30% yang2023 R27. The PHPH critical-point loading is 3.7% as the paper states; read from its PHPH–PVPVA–water diagram (about 2.6 wt% PHPH, 59.5 wt% PVPVA) it is about 4.2% (synthesis: 2.6/(2.6 + 59.5) ≈ 0.042), see critical point deac2024b R37.

← Concepts and formulas

concept · as used in Dissolution

limit of detection

The smallest crystalline (or amorphous) content that can be told from zero by a method. The library has six working definitions: three standard deviations of the crystallinity read on a pure form [taylor1998a E7]; the residual standard deviation of the calibration regression, following ICH Q2(R1) [correasoto2017 E5, P9]; the single-voxel signal at signal-to-background 3 on a crystal-free sample divided by the signal of 100% crystalline powder [kestur2012 E9]; the smallest crystal size derived from a signal-to-background of 3 and its volume fraction [wanapun2010 E3, P10]; a signal-to-noise ratio of 3:1 on an XRPD peak moseson2021 P2; and visual detection of low-level standards in images [correasoto2017 R5, X7]. The values are not comparable without the definition and the basis (F4). New aspect (ASD process): the signal-to-noise or 3 SD criterion has the limit of quantification at 10:1 or 10 SD; for XRPD of indomethacin crystals in an amorphous dispersion the limit of detection was about 0.4% and of quantification about 1% [moseson2018 P7]. For crystallinity in an amorphous dispersion (formerly the page "limit of detection for crystallinity", from ASD process): the smallest crystalline fraction a method can distinguish from noise in an amorphous dispersion. For XRPD of IDM–PVPVA extrudates the stated limits are about 0.4% (detection) and 1% (quantification), and routine methods typically have limits on the order of 1% [moseson2018a P3, C36; moseson2018 P7]. A zero reading is a value below the limit of detection, not zero crystals: for bicalutamide in PVPVA by PXRD the limit is about 1% and of quantification about 3% [moseson2022c P16, X8]; for posaconazole in HPMCAS 0.3 and 1.2 wt% shah2024 R9, X4. 0.3% crystals of posaconazole, equal to the pXRD limit, ended supersaturation early after a pH shift shah2024 C56.

Findings

Solid-state methods: F1, F2, F4, F7, F10, F11. ASD process: F10, F28, F36, F41.

Related concepts

pairs with limit of quantitation; depends on signal-to-noise ratio; applied to degree of crystallinity and residual crystallinity (part of residual crystallinity when applied to crystals in an amorphous dispersion).

Formulas

limit of detection and quantification.

How it is measured or obtained

From spiked standards in the matrix of interest (a pure-form SD in the Raman work, regression residuals in the SHG and XRPD work), by calculation on a crystal-free sample, or by size estimation [taylor1998a R14; correasoto2017 R6, R8; kestur2012 P13; wanapun2010 R10]. For XRPD of indomethacin crystals the limit comes from the 3:1 and 10:1 signal-to-noise of a chosen peak (11.7° 2θ) against a fully amorphous reference, the noise being taken from a fully amorphous solvent-evaporated ASD measured in triplicate [moseson2018 P7]. The limit depends on the polymer background, which is small but not zero for SHG [kestur2012 C29].

Values in the library
materialvalue or classconditionspaper ids
indomethacin mixtures, RamanLOD 0.6% (3 × 0.2%); about 1% judged reasonablepure-form SD, 10 measurements[taylor1998a R14, C21]
naproxen–HPMCAS blends, PXRDno peaks below 5 wt%whole-pattern OPLS[kestur2012 R8]
naproxen–HPMCAS, SHG10^{-3} % (10 ppm), calculated; lowest imaged 0.1%single voxel at S/B 3[kestur2012 R7, R6, X10]
griseofulvin and chlorpropamide films, SHG90 and 125 nm; 3.4\times10^{-9} and 9\times10^{-9} % by volumesize back-calculated[wanapun2010 R10, R11]
flutamide and ezetimibe in HPMCAS, SHG0.03 and 0.047%; 0.005% visibleregression residual[correasoto2017 R8, R5]
flutamide and ezetimibe, XRPDabout 0.4 and 0.7%; none seen below 1%peak-window area ratio[correasoto2017 R8, R7]
posaconazole HME ASD (PCZ–HPMCAS), pXRDLOD 0.3 wt%, LOQ 1.2 wt%; pXRD no peaks where SHG found 0.3%, 2.4% against 3.2%, 23.1% against 19.3%18.0° peak, spiked standards; 125 °C extrudatesshah2024 P6, R9, R10, X4
BCL–PVPVA extrudates, XRPDLOD about 1%, LOQ about 3%S/N 3:1 and 10:1moseson2021 P2
tacrolimus capsule contents, XRPDabout 1% (LOQ about 5%); 10% crystallinity (0.38% w/w)spiked standardshate2019 R2; purohit2018 R2
IDM in PVPVA (XRPD), extrudatesLOD about 0.4%, LOQ about 1%3:1 and 10:1 S/N; 5–40° 2θ[moseson2018 P7; moseson2018a P3]
IDM crystals in copovidone at 130 °CXRD may lose the crystals earlier than PLM or TEM show them; loss is also consistent with a small fraction below the limitvariable-temperature XRD[moseson2019 R4, C11, C54, X7]
30% BCL in PVPVA (XRPD), 2022 paperlimit of detection about 1%, of quantification about 3%; calibration 0–65% (R² = 0.9952)17.2° peak, triplicate[moseson2022c P15, P16, X8]
flutamide standards (XRPD)no evidence of crystallinity by XRPD below 1%0.005–0.5% crystalline standards[correasoto2017 R7]
citedlaboratory XRPD 5–7%; synchrotron with processing about 0.2%; ensemble SHG 0.12%literature[correasoto2017 R25; kestur2012 R17]
Pitfalls and disagreements

The 10 ppm of the naproxen work is a calculation and the lowest imaged level was 0.1%; "0.005% readily detected" is visual while the computed limits are 0.03–0.047% [kestur2012 X10; correasoto2017 X7]. A limit from a pure-form SD omits mixing error [taylor1998a R13]. Below the XRPD limit does not mean amorphous: TEM and polarized-light microscopy found crystals in extrudates that XRPD called amorphous [moseson2021 R6; moseson2018a R5, R9]. The posaconazole paper states the pXRD result at 10 wt% loading as below the quantification limit, below the detection limit and "as low as 0.3%" shah2024 X4. Limits quoted for physical mixtures do not carry over to dispersions: SONICC's low limit was shown for blends, and a crystalline level of about 6 wt% in a dispersion lay near the 5 wt% below which PXRD blends showed no peaks [kestur2012 X9, R8]. Crystals below the limit still changed polymorph and supersaturation in the bicalutamide dispersion, so a limit of detection is not a specification moseson2021 R6, R17. Detection is limited by dilution of the drug, crystallite size and crystal quality, so XRPD "may be systematically underestimated" for nanometre, strained crystals [moseson2018a C26, C27; moseson2019 C11]. The x-ray criterion for a "X-ray amorphous" class is not stated [moseson2018 X5].

← Concepts and formulas

concept · as used in Dissolution

lipophilicity

The affinity of a drug for lipid over water, written as log P of the neutral species. In these papers it is a descriptor used to explain solubility, membrane partitioning and transport, and it is quoted or calculated rather than measured [hate2022 C36, C53; alkalla2026 C18, C33]. In a membrane cell a high log P means a large membrane partition coefficient, so that the unstirred water layer rather than the membrane limits transport (F21) [hate2022 C44, C53]. For polymers the corresponding idea is polymer hydrophobicity. In the growth-inhibition papers of 2012–2013 it places three model drugs on a hydrophobicity scale that is then compared with the solubility parameters of the polymers ilevbare2013b M1–M3; ilevbare2013c M1–M3. New aspect (Release mechanism and LoC): drug lipophilicity was tested as a predictor of the limit of congruency. Saboo and co-workers (2019) hypothesized that the more hydrophobic drug lowers the hydrophilicity of the drug–polymer blend faster with composition and so releases congruently over a smaller loading range saboo2019 C6; for nilvadipine and cilnidipine in PVPVA the hypothesis was "incorrect for the systems evaluated" saboo2019 C35. Que and co-workers (2019) found that the limit "does not appear to depend" on hydrophobicity or molecular weight que2019 C48. Within congruent release at 40% in HPMCAS, by contrast, drug and polymer release fell with drug log P, which the authors read as support that hydrophobicity influences release "at least" in such systems saboo2020a C19, C32. Papers of 2021–2022 found no log P trend across four phenolphthalein analogues and six drugs, and conclude that log P "shows little indication" of dispersion performance que2021 C29; yang2021 C19, C42. Lipophilic plasticizers (log P around 2.5) "appear" more effective at higher loading than hydrophilic ones, and TBC or GTB lowered the water sorption of PVPVA more than dilution would correasoto2023 C44, C26. The fall in release rate of MePHPH (log P ~4) dispersions above 20% "may" come from lipophilicity lowering the thermodynamic driving force for water penetration deac2023a C53. In HPMCAS the 2024 paper found drugs of "somewhat comparable" log P (4.1–5.9) losing release with loading very differently, which "strongly" suggests drug–polymer interactions, and attributes the slower release of non-complexing drugs at high loading "likely" to lipophilicity through less hydration bapat2024 C26, C28, C42; the 2025 grade paper reads the faster release of loratadine than of cinnarizine from HPMCAS-LF as due to less complexation, not lipophilicity (log P 5.2 against 5.8) bapat2025a C30.

Findings

Bioperformance: F20, F21, F22, F24. Crystallization from solution: F8, F13, F30, F44. Release mechanism and LoC: F9, F25, F26, F32, F33.

Related concepts

sets the partition into the membrane in membrane asymmetry; limits transport through the unstirred water layer; related to micellar solubilization and crystalline solubility; related to solubility parameter and polymer hydrophobicity. Measured as the octanol-water partition coefficient; tested against the limit of congruency.

Formulas

octanol-water partition coefficient.

How it is measured or obtained

Taken from the literature or calculated: a cited cLogP for enzalutamide in one paper and a MarvinSketch value in the next; log P of atazanavir, posaconazole and darunavir cited from reviews [wilson2018 M1; wilson2020 M1, P4; elkhabaz2019b M1, M2; alkalla2026 M1, M2; hate2022 M1, M6]. Calculated with ChemBioDraw (version 11.0 or 12.0, both named) or taken from the literature ilevbare2013b X16. In the release-mechanism papers: calculated (ClogP), cited, or measured by shake flask saboo2019 A1; que2019 R28; saboo2020a E5.

Values in the library
materialvalue or classconditionspaper ids
enzalutamide2.98 (cLogP, cited from a regulatory report) and 4.75 (MarvinSketch)neutral species[wilson2018 M1; wilson2020 M1, P4]
atazanavirabout 4.5pKa 4.3–4.52[elkhabaz2019b M1; alkalla2026 M1; hate2022 M1]
posaconazole4.6pKa 3.6 and 4.6elkhabaz2019b M2
darunavir2.8pKa 2.4[alkalla2026 M2]
acetaminophen0.46 and 0.51 as printedhydrophilic comparator[hate2022 M6, X5]
lumefantrine8.34; good release to 35% in PVPVAbase form, citedhiew2022b C35, M1, R20
ritonavir; efavirenz; celecoxibLog P 5.6 (5.98 in the 2012 paper); 4.7; 3.5SP 20.03; 21.89; 23.38 MPa^1/2ilevbare2013b M1–M3; ilevbare2012c M1
growth-inhibiting windowcellulose polymers of SP 20.56–23.28 for drugs of Log P 3.5–5.65 µg/mLilevbare2013b C43
13 bile saltsLogP'A of the ionized acid from 2.65 (SDC) to −0.50 (STC); none for STDC, STCDC, SLCliteratureli2016a M4–M16
posaconazolelog P 4.6 (cited); phase-separates at about 10 µg/mLpH 6.5shah2025 M1, C48
nifedipinelog P 3.17 (cited)model drugindulkar2017b M1
nilvadipine; cilnidipineClogP 3.04; 5.54; LoC in PVPVA 10 and 15% (about 6–9 and 7–9 mol%)pH 6.8, 37 °Csaboo2019 A1, C35
ritonavir; ledipasvirlog P 4.3, LoC 25%; LoC 5% for ledipasvircited; PVPVAque2019 R28, R27, C10
nilvadipine, felodipine, cilnidipine at 40% in HPMCASlog P 4.06, 4.46, 5.40; rates 0.42, 0.34, 0.26 mg/min/cm²pH 6.8saboo2020a R16
TIPP, Me-TIPP, PHPH, Me-PHPHlog P 6.39, 7.60, 2.63, 3.93 (ACD); limits 10, 30, 5, 40%calculatedque2021 M1, M2, M3, M4, R19
loratadine, miconazole, danazol, elbasvir, paclitaxel, ivacaftorlog P 4.4, 5.69, 3.8, 5.33, 3.96, 5.68; PVPVA drops at 25, 40, 5, 10, 5–10, 5–10%citedyang2021 M1, M2, M3, M4, M5, M6, R7, R8, R9, R10, R11, R12
clopidogrelcLogP 3.8; limit about 40%citedcorreasoto2022a M1, C46
ritonavir (log P 5.7) against loratadine (4.55) in HPMCAS-MF, 25%0.45 against 0.17 mg/min/cm² (table values)compacts, pH 6.8bapat2024 X18, R2
Pitfalls and disagreements

The same drug carries two log P values 1.8 units apart in two papers of one group [wilson2018 M1; wilson2020 M1] (synthesis: 4.75 − 2.98). The large crystalline solubility gap between atazanavir (1.6 µg/mL) and darunavir hydrate (265.6 µg/mL) is attributed to crystal packing and the lower log P of darunavir, an attribution that was not tested [alkalla2026 C33, R3]. The higher PAMPA mass flow of atazanavir and nifedipine than of acetaminophen is credited to lipophilicity although the drugs also differ in dose, pKa and concentration (F21) [hate2022 C36, R16]. The Log P source is given as version 12.0 in the text and 11.0 in the table footnote; Log P values are calculated estimates ilevbare2013b X16. The papers use Log P only to describe the drugs; the polymer match is made on SP, not on Log P ilevbare2013c C37. The two log P sets for nilvadipine and cilnidipine differ (ClogP 3.04 and 5.54 against measured 4.06 and 5.40) saboo2019 A1; saboo2020a R16. Two drugs per comparison cannot separate log P from other differences such as the glass transition que2019 C49. Miconazole log P is printed as 5.69 and 5.22 yang2021 X1, and two programs give TIPP 6.39 and 8.08 que2021 M1. The printed log P values refer to the neutral species; indomethacin is ionized at pH 6.8, so its lipophilicity in the gel is lower than its log P bapat2024 X18.

← Concepts and formulas

concept · as used in Dissolution

liquid-liquid phase separation

The splitting of a highly supersaturated aqueous drug solution into a water-rich continuous phase and a dispersed, non-crystalline drug-rich phase, before crystals form; the authors call it glass–liquid phase separation when the drug-rich phase is a glass ilevbare2013a C2; indulkar2015 C38. The concentration at which it starts is called the LLPS concentration, CL-L or coexistence concentration, and in this chapter equals the amorphous solubility within the accuracy of the methods ilevbare2013a C14, C3. It was earlier discussed as "promiscuous aggregation" in screening assays and as "oiling out" in crystallization ilevbare2013a C7, C9, C35. The papers of 2017–2022 add a weak base shifted from simulated gastric fluid to pH 6.5: pazopanib gave a milky, bluish solution at once, with particles of 495.9 nm (145.4 nm with 50 µg/mL HPMC) and no particles at a dose below its amorphous solubility sugihara2018 R14, R15, R20, and ibuprofen droplets that measured 3182–5313 nm in buffer and 268–345 nm with HPMC or PVP-VA ueda2020b R5. New aspect (Bioperformance): the two phases are in metastable equilibrium with equal activity [raina2014a C3, C4, C33; indulkar2016 C1; hate2018 C5]. For high-Tg drugs such as telaprevir the term glass–liquid phase separation is used [mosqueragiraldo2018b M1]. Drug-rich spheres were also found by SEM in pooled human intestinal fluid, the first such demonstration according to the authors elkhabaz2019b R4, C24; a crystalline co-drug lowers the concentration at which atazanavir separates [alkalla2026 C2]. New aspect (Supersaturation from ASD dissolution): dispersion dissolution, unlike dissolution of a neat amorphous drug, can push the concentration past the amorphous solubility, so that LLPS follows dissolution and precedes crystallization jackson2015 C7, C29; the colloids of rapidly dissolving ritonavir dispersions "highly likely" originate from LLPS ilevbare2013d C33.

Findings

Amorphous solubility and LLPS: F1, F2, F3, F4, F5, F8, F9, F11, F13, F15, F16, F22, F23. Bioperformance: F1, F2, F4, F5, F10, F18, F19, F27. Supersaturation from ASD dissolution: F7, F9, F10.

Related concepts

produces the drug-rich phase; special case glass-liquid phase separation; sets the amorphous solubility; described by the binodal and spinodal decomposition; grows by droplet coalescence; precedes crystallization (a precursor, F3). Produces drug-rich nanodroplets; related to metastable equilibrium.

Formulas

binodal condition, amorphous solubility advantage with water-sorption correction, ideal-mixing reduction of amorphous solubility.

How it is measured or obtained

By extinction at a non-absorbing wavelength during slow addition of a drug stock, by a polarity-sensitive probe or the drug's own fluorescence, by DLS or NTA sizing of the droplets, by ultracentrifugation of the phases, by NMR of dissolved drug, by a flux break, and by a solvent-free pH-shift titration for weak bases ilevbare2013a P5, P10, P11; almeidaesousa2015 P1, P2; mosqueragiraldo2015 P10; trasi2015a P6; indulkar2015 P10 (F4). In the Bioperformance papers: rise of extinction on solvent shift; turbidity without birefringence under polarized light [raina2014a R4, C12]; droplet size and number by NTA or DLS [indulkar2016 P4; hate2018 R6, R7]; the 369 nm fluorescence band of atazanavir [hate2018 P6, C18]; the flux plateau; antisolvent titration read by 450 nm extinction [alkalla2026 P7, C16]; the drug's own fluorescence intensity and SEM of the centrifuged pellet elkhabaz2019b R3, R4, C17. During dispersion dissolution: the pyrene ratio, with the onset read as the UV concentration at the pyrene drop; stepwise dissolution with dilution; turbidity titration with polymer present jackson2015 P3; ilevbare2013d P4, P2.

Values in the library
materialvalue or classconditionspaper ids
ritonavir dropletsabout 345 nm at 1 min, about 842 nm at 64 minwater, 37 °C, single addition at the onsetilevbare2013a R3
ritonavir drug-rich phase94.85–95.97% drug, 4.03–5.15% water, Tg 0.4 °C10–50 °C, ultracentrifugedilevbare2013a R5, R6
weak-base dropletsZ-average about 116–387 nmclotrimazole, atazanavir, nicardipine, 37 °Cindulkar2015 R14
telaprevirspecies about 300 nmpH 6.8, 37 °Cmosqueragiraldo2015 R5
ritonavir dropletsabout 360 nm at 30 µg/mL100 mM pH 6.8, 25 °Ctrasi2015a R15
pazopanib colloids495.9 nm without, 145.4 nm with 50 µg/mL HPMC (DLS); NTA about 50–650 nmpH 6.5 after pH shift, 37 °Csugihara2018 R15, R16
ibuprofen droplets3182–5313 nm (buffer); 272–345 (HPMC); 268–320 (PVP-VA); 472–808 nm (EUD-E)pH 2.0 (D2O), 37 °C, freshueda2020b R5
felodipineonset 5.70–13.4 µg/mL20–45 °C, buffer[raina2014a R1]
nifedipineLLPS only with 1 mg/mL HPMC: 30.86–88.89 µg/mL20–45 °C[raina2014a R1, R5]
clotrimazoleonset 7.5 µg/mL; droplets 111–257 nmpH 8[indulkar2016 R2, R4]
atazanavir78 µg/mL; droplets 204–226 nmpH 6.8[hate2018 R2, R6]
ritonavironset about 38 µg/mL in waterUV extinctionilevbare2013a R2
enzalutamideonset about 42 µg/mLpH 6.5, 37 °C[wilson2018 R2, C16]
atazanavir, darunavir93.1 and 363.8 µg/mL (antisolvent, 450 nm)pH 6.8, 37 °C[alkalla2026 R3, C16]
pretomanidabout 166 µg/mL in buffer, 308 in FaSSIFpH 6.5, 37 °C[nguyen2023a P2, R2]
danazol dispersions (eight)onset about 6.0–10.4 µg/mL against 8 µg/mLpH 6.8, 25 °Cjackson2015 R5, M1
ritonavir–PVP dispersion, stepwiseonset between 10 and 20 µg/mL37 °Cilevbare2013d R1, X8
ritonavir, 180 µg/mL PVP / PAA / HPMC / HPMCAS / CAAdP 0.8518.3 / 18.3 / 18.7 / 18.2 / 21.3 µg/mL (18.2 without)titration, 37 °Cilevbare2013d R10
Pitfalls and disagreements

Extinction alone cannot tell droplets from crystals, and a fast crystallizer may crystallize before it phase separates (griseofulvin without polymer) almeidaesousa2015 C16, C18. The ritonavir phase diagram rests on four binodal points between about 11 and 29 °C ilevbare2013a X17. Droplet size grows with time by coalescence and varies with drug and technique ilevbare2013a R3, C18. In SDS the 369 nm band that marks the atazanavir drug-rich phase in buffer appears from about 200 µg/mL, far below the amorphous solubility of about 1450 µg/mL, so a spectral marker has to be checked in the micellar medium indulkar2017a R17, R18, C27; extinction rose on the first addition to STCDC and SGCDC without visible turbidity lu2017b R4. LLPS is seen only if nucleation is slow compared with phase separation; the metastable zone for LLPS is "small" by the authors' reading [raina2014a C30, C32]. Turbidity does not tell LLPS from crystallization without a crystal-specific method [elkhabaz2017 C30]. Above the onset an inhibitor can still fail: pretomanid with HPMCAS-HF crystallized within minutes in the presence of droplets (F27) [nguyen2023a R7, C13]. A polymer in the droplets lowers the onset (F19) [ueda2020a R1, C13]. In the danazol dispersion study the overshoot above the amorphous solubility before LLPS was inferred from UV, which is unreliable there jackson2015 X12; a slowly releasing dispersion (50:50 HPMCAS danazol) never reached it jackson2015 C33.

← Concepts and formulas

concept · as used in Dissolution

local equilibrium

Evidence table: local equilibrium. Content from the release-mechanism chapter (2023–2025).

The assumption that phase separation in a hydrating dispersion is at least as fast as water penetration, so that the phases at each depth of the gel layer are in pseudo-equilibrium with the local water content and their compositions can be read from the equilibrium ternary diagram deac2023b C38; deac2023a C70. The gel surface, with water activity near unity, can equilibrate with the solution and resemble the dilute nanoparticle composition, while deeper layers with less water reach other regions of the diagram deac2023b C61. Compacts above the limit formed a surface barrier "in pseudo-equilibrium" with the aqueous phase deac2023b C3. The 2024 phase-diagram paper assumes that the separated phases reach local equilibrium at once along the hydration path, "likely" valid for MePHPH and PHPH because both drug-rich phases are rubbery at 37 °C, and expects high-Tg drugs "may not" conform deac2024b C48, C49, C50, C54.

Findings

Release mechanism and LoC: F25, F27, F30.

Related concepts

lets the ternary phase diagram, its binodal and tie lines describe the gel layer; needs a mobile phase, related to the wet glass transition temperature.

Formulas

none.

How it is measured or obtained

Indirectly: time for nanoparticle composition to settle and for compact surfaces to reach a constant composition deac2023b C38, R2, R6, R7, and comparison of the released hydrophobic phase with equilibrated nanoparticles, with its Tg against the test temperature deac2023a C39, R12.

Values in the library
materialvalue or classconditionspaper ids
PHPH and MePHPH nanoparticles with PVPVAcomposition settled within 5 min37 °Cdeac2023b C38, R2
PHPH and MePHPH compact surfaces above the limitpseudo-equilibrium within 10 minATR-FTIRdeac2023b C38, R6, R7
hydrophobic phase released from 30% MePHPH; 5% PHPHTg 16.8; −5.8 °C, both below 37 °CDSCdeac2023a R12, C39
Pitfalls and disagreements

The assumption "may be valid" when the hydrophobic phase is mobile; dispersions whose hydrophobic phase has a high Tg need further work deac2023a C70.

← Concepts and formulas

concept · as used in Dissolution

matrix crystallization

Crystallisation of the amorphous solid itself while it is in contact with the medium, before the drug has dissolved (also called solid-mediated crystallisation), in competition with dissolution and with crystallisation from solution moseson2021 C1, C27. Bicalutamide–PVPVA is the case in point of the ASD process papers: a hydrated, polymer-depleted, drug-rich solid that is "likely" below its Tg at 37 °C becomes mobile enough to crystallise in place, a surface-driven reaction triggered by hydration and polymer loss moseson2021 C55, C56, C59. Moseson (2022) tested the route across loadings: bicalutamide–PVPVA at 5 and 10% loading released drug and polymer together and escaped it, whereas 20–50% loading, cryomilling and cryomilled surfactant-containing powders raised the risk. The authors call it surface-mediated: a polymer-depleted, drug-rich boundary layer forms, crystallizes and "could prevent release" [moseson2022b C36, C39, C43, R6, R7]. In posaconazole–HPMCAS at 50% loading a 12 nm coating went with a much lower SHG signal after 3 h and higher release, which the authors suggest is a delay of matrix crystallization [moseson2023 R15, R18, C40]. New aspect (Bioperformance): crystallization inside the undissolved ASD particle during dissolution, as against crystallization from solution [mosqueragiraldo2018b C40; elkhabaz2017 C34]. The poor exposure of the 10% enzalutamide–HPMCAS dispersion was attributed to rapid matrix crystallization on contact with water; the printed evidence is crystals in the medium and a 10 µg/mL maximum [wilson2018 C56, X11]. New aspect (Supersaturation from ASD dissolution): in the first study of the two routes it is called "crystallization from matrix": the amorphous particle converts to crystal on contact with the medium, against nucleation and growth from the supersaturated solution alonzo2010 C43, C47. If it is faster than dissolution, no concentration above that of the crystal can be reached, because the crystal is what dissolves alonzo2010 C33. The papers of 2015–2018 show that the dispersion polymer and its share decide it: resveratrol dispersions needed 80–95% cellulosic polymer to stay amorphous in buffer, PAA failed for celecoxib "irrespective of the drug loading", and an inhibitor dissolved in the medium cannot reach it wegiel2015 R14; xie2016a C33, C31; xie2015 C35.

Findings

ASD process: F27, F28, F29, F38, F39, F40, F41, F46. Bioperformance: F9, F11, F12, F23, F26, F27, F30. Supersaturation from ASD dissolution: F1, F2, F3, F16, F24, F27.

Related concepts

contrasts with desupersaturation; accelerated by residual crystallinity; not blocked by crystallization inhibition by polymers in solution; accompanies incongruent release and surface drug enrichment; related to surface crystallization; avoided by congruent release; fed by the drug-rich surface layer; delayed by an atomic layer coating in one posaconazole system. Contrasts with solution crystallization; favoured by drug loading; part of crystallization during dissolution; related to plasticization by water.

Formulas

None specific; the competition with dissolution is set out with the Noyes-Whitney equation alonzo2010 E3.

How it is measured or obtained

Time-lapse polarised light microscopy of particles in buffer, in-line Raman of a slurry resolved by MCR-ALS, XRPD and SEM of recovered solids, polymer release by size-exclusion chromatography, and dissolution at several doses read for plateaus below the amorphous solubility and a falling fraction dissolved moseson2021 P14, P15, P16, R17, R18, R19. SEM, SEM-EDX (fluorine occurs only in the drug, F/F0) and confocal fluorescence of compacts exposed face down to medium for 5–60 min; Raman slurries resolved by MCR-ALS for the form 2 time course [moseson2022b P12, P14, P15, P16, P17]. SHG of particles after 3 h in buffer [moseson2023 R18]. Polarized light microscopy of particles in buffer [mosqueragiraldo2018b R18]; SHG [elkhabaz2017 P10]; indirectly, a flux ceiling not reached [mosqueragiraldo2018b R16]. In the ASD dissolution papers: in situ Raman of aqueous slurries with a PLS model for crystallinity or marker bands, PXRD of wetted powder after 15 min, and polarized light microscopy of wetted particles alonzo2010 P5, P6, P8; raina2014b P4, P6, P10; the 1630/1605 cm−1 Raman ratio of resveratrol slurries, also in a medium where the enteric polymer does not dissolve (pH 1.2) wegiel2015 P7, A3; the amorphous Raman shoulder near 1598 cm−1 of celecoxib slurries xie2015 P3, R3; polarized light of residues retrieved after the release peak xie2016a P6.

Values in the library
materialvalue or classconditionspaper ids
BCL–PVPVA 30:70, crystal-freeform 2 begins at 20–30 min (half conversion about 36 min); plateau about 37–38 µg/mL against an amorphous solubility of 150 µg/mL60 and 150 µg/mL doses, pH 6.8moseson2021 R12, R13, R19
BCL–PVPVA with residual or added form 1 crystalsform 1 first detectable at about 15 min (S/155), 7 min (M/155), from the first spectrum (10% seeds)Raman slurry, 10 mg/mLmoseson2021 R21
amorphous nifedipine (outside)crystallises mainly by the matrix route within about 10 min; PVP, HPMC or HPMCAS in solution do not change onset or routebuffer, 25 °Craina2014b C10, C11
celecoxib dispersions (outside)polymers dissolved in solution cannot inhibit crystal formation in the matrixhigh drug loadingxie2015 C35
telaprevir 50% HPMCAS (outside)slow, incongruent release; HPMCAS leaves about twice as fast as the drug, leaving a drug-rich layeroptical micrographs[mosqueragiraldo2018b C40, C43]
enzalutamide 10:90 HPMCAS (outside)rapid matrix crystallisation on contact with waterdissolution[wilson2018 C56]
posaconazole ASDs in acid (outside)matrix crystallisation about 68% at 50% DL, about 0.05% at 25% DLSHG over TPE-UVF, 30 minelkhabaz2019a R20, C38
BCL–PVPVA 5 / 10 / 20 / 30 / 50% DL powdersend level about 91 / 96 / 88 / 86 / 73% of the dose; polymer ahead of drug from 20% DLdose of at most 30 µg/mL, pH 6.8[moseson2022b R6, R7]
30% and 50% DL compacts, 1 hdrug-rich boundary layer of 94 ± 8 µm with crystals (F/F0 1.41 ± 0.10); 5–10 µm crust of crystalsSEM-EDX[moseson2022b R15]
30% DL cryomilled 2 and 5 minabout 50 and 49% of the dose, plateau about 15 µg/mLsame[moseson2022b R4]
10% DL after 10 min of cryomilling or extrusion and 30 s of millingabout 93% of the dosesame[moseson2022b R8]
30% DL with 3% TPGS, cryomilled 5 minstops at about 60% (about 18 µg/mL)same[moseson2022b R12]
50% PCZ–HPMCAS, small particles, uncoated against 12 nm Al2O3SHG 126.7 against 3.7; about 3.35 against 5.1 µg/mL at 3 hsingle stage, pH 6.5[moseson2023 R18, R15]
telaprevir 50% HPMCAS ASDbirefringent domains in the particle at 20 min; 0.65 µg/minpH 6.8[mosqueragiraldo2018b R16, R18]
telaprevir 47.5:47.5:5 SDS ASDnone visible; 1.07 µg/minsame[mosqueragiraldo2018b R16, R18]
ezetimibe PAA ASDcrystals within minutes, inferred from the matrixbuffer, FeSSIF[elkhabaz2017 C34, R12, R16]
posaconazole ASDs 10 / 25 / 50%SHG crystallinity 0.3–0.4 / 3–4 / 19–26%60 min FaSSGFshah2024 R21
posaconazole ASDs50% DL final crystallinity about 250 times that of 25% DLelkhabaz2019a R18
enzalutamide 10:90 HPMCAS-MF ASDpeak about 10 µg/mL, crystals in the mediumpH 6.5, 100 µg/mL total[wilson2018 R6, C56]
pretomanid HPMCAS-HF ASD tabletscrystalline drug in the particles after FeSSIF at pH 5.5 and below, and after a 1 h gastric stagePXRD and SEM, 30 mg in 150 mL[nguyen2023a R20, R22]
neat amorphous felodipine≈54% crystalline at 1 min (37 °C); 50% after about 8 min (25 °C)pH 6.8 slurryalonzo2010 R2
felodipine with 500 µg/mL PVP, HPMC, HPMC-AS in the medium50% crystalline at ≈20.5, ≈18.5, ≈13.5 min37 °Calonzo2010 R6
neat amorphous indomethacinα form present at 90 min, like pure α at 120 minpH 2, 37 °Calonzo2010 R12
nifedipine 50:50 dispersions (PVP shown)particles not birefringent; crystals form in the solutionpH 6.8raina2014b R13, X18
nifedipine–HPMCAS 50:50 at pH 2matrix amorphous for 3 hpolymer barely solubleraina2014b R15
celecoxib–HPMCAS 33.3% particles in pH 3 suspensioncrystals on or in particles after about 7 days (Triton X100), none in 48 h25 °Cchen2015a R20, R14
resveratrol 35% with HPMC / HPMCAS / CMCABRaman ratio ≈0.87 / ≈0.84 / ≈0.81 (crystal 0.76) within hourspH 6.8, 37 °Cwegiel2015 R9
resveratrol, minimum polymer to prevent it80% HPMC, 85% HPMCAS, 95% CMCABpH 6.8, 37 °Cwegiel2015 R14
neat amorphous celecoxibcomplete within an hour; crystals on the particles from 2 minpH 6.8, 37 °Cxie2015 R4, R8
celecoxib–PVP-K12 50%crystalline within 4 h in a slurrypH 6.8, 37 °Cxie2015 R4
celecoxib–PAA 5:5 and 1:9, HPMCAS in the mediumrelease stopped at about half; needles in the residuepH 6.8, 37 °Cxie2016a R9, R10
lopinavir 50% with EUD, CAP / HPMCPcrystals by 8–16 h / none at 48 hpH 3, 25 °Cli2018 R7
delamanid salt dispersions, films after 1 h in acidclear at pH 1.6 (HPMCP); crystals at pH 3.0 on all but HPMCP-55; small crystals on every film at pH 5.025% drug, 37 °Cnguyen2023c R19
same, powderspitted, porous HPMCAS surfaces with agglomerates increasing with pH; HPMCP-50 covered at pH 5.01 h in acidnguyen2023c R18
delamanid dispersions in HPMCP, films with and without a 2 µm Eudragit L 100-55 layerstar- and needle-shaped crystals on every uncoated film; none under the layerpH 3.0, 1 hnguyen2023b R3, R6
posaconazole–HPMCAS dispersionscrystals by SHG in every system after 30 min in FaSSGF, more numerous after transfer37 °Celkhabaz2019a R16
Pitfalls and disagreements

The hydrated-solid mobility mechanism was not measured (the wet Tg of amorphous bicalutamide could not be determined) and the kinetics come from slurries far above the dose concentrations moseson2021 R27, X8, X11. Attribution to the matrix route is often inferred: crystals could instead nucleate in the concentrated boundary layer around the dissolving particles, or the evidence is crystals in the medium and a low maximum without a solid-state analysis [xie2016a X6; wilson2018 X11]. Solution-mediated growth is not absent at high dose moseson2021 X4. The results and the discussion of the 2022 study disagree on whether 20–30% loading crystallized, the crystals of the compacts were identified by shape and not by diffraction, and the polymer-depleted state of the crust is inferred from a dye [moseson2022b X14, X16, X18]. The Tg and composition of the hydrated layer were not measured [moseson2022b C60]. One micrograph without XRPD supports the telaprevir case [mosqueragiraldo2018b X13]. Matrix and solution crystallization were not separated for enzalutamide: no solid-state analysis of the wetted dispersion is shown (F9) [wilson2018 X11]. In the ASD dissolution papers, slurries held far more solid per unit of polymer than dissolution vessels (about 500–750-fold for felodipine), so their lag times rank systems but do not give the time scale in dissolution alonzo2010 X5. The proposal that crystallization starts at the particle surface and that dissolved polymer delays it there was not tested alonzo2010 C36. For felodipine at 25 °C the fall after the peak may come from the matrix as well as from solution alonzo2010 X6. The PVP-K12 celecoxib dispersion crystallized in a slurry yet released fully in dissolution xie2015 R4, R6. PXRD found no crystals in delamanid dispersion powders after 1 h in acid, a method that detects about 1–5% crystallinity, so the crystal mass that harmed release was small nguyen2023c R15, R16, C46.

← Concepts and formulas

concept · as used in Dissolution

membrane flux

The rate at which drug crosses a membrane in a side-by-side diffusion cell, taken as the slope of the receiver concentration against time; with diffusion coefficient, area, thickness and membrane activity coefficient constant, it is proportional to the donor activity mosqueragiraldo2015 E4, C10; trasi2015a P6. It rises linearly with concentration up to the amorphous solubility and then plateaus (F8). The papers of 2017–2022 add atazanavir (flux per area, 7.07 cm²) and telaprevir (mass flow rate), both linear up to the amorphous solubility in buffer and flat above it, and flux in micellar media as a free-drug read-out indulkar2017a E7, R10, R11; lu2017b E1, R6. New aspect (Bioperformance): the mass of drug crossing a membrane per time (and per area), proportional to the solute activity in the donor when area, diffusion coefficient, membrane thickness and membrane activity coefficient are fixed [raina2014a C11, E6; raina2015c C14]. It is reported as µg/min from receiver slope × volume, as mass flow, or per area (F2). In rats the mass flow of the dissolved formulation across a dialysis membrane ranked formulations by exposure (F25) [wilson2018 R15, R17; wilson2020 R8, C27, C44]. New aspect (Crystallization from solution): it serves as an activity read-out in micellar and polymer media, where a flux plateau marks the maximum free-drug concentration and equal flux means equal activity jackson2016 E1, E2, C9, C16; li2016a E2, C14. New aspect (Supersaturation from ASD dissolution): flux used as a particle-blind measure of dissolved drug while dispersions dissolve: across a dialysis membrane, relative to the crystal alonzo2011 E1, C9, and in a side-by-side cell, converted to free drug with a standard curve jackson2015 E1, E3, P4.

Findings

Amorphous solubility and LLPS: F4, F8, F11, F16, F17. Bioperformance: F2, F3, F4, F5, F7, F15, F18, F19, F20, F21, F22, F24, F25. Crystallization from solution: F22, F31, F32, F38, F40. Supersaturation from ASD dissolution: F7, F8, F17.

Related concepts

reads thermodynamic activity; plateau marks the amorphous solubility; basis of the claimed nanodroplet reservoir effect. Described by Fick's first law; requires sink conditions; part of membrane transport and membrane asymmetry; measures free drug concentration.

Formulas

membrane flux in terms of solute activity. Flux definition, mass flow rate from receiver concentration slope, membrane flux from permeability and concentration, supersaturation from membrane flux ratio, membrane flux from concentration difference.

How it is measured or obtained

Regenerated cellulose membrane (6–8 kDa cut-off), 30–32 mL per side, 25 or 37 °C, receiver measured by UV probe or HPLC, sink conditions mosqueragiraldo2015 P11; trasi2015a P6. In the Bioperformance papers: side-by-side diffusion cell with UV dip probes and a receiver under sink conditions [raina2014a P8, P9]; flow-through cell with fresh receiver buffer [indulkar2016 P5, P10]; hollow-fibre module [hate2017 P4]; Caco-2 monolayers [alhalaweh2016 P17]; side-by-side cell with a dialysis membrane and a donor taken from a dissolved formulation [wilson2018 P15, P16; wilson2020 R8]; side-by-side cell with a regenerated cellulose membrane in simulated and pooled human intestinal fluids elkhabaz2019b R7; lipid-impregnated PVDF (PAMPA) cell with a buffer or surfactant receiver [hate2022 R1, R19]; Caco-2 monolayers with a crystalline co-drug present [alkalla2026 R13]. The flux is normalized by membrane area as J = dm/(dt\,A) [wilson2018 E3; alkalla2026 E2]. In the crystallization-from-solution papers: side-by-side diffusion cell with a regenerated cellulose membrane (6–8 kDa), the same medium on both sides, a donor concentration series and the receiver read by UV dip probe below sink limits jackson2016 P9; li2016a P8; lu2017 E2. In the ASD dissolution papers: dialysis bag (6–8 kDa in the text, 10 kDa on the figure) with 500 µg/mL HPMC in the receptor, slope over 10–40 min alonzo2011 P4, X1; regenerated cellulose membrane (6–8 kDa), 200 mL per side, 30 mm opening, 25 °C jackson2015 P4; PermeGear side-by-side cells, 7.065 cm², regenerated cellulose 6–8 kDa (resveratrol) or 12–14 kDa (tacrolimus), receiver kept below a third of the crystalline solubility wegiel2015 P10; trasi2016 P9.

Values in the library
materialvalue or classconditionspaper ids
telaprevirabout 0.068 µg/min at 5 µg/mL; about 0.97 at 90; about 1.07 at 130 µg/mL donor37 °Cmosqueragiraldo2015 R12
ritonavir; lopinavir; paclitaxelplateaus about 0.21–0.22; 0.13–0.14; 0.25–0.27 µg/min25 °Ctrasi2015a R2
ritonavir, lopinavir, paclitaxel in 30 + 30 µg/mL mixturesflux of each drug lower than from the single-drug donor25 °Ctrasi2015a R12
atazanavirabout 0.003 µg/min·cm² at 1 µg/mL, 0.106 at 70, 0.121 at 100, 0.114 at 200 µg/mL; slope 0.0017 mL/min·cm²buffer, 37 °Cindulkar2017a R10
telaprevirslope 0.009 µg/min per µg/mL; about 1.32 µg/min at 150 µg/mL; plateau 1.25–1.2750 mM pH 6.5, 37 °Clu2017b R6
telaprevir with 12 mM STDCabout 0.43 against 0.83 µg/min at 90 µg/mL37 °Clu2017b R12, R6
felodipineplateau 63–71 (25 °C) and 136–149 × 10⁻³ µg/min (37 °C)buffer + HPMC[raina2014a R11, R12]
nifedipineabout 1.7–1.9 µg/min37 °C, 1 mg/mL HPMC[raina2014a R14]
clotrimazoleJmax 0.686–0.693 µg/(h·cm²)flow-through, pH 8[indulkar2016 R9]
telaprevir1.05–1.18 µg/min above 90 µg/mLASD dose series[mosqueragiraldo2018b R1]
atazanavir, ritonavir(10.5 / 9.1) × 10⁻⁵ mg/min/cm² alone; about half in 1:1Caco-2[alhalaweh2016 R17]
telaprevir, antisolventplateau about 18-fold the saturated solutionside-by-sidemosqueragiraldo2015 R12, C40
tacrolimusabout 0.0050–0.0053 µg/min above 50 µg/mL; pure-drug solutions 20 / 50 / 60–100 µg/mL: ≈0.0027 / ≈0.0047 / ≈0.0050–0.0055 µg/minpH 4.5, 37 °Ctrasi2016 R14
danazol, no polymer, 25 °Cflux rises linearly to 8 µg/mL (about 0.0152) and plateaus (about 0.0156–0.0159, units as printed)donor 2–12 µg/mLjackson2016 R10
enzalutamideabout 0.18 µg/min at 10 µg/mL, about 0.87 at 50 and 0.81–0.91 up to 100; 10:90 ASD solution and drug with 900 µg/mL polymer both about 0.76side-by-side, 5 µg/mL HPMCAS[wilson2018 R13, R14]
enzalutamide formulations after 1 h of dissolution0.632, 0.456, 0.437, 0.147, 0.063 µg/min (10% and 50% copovidone, 50% HPMCAS, 10% HPMCAS ASDs, slurry)dialysis membrane[wilson2018 R15]
enzalutamide, four formulationsabout 0.53, 0.49, 0.068, 0.063 µg/min (10:90 and 50:50 CPHPC-106 ASDs, CA Sub ASD, slurry)dialysis membrane[wilson2020 R8]
atazanavir, posaconazoleJ_{eq} 2.08–2.48 × 10⁻³ and 5.79–6.97 × 10⁻⁴; J_{amph} 0.105–0.139 and 0.0191–0.0239 µg/(min·cm²)six media, 37 °Celkhabaz2019b R7
atazanavir, PAMPAabout 0.33 µg/min at 10 µg/mL, about 1.95 at 70 and 2.0–2.3 above; with 2% SDS receiver about 5.0 at 80 to 8.8 at 1000 µg/mLlipid-impregnated PVDF[hate2022 R1, R19]
atazanavir alone and with darunavir hydrateplateau about 9.5 × 10⁻⁵ against 2.9 × 10⁻⁵ µg/(min·cm²); Caco-2 about 0.083 against 0.053pH 6.8, 400 µg/mL HPMCAS[alkalla2026 R9, R13]
danazol, PVP, HPMC, HPMC-AS 1–1000 µg/mLmaximum flux about 0.0126–0.0175 against about 0.0153donor 15 µg/mLjackson2016 R11
celecoxib, nevirapine, 0.1% STC or SGC0.44, 0.46, 0.41 and 20.9, 23.4, 21.0 µg/min (no additive, STC, SGC)pH 6.5, 37 °Cli2016a R15
tacrolimus, cilnidipine at the amorphous solubility0.027–0.031 and 0.0014–0.0018 µg/min·cm² in buffer, FaSSIF-V1, Composite-SIF; flux at the crystalline solubility not measurable37 °C, 7.07 cm², regenerated cellulose 6–8 kDindulkar2018 R12, R13
telaprevir, bile salt mixturesmass flow unchanged at 1.86 mM, lower at 3.72 and 5.58 mM50 mM phosphate pH 6.5lu2018 R2, X2
felodipine controls 10 and 5 µg/mLratios 10.0 ± 3.4 and 4.8 ± 0.39 to the crystal37 °Calonzo2011 R14
felodipine 90:10, 50:50, pure amorphous10.5 ± 1.2, 9.5 ± 1.8, 8.5 ± 1.837 °Calonzo2011 R14
danazol dispersions PVP, HPMC, HPMCAS14.0–18.3 × 10⁻⁵ µg/(min·mm²) with LLPS; 10.3 × 10⁻⁵ without (50:50 HPMCAS)25 °Cjackson2015 R9
tacrolimus products dissolved in 30 mL0.0048–0.0054 µg/minpH 4.5, 37 °Ctrasi2016 R15
resveratrol–HPMCAS solutions; saturated crystal≈4.4 → ≈2.6 µg/min; 2.0 µg/minpH 6.8, 37 °Cwegiel2015 R20
Pitfalls and disagreements

The plateau still rises by about 10% from 90 to 130 µg/mL mosqueragiraldo2015 X6; the low-donor flux traces are curved and the slope window is not stated mosqueragiraldo2015 X13. The membrane is described as regenerated cellulose and, once, cellulose acetate mosqueragiraldo2015 X1. Whether micelles or drug-loaded aggregates cross the 6–8 kDa membrane is not stated, so lower activity and slower diffusion are not separated; replicates are not stated lu2017b X8, X4; indulkar2017a X9, X12. In the Bioperformance papers units are not comparable between papers (µg/min, µg/(h·cm²), mg/min/cm²), and replicates and error definitions are often not stated [raina2015c X12; indulkar2016 X8]. A plateau needs a sink receiver and a stable donor [raina2014a C20]; the hollow-fibre module shows a continuing rise [hate2018 R9]. The plateau is not universal: with a sink receiver the PAMPA mass flow of atazanavir keeps rising above the amorphous solubility (F22) [hate2022 R19]. The position of the break is known only to within the spacing of the concentrations tested [hate2022 X13]. The area behind a printed µg/min is not always stated [elkhabaz2019b X6; wilson2018 R15]. The flux axes of the danazol paper carry no time unit, replicates are not stated and the crystalline reference flux differs between figures (about 0.0011 and 0.0008) jackson2016 X9, X10, X11. In the SDS study the flux values behind the stated supersaturation of about 65 are not printed indulkar2019b X6. In the ASD dissolution papers all felodipine ratios share one unreplicated crystalline slope, and no statistical test supports their equality alonzo2011 X4, X5. The danazol absolute fluxes do not reproduce from the example profile and the flux window per formulation is not stated jackson2015 X4, X6. Below 50 µg/mL the tacrolimus flux rose but did not extrapolate to zero, and the product donors' conditions are unclear trasi2016 X8, X7; flux was measured only for one resveratrol series wegiel2015 C10. The upper tacrolimus plateau is read as about 0.0053 µg/min in one chapter and ≈0.0055 µg/min in the ASD dissolution chapter, from the same result trasi2016 R14.

← Concepts and formulas

concept · as used in Dissolution

membrane transport

Passive transfer of dissolved drug across a membrane; in these papers a measure of free drug or activity [alhalaweh2016 C2; hate2017 C36]. Includes diffusion cells, Caco-2 monolayers and a hollow-fibre module.

Findings

F2, F6, F13, F21.

Related concepts

quantified as membrane flux; depends on membrane mass transfer coefficient.

Formulas

membrane flux in terms of solute activity.

How it is measured or obtained

See membrane flux; percentage transferred, receiver Cmax and AUC in the hollow fibre [hate2017 R3, R6].

Values in the library
materialvalue or classconditionspaper ids
nevirapine41.5% in 60 min (hollow fibre) against 1.50% (flat sheet)100 µg/mL[hate2017 R3]
ritonavir, atazanavirCaco-2 flux about halved in a 1:1 solutionHBSS pH 6.5[alhalaweh2016 R17]
telaprevir, bile saltstrihydroxy salts on the buffer curve; dihydroxy at 12 mM about 2-fold lowerlu2017b R10, R12
Pitfalls and disagreements

Only passive diffusion; active transport and P-gp are not covered [raina2014a C42].

← Concepts and formulas

concept · as used in Dissolution

metastable equilibrium

The state in which the drug-rich and the drug-lean phases coexist with equal activity while both remain supersaturated with respect to the crystal [raina2014a C33; alhalaweh2016 C1; indulkar2016 C23]. The Crystallization from solution papers extend it to amorphous precipitates and add cases: type 2 bases precipitate when the concentration is close to the amorphous solubility and keep a metastable equilibrium between solution and amorphous precipitate hsieh2012 C29; after danazol separates, the supersaturation stays constant because the drug-lean solution is in equilibrium with the droplets jackson2014 C28; the dihydropyridine precipitates are taken to be in metastable equilibrium with a supersaturated water-rich phase, so that crystallization can start in either, and for danazol the binodal compositions are x = 4.27 × 10⁻⁷ (water-rich) and 0.92 (droplet) mole fraction raina2015b C24, C39; jackson2016 R22.

Findings

Bioperformance: F1, F5, F10. Crystallization from solution: F1, F2, F4, F21, F22.

Related concepts

the state of liquid-liquid phase separation; related to chemical potential; characterizes amorphous precipitation; related to amorphous solubility.

Formulas

none.

How it is measured or obtained

Not measured as such; concentration or flux staying constant while two phases coexist [raina2014a C36]. In the pH-shift and danazol papers it is inferred from a concentration plateau at the amorphous solubility while the precipitate remains amorphous (Bjerrum data following the curve for the supernatant concentration, a pyrene ratio held at about 1.5), and by the later fall to the crystalline solubility hsieh2012 R8, R9; jackson2014 R8, R15.

Values in the library
materialvalue or classconditionspaper ids
telaprevira 130 µg/mL solution has the same flux as a 90 µg/mL solution; added drug increases the amount of drug-rich phase while the drug-lean concentration stays constant37 °Cmosqueragiraldo2015 C35, C36
danazol ASDsall except 50:50 HPMCAS exceed the amorphous solubility only brieflyjackson2015 C31
felodipineamorphous precipitates are probably viscous supercooled liquids in metastable equilibriumraina2015b C24
loratadineplateau 9.6–10.3 µg/mL to about 91 min against crystalline 1.6 µg/mLpH shift, 37 °Chsieh2012 R8, R10
danazol above 13 µg/mLpyrene about 1.5 for 9 min, then crystallization25 °Cjackson2014 R15
atazanavir (Bioperformance)metastable equilibrium until crystal nucleation, drug activity equal in both phasesASD-coupled dissolution and membrane transfer[hate2018 C5]
danazol–water, 25 °Cbinodal 4.27 × 10⁻⁷ and 0.92 mole fraction danazolfrom the onset and moisture sorptionjackson2016 R22
Pitfalls and disagreements

It lasts only until crystals nucleate (F10). The phase was not observed or analysed in the type 2 bases, and phase separation was "believed" to explain them hsieh2012 C34. For danazol, how LLPS affects subsequent crystallization is "not well understood" jackson2014 C45.

← Concepts and formulas

concept · as used in Dissolution

metastable zone

Evidence table: metastable zone. Content from the ASD dissolution chapter (2008, 2010) and the LLPS and Bioperformance chapters.

The range of supersaturation in which a solution is supersaturated with respect to the crystal but does not nucleate spontaneously, so that existing crystals can grow while new ones hardly form; above it lies the labile zone of spontaneous nucleation konno2008a C27. In the scheme of two crystallization routes, nucleation and growth deplete the solution once its concentration exceeds the metastable zone alonzo2010 C43.

Findings

F5.

Related concepts

related to nucleation, classical nucleation theory, supersaturation and binodal.

Formulas

classical nucleation theory.

How it is measured or obtained

Not measured in the ASD dissolution papers; inferred from the shape of concentration–time curves konno2008a C27, X4. On a temperature–concentration diagram of ritonavir the binodal and spinodal of liquid–liquid separation were mapped against the crystal solubility ilevbare2013a R11.

Values in the library
materialvalue or classconditionspaper ids
felodipine with HPMC or HPMCAS after an initial droptaken to sit in the metastable zone ("it appears")pH 6.8, 37 °Ckonno2008a C27, R12
ritonavir (LLPS chapter)crystal-supersaturated region below the binodal; binodal–spinodal gap smallwaterilevbare2013a C32, C34
felodipine, nifedipine (Bioperformance)the amorphous solubility lies within the metastable zone for crystal nucleationbuffer[raina2014a C30]
Pitfalls and disagreements

The metastable-zone limit of felodipine was not measured, so the reading of the plateaus as growth-limited rests on argument konno2008a C27. Seeded and unseeded tests later located the effect of HPMC on felodipine mainly in nucleation alonzo2012 R17.

← Concepts and formulas

concept · as used in Dissolution

micellar solubilization

Increase of the apparent solubility of a drug by incorporation into surfactant micelles; with Tween 80 above its CMC, ritonavir's crystalline solubility rose 2.7-fold and its LLPS concentration about 2.5-fold (synthesis: 46.1 ÷ 18.8 = 2.45), leaving their ratio about unchanged ilevbare2013a R16, X5. The papers of 2017–2022 add two cases. In 3.6 mg/mL SDS atazanavir's crystalline solubility rose from 1.1 to about 45.6 µg/mL and its amorphous solubility to about 1450 µg/mL, so the concentration ratio fell from about 65 to about 33 while the flux-derived activity ratio stayed at about 65 (molar solubilization ratio κ 0.006, 0.183 and 0.351 for crystal, measured and predicted amorphous) indulkar2017a R7, R9, R13. With 12 mM bile salts, STDC, STCDC, SGDC and SGCDC raised telaprevir's crystalline solubility 1.8–2.4 times and its GLPS onset about twofold, while STC and SGC did not lu2017b R1, R2, X9. New aspect (Bioperformance): uptake of drug into surfactant or bile-salt micelles raises the equilibrium solubility and the total concentration but not the free drug [raina2015c C30]. In simulated and pooled human intestinal fluids bile salts and lecithin raised the crystalline solubility proportionally more than the amorphous solubility (F18) elkhabaz2019b C35; high log P drugs are expected to show a positive food effect for this reason [nguyen2023a C77, C78]. New aspect (Crystallization from solution): In the bile-salt and surfactant papers the question is whether the surfactant raises the dissolved drug without raising its activity: STC at 0.1% raised the crystalline solubility only 1.1- to 3.5-fold across 11 drugs, whereas SDS at 0.1% raised it up to about 266-fold, and 12 mM dihydroxy bile salts needed about twice the telaprevir for the same activity chen2015 R1, R2; lu2017 R1. The 2018–2025 papers carry the question into bile salt–lecithin media and above the CMC of SDS, where micelles raise both the crystalline and the amorphous solubility but not the activity-based supersaturation at the amorphous solubility indulkar2018 R8, R12; indulkar2019b R1, R2; duong2022b R8. New aspect (Mesoporous silica): with drug-loaded silica, micelles act in two ways at once, by solubilizing released drug and, for a surfactant that competes for the silica surface, by displacing adsorbed drug; the authors write a three-way metastable equilibrium, drug adsorbed to silica ⇌ drug in solution ⇌ drug solubilized in micelles [dening2019 E11, C57]. They call micellar solubilization "therefore advantageous" for silica systems because it raises release and micellar drug replenishes free drug as it permeates, while cautioning that micelles "may actually reduce" the free fraction and the flux [dening2019 C60, C58, C59]. New aspect (Supersaturation from ASD dissolution): in the celecoxib suspension study each surfactant raised the Form III solubility steeply above its CMC, and supersaturation was referred to the solubility in each medium so that solubilization alone would not raise S chen2015a R5, C2, C3. In suspensions of enteric lopinavir dispersions at pH 3, drug leaching followed the solubilization of the crystalline drug by each surfactant, so that the leached concentration rose with the crystalline solubility in the same medium and their ratio stayed nearly constant for a given polymer li2016b C39, C40. With a polymer present STC at least doubled the crystalline solubility given by STC alone, and PVPVA with SDS raised it from 3.3 to 11.4 µg/mL li2016b R5, C43. A marketed tacrolimus product containing sodium lauryl sulfate reached the same maximal flux as the others, so no solubilization was seen at its level trasi2016 C38. New aspect (Release mechanism and LoC): two surfactant papers of 2021–2022 ask whether micelles explain the higher limit of congruency of surfactant-containing dispersions. Monomeric TPGS did not raise the crystalline solubility of felodipine (about 1.3 µg/mL, as in buffer), so no significant solubilization occurs without micelles saboo2021 C8, R2; since 2% TPGS raised the limit to 25% with TPGS below its CMC, and at 30% both 5% TPGS (below the CMC) and 10% TPGS (above it) released congruently, micellar solubilization plays "a negligible role" in the limit saboo2021 C33. For clopidogrel the effect on the LLPS concentration depended on the surfactant: SDS raised it only above its CMC, while TPGS and Tween 80 raised it at 50 but not at 5 µg/mL correasoto2022a C9, R3; up-field NMR shifts with 50 µg/mL TPGS below and above the LLPS concentration are read as solubilization of clopidogrel in the less polar micelles correasoto2022a C16, R11. The micellar content of FaSSIF did not raise HPMCAS-MF dissolution or release from 10% indomethacin–HPMCAS, consistent with polymer-controlled release bapat2023 C11, C20. In the 2025 bedaquiline study simulated intestinal fluids raised the crystalline solubility from undetected (pH 6.5) to 7.8 µg/mL (FaSSIF-V1), from below 0.1 to 258.8 µg/mL (FeSSIF-V2) and to 628 µg/mL (FeSSIF-V1), and cut drug–HPMCAS complexation from up to about 90% to at most about 29%; the authors read the micelle affinity of the drug cation as the reason the complex does not form ("explains") kaur2025 R2, R6, R8, C36, C39.

Findings

Amorphous solubility and LLPS: F12, F16, F17, F18. Bioperformance: F3, F4, F16, F18. Crystallization from solution: F19, F28, F29, F31, F32, F34, F38. Mesoporous silica: F12. Supersaturation from ASD dissolution: F7, F14, F15, F19, F28. Release mechanism and LoC: F21, F23, F34.

Related concepts

surfactant above the critical micelle concentration; leaves thermodynamic activity unchanged; raises crystalline solubility. Papers of 2017–2022: described by the micelle/water partition coefficient; cost for transport: solubility-permeability interplay; measured on the activity scale by activity-based supersaturation. Contrasts with nanodroplet reservoir effect; lowers free drug concentration; measured by membrane flux; related to mixed micelles. Competes with drug adsorption onto silica together with competitive adsorption of the surfactant; related to supersaturation. Distinct from surfactant partitioning into the drug-rich phase; ruled out as the cause of a higher limit of congruency with TPGS.

Formulas

solid-liquid equilibrium solubility equation. Activity from concentration, micelle-water partition coefficient, membrane flux from permeability and concentration, membrane flux in terms of solute activity, supersaturation from membrane flux ratio, supersaturation ratio.

How it is measured or obtained

Crystalline solubility and LLPS concentration with and without the surfactant, 500 µg/mL Tween 80 in 100 mM phosphate pH 6.8 at 37 °C ilevbare2013a P1, P5, A6. In the Bioperformance papers crystalline solubility is measured against surfactant concentration and free drug by flux or ultracentrifugation [raina2015c P1; indulkar2017a R11]. In the bile-salt and surfactant papers: 48 h shake-flask solubility with and without the surfactant, a membrane mass flow that follows the activity, and an activity-based supersaturation calibrated from the flux chen2015 P1; li2016a P8, R15; lu2017 E1, E2. In the Mesoporous silica papers: crystalline and amorphous solubility of ritonavir with SDS (28 µg/mL) and Vit E TPGS (28 and 500 µg/mL; cited CMC 212 µg/mL) in pH 6.8 phosphate at 37 °C, and release from ritonavir–SBA-15 dosed at the amorphous solubility of each medium [dening2019 P1, P2, P9, M3]; release in FaSSIF dosed at its amorphous solubility [dening2018 P6, R21]. In the ASD dissolution papers: excess Form III stirred 48 h at 25 °C in pH 3 HCl with the surfactant, ultracentrifuged and assayed by HPLC chen2015a P6; crystalline solubility in every leaching medium, with excess polymer, 48 h at 25 °C, ultracentrifuged li2016b P5; break of crystalline solubility against surfactant concentration as the CMC li2016b P3. In the release-mechanism papers: crystalline solubility against surfactant concentration with and without 900 µg/mL PVPVA saboo2021 R2; LLPS concentration by UV extinction, centrifugation and diffusion cell with 5 and 50 µg/mL surfactant correasoto2022a R3.

Values in the library
materialvalue or classconditionspaper ids
ritonavir with 500 µg/mL Tween 80crystalline 1.3 → 3.5 µg/mL; LLPS 18.8 → 46.1 µg/mL37 °Cilevbare2013a R16
felodipine with 0.04% vitamin E TPGScrystalline solubility up almost 40-fold; concentration ratio 9.2 → 4.537 °C[raina2015c C29]
atazanavir with SDScrystalline 1.1 → 45.6 µg/mL; κ 0.006 (crystal), 0.183 (amorphous), 0.351 (predicted)0–3.6 mg/mL SDS, pH 6.8, 37 °Cindulkar2017a R7, R9
telaprevir with 12 mM bile saltscrystalline 5.2 → 11.1 (STDC), 12.2 (STCDC), 12.4 (SGDC), 9.6 (SGCDC), 6.7 (STC), 6.2 µg/mL (SGC)50 mM pH 6.5, 37 °Clu2017b R1
felodipine1.1 to 35.3–49.0 µg/mL with six additives above CMC / 0.1–1%37 °C[raina2015c R2]
nifedipine10.3 to 53.4–90.7 µg/mL37 °C[raina2015c R3]
atazanavir + SDSconstant about 1 µg/mL to 0.5 mg/mL SDS, then 2.6 / 22.2 / 45.6 µg/mL at 0.6 / 2.0 / 3.6 mg/mLpH 6.8indulkar2017a R7, R8
celecoxib Form IIISDS 0.25% 14.5, STC 0.75% 5.8 µg/mL25 °Cchen2015a R5
posaconazolecrystalline 0.23 (buffer) to 3.2 µg/mL (FaSSIF-V1); amorphous 8.1 to 43.3six media, 37 °Celkhabaz2019b R1, R2
atazanavircrystalline 1.4 to 7.1 µg/mL; amorphous 79 to about 99–102six media, 37 °Celkhabaz2019b R1, R2
pretomanidequilibrium solubility about 3-fold (FaSSIF V1) and 6-fold (FeSSIF V2) the buffer value37 °C[nguyen2023a R1, C33]
11 drugs, 0.1% STC and SDSSTC 1.1–3.5-fold; SDS 1.2–266-fold25 °C (telaprevir 37 °C)chen2015 R1
celecoxib, 0.1% STC, SGC, HPMCASsolubility 1.2 → 2.9, 2.4, 2.4 µg/mL; mass flow unchanged (0.44–0.46 µg/min)pH 6.5, 37 °Cli2016a R15
telaprevir, 12 mM STDC, SGDC, STCDCabout 140 against 60 µg/mL for the same δ 11.5pH 6.5, 37 °Clu2017 R1
ritonavir, cilnidipine; buffer, FaSSIF-V1, Composite-SIFamorphous/crystalline ratio 12 → 8.4, 7.8 and 36.5 → 12.9, 13.7; ritonavir SRamorph 9.2–10 throughoutpH 6.5, 37 °C, 3 mM bile saltindulkar2018 R8, R12
telaprevir, 3.72 and 5.58 mM bile salt mixturesδ 11.5 at about 72–77 against 60 µg/mL in buffer50 mM phosphate pH 6.5, 37 °Clu2018 R1.h, R2
atazanavir, SDS above the CMC (0.5 mg/mL)crystalline about 46 and amorphous about 1480 µg/mL at 3.6 mg/mL; concentration ratio about 35–38 against SRamorph stated about 6550 mM phosphate pH 6.8, 37 °Cindulkar2019b R1, R2, X6
posaconazole, five biorelevant mediaconcentration ratio 17.9–20.7 against 28.3–33.7 in buffers; Km/w about 635–1820 at the amorphous and about 1440–3240 at the crystalline solubility37 °C, pH 1.6–6.5duong2022b R8, R14
atazanavir, posaconazole in aspirated human fluidconcentration ratio about 15 and 5.4 against cited activity ratios 54 and 30pH 7.3, 37 °Celkhabaz2021 R1, R4, X14
ritonavir, 28 µg/mL SDS; 28 and 500 µg/mL Vit E TPGScrystalline 3.6 → 6.6; 11.8; 14.9 µg/mL; amorphous 27.9 → 26.8; 27.7; 76.6 µg/mLpH 6.8, 37 °C[dening2019 R1]
ritonavir–SBA-15 in micellar Vit E TPGS69% at 30 min against 50% in buffer; bound drug 72 against 146 mg/g; crystallized about 45 mindose 77 µg/mL[dening2019 R18, R19]
ritonavir in FaSSIFcrystalline 8.8, amorphous 42.7 µg/mL; release from SBA-15 about 71% against about 50%dose 43 µg/mL[dening2018 M1, R21]
celecoxib Form III, SDS 0 → 0.40%1.1 → 92.6 µg/mLpH 3, 25 °Cchen2015a R6
STC 0.10 → 1.50%1.8 → 26.0 µg/mLpH 3chen2015a R7
polysorbate 80 0 → 1%1.2 → 198.4 µg/mLpH 3chen2015a R8
Triton X100 0 → 0.15%1.2 → 59.6 µg/mLpH 3chen2015a R9
Poloxamer 188 0.002 → 3%1.4 → 2.5 µg/mLpH 3chen2015a R10
lopinavir with HPMCAS-HF, + SDS / Poloxamer 188 / polysorbate 80 / STC3.3 / 3.0 / 4.5 / 7.2 against 1.9 µg/mLpH 3, 25 °Cli2016b R5
lopinavir with HPMCAS-HF, PVPVA and SDS11.4 µg/mLpH 3, 25 °Cli2016b R5
lopinavir with HPMCAS-HF and SDS at pH 56.3 µg/mL25 °Cli2016b R5
delamanid, crystalline0.52 (FaSSIF V1), 2.30 (FeSSIF V2), 13.10 (FEDGAS pH 4.5) and 57.97 µg/mL (FEDGAS pH 3.0) against below 0.02 µg/mL in buffer above pH 5.537 °Cnguyen2023b R13, R18
praziquantel, amorphous and crystallineamorphous 1.74 and 1.70, crystalline 0.31 and 0.43 mg/mL in FeSSIF-V2 (racemate, R-enantiomer) against 1.17/1.39 and 0.16/0.23 mg/mL in PBS pH 6.537 °Calvarenga2025 R1
delamanid, amorphous69.9 (FaSSGF), 7.93 (FaSSIF V1), 3.11 (FaSSIF V2) and 0.76 µg/mL (PBS pH 6.5)37 °Cduong2022a R1
felodipine with monomeric TPGScrystalline solubility ≈1.3 µg/mL, as in buffer; slope change near 48 (buffer) and 40 µg/mL TPGS (with PVPVA)37 °Csaboo2021 R2, C8, P1
clopidogrel in buffer; with 50 µg/mL TPGS; with 50 µg/mL Tween 80LLPS concentration 23 ± 3; 29 ± 2; 30 ± 2 µg/mL37 °Ccorreasoto2022a R3
clopidogrel with 5 µg/mL TPGS, CTAB or 50 µg/mL SDS20 ± 1 µg/mL37 °Ccorreasoto2022a R3
neat HPMCAS-MF in FaSSIF; in blank FaSSIF buffer≈0.56; ≈0.57 mg/min/cm²pH 6.5, 12 mM/ΔpHbapat2023 R7
bedaquiline in FaSSIF-V1, FeSSIF-V2, FeSSIF-V1crystalline solubility 7.8, 258.8, 628 µg/mL37 °Ckaur2025 R2
Pitfalls and disagreements

Whether the surfactant enters the drug-rich phase and the activity in the micellar solution were not measured ilevbare2013a C54. Total concentration in micelles overstates the driving force (F12). Total concentration in micelles overstates the driving force; the micelle/water partition coefficient depends on the drug concentration, so a prediction from the crystalline solubility overshoots about twofold for atazanavir in SDS indulkar2017a C46, C48. Whether micelles cross the 6–8 kDa membrane was not tested indulkar2017a X9; lu2017b X8. In the Bioperformance papers the micelle capacity changes with drug load, so a single partition coefficient is wrong [raina2015c C37]; it was not measured there. In human fluid the micelles added proportionally less drug at the amorphous than at the crystalline solubility; the printed partition coefficients are total-to-buffer ratios, one higher than the defining equation gives (F18) elkhabaz2019b R11, X2. A ratio of concentration to solubility understates the supersaturation when the solubilizer raises the solubility but not the activity (celecoxib with STC, SGC and HPMCAS) li2016a X18; at matched ratio the SDS runs held up to 36 times more drug chen2015 X4. In micellar media the partition coefficient falls with drug concentration, so a concentration ratio near 20 can correspond to an activity ratio near 34; the posaconazole paper converts by assuming a linear fall between the two solubilities duong2022b C9, C26, E11. Mesoporous silica: both Vit E TPGS media crystallized between 30 and 45 min, so it is "not clear" whether release had finished [dening2019 C34]; the release gain was not shown as a flux gain [dening2019 C58]. The FaSSIF gain is attributed "likely" to micellar solubilization and better wetting, neither measured [dening2018 C48]. The silica papers' view that micellar drug replenishes free drug as it permeates [dening2019 C60, C58] sits against the Bioperformance statement that micelles raise the total concentration but not the free drug [raina2015c C30]; the silica authors themselves caution that micelles may reduce the free fraction and the flux [dening2019 C59]. In the celecoxib suspensions the solubility used to normalize S in SDS was measured without the leached HPMCAS present chen2015a X10, and two test-level solubilities are not in the supplementary tables chen2015a X14. The surfactant-titration curves of the lopinavir study give lower solubilities than its table for the same media, and the reading that polymers weaken Poloxamer 188 rests on them li2016b X3, X4; leached HPMCP shifted the SDS break to about 0.1% li2016b R11. A modest gain in a fed medium leaves room for the medium to act on crystallization instead: praziquantel release fell to about 34–52% in FeSSIF-V2 at 1.5 mg/mL alvarenga2025 R18, C29, whereas the several-hundredfold gain for delamanid raised the release of the marketed tablet nguyen2023b R14, C29. The TPGS concentrations listed for the felodipine runs assume complete release into 100 mL; only about half the TPGS had been released at 60 min, so the bulk concentration was about half the listed value saboo2021 X14. Micellar solubilization and disruption of the complex were not separated in FaSSIF-V1 kaur2025 X13.

← Concepts and formulas

concept · as used in Dissolution

microenvironmental pH

Evidence table: microenvironmental pH (names merged there: diffusion layer pH, microenvironmental pH, surface pH). Content from the release-mechanism chapter (2022–2025), with rows from the Bioperformance and Peptide permeability chapters.

The pH at a dissolving surface, in its gel layer or in the adjacent boundary layer, which can differ from the bulk pH. When an acidic polymer dissolves above its pKa, ionization releases protons and lowers the interfacial pH, which can lower solubility and dissolution; the protons leave by diffusion, by neutralization with hydroxyl ions from the bulk or through proton carriers (buffer species), and finite diffusion times give a surface-to-bulk gradient set by hydrodynamics, the pKa and solubility of the solute and the pKa and concentration of the buffer (cited) qi2022 C24. HP-50 is extensively ionized at pH 6.8 given its pKa of 4.2, "but the pH at the dissolving surface may differ" qi2022 C23. For HPMCAS-MF a lower pH at the polymer–solution interface, set up by the protons the ionizing polymer releases, is called "probable" and is "strongly supported" by the gel measurements; more buffer species carry more protons to the bulk and lessen the drop bapat2023 C38, C39. Polymer release rate was highly correlated with gel-layer pH, which was substantially lower than bulk pH bapat2023 C51. In the Bioperformance chapter a base was added to pretomanid–HPMCAS-HF dispersions in the expectation that it raises the microenvironmental pH and so speeds polymer dissolution [nguyen2023a C26]. In the Peptide permeability chapter a high local concentration of permeation enhancer at the tablet surface raised the surface pH and changed insulin release [fagan2025 C33]. The papers of 2024–2025 use the HPMCAS gel pH of 6.0 in 50 mM pH 6.8 phosphate (measured in 2023) as the pH at which a weak base meets the ionized polymer, so complexation was measured at pH 6.0, and weak bases are more ionized there than in the bulk bapat2024 C9, C48, R20; bapat2025a C28, R15; kaur2025 C44, R22. The 2025 grade paper measured the pH of polymer slurries in water, taken as the lowest possible surface pH: 4.52 (LF), 4.61 (MF) and 4.73 (HF) bapat2025a C10, M3, M4, M5.

Findings

Release mechanism and LoC: F23, F24, F32, F33.

Related concepts

set by buffer capacity and buffer pKa; decides whether the polymer reaches its critical ionization for polymer dissolution; avoided by polymer salt formation; located in the gel layer and the unstirred water layer; related to polymer ionization.

Formulas

boundary-layer diffusion flux (film model).

How it is measured or obtained

Gel-layer apparent pH by indicator absorbance: HPMCAS made with chlorophenol red or bromothymol blue, compacted, exposed in the rotating-disk apparatus, the gel removed and its spectrum read bapat2023 P10. In the HP-50 paper surface pH was not measured; a cited gradient for HP-50 films was used qi2022 R18, X16. In the Peptide permeability chapter, the pH of saturated enhancer suspensions and the colour of a pH indicator drop on the tablet surface [fagan2025 R5, R19].

Values in the library
materialvalue or classconditionspaper ids
HP-50 films (cited)surface pH ≈0.4 units below bulkphosphate of similar capacityqi2022 R18
HPMCAS-MF gel at 13, 26, 51 mM/ΔpH; pH 7.5 phosphateapparent pH 5.6, 6.0, 6.2; 6.3, against rates ≈0.60–1.09 mg/min/cm²bulk pH 6.8 or 7.5bapat2023 R15, R16
HPMCAS-TEA gelapparent pH 6.7, rate ≈1.62 mg/min/cm²50 mM pH 6.8 phosphatebapat2023 R16, C41
C10 and SNAC minitablets (Peptide permeability chapter)surface pH near 8 and near 7 by indicator; suspensions pH 8.8–9.2 and 7.6–7.9biorelevant media[fagan2025 C36, C8]
HPMCAS LF, MF, HF slurries in waterpH 4.52, 4.61, 4.73overnight stirringbapat2025a M3, M4, M5
25% loratadine–HPMCAS-MF on a cited gel-pH axis 6.0, 6.2, 6.3release ≈0.12, 0.29, 0.68 mg/min/cm²three buffersbapat2024 R15, X6
Pitfalls and disagreements

The HP-50 paper calls polymer ionization the rate-limiting step in the abstract but "likely" in the discussion; surface pH, proton flux and gel hydration were not measured, and the proton-carrier argument uses calculated buffer pKa values and a cited gradient qi2022 X16. The HPMCAS values are apparent pH of gel removed from the compact, not an in situ profile bapat2023 P10. Only the gel pH of 6.0 has a stated source; the 6.2 and 6.3 values of the 2024 plot do not bapat2024 X6. The MF slurry pH has no stated source bapat2025a X4.

← Concepts and formulas

concept · as used in Dissolution

mixed micelles

Aggregates of bile salts with phospholipids and their hydrolysis products, the good drug solubilizers of intestinal fluid; the bile-salt papers worked with single bile salts and name mixed micelles with lecithin as the next, more biorelevant step chen2015 C4; lu2017 C42. From 2018 the library measures mixed micelles of bile salt and lecithin directly in crystallization tests: lecithin shortens induction times and raises the amorphous solubility of atazanavir, its digests accelerate more, and the bile salt to phospholipid ratio sets the induction time in volunteer media indulkar2018 R16, R6; enright2020 R10, R18.

Findings

F28, F32, F39, F40, F41, F43.

Related concepts

related to bile salt micelles and biorelevant media.

Formulas

none.

How it is measured or obtained

Not measured in these papers.

Values in the library
materialvalue or classconditionspaper ids
telaprevir, single bile saltssystems with micelles and a drug-rich phase are called probably the most relevant in vivo and need lecithin mixed micellespH 6.5, 37 °Clu2017 C42
FaSSIF-V1, Composite-SIFunimodal 49 ± 4 nm; bimodal 63 ± 4 nm (56%) and 3.9 ± 0.4 nm (44%)DLS, 173°indulkar2018 R5
atazanavir, 3 mM STC with 0–0.75 mM lecithininduction time about 595 → 43 min; amorphous solubility 38 → about 82 µg/mLpH 6.5, 37 °Cindulkar2018 R16, R6
atazanavir, volunteer media with 350 µM phospholipidbile salt:phospholipid 1.6–14.7; 23–33 against 112–144 minpH 6.5, 37 °Cenright2020 R18, E2
posaconazole, FaSSIF-V1 against FaSSIF-V2more lecithin gives higher amorphous solubility and Km/w for posaconazole, not for atazanavirbiorelevant and human fluidselkhabaz2019b C38
Pitfalls and disagreements

Lecithin was absent from all the bile-salt studies of this chapter's papers up to 2017, and may alter solubility and kinetics li2016a C64. The two proposed lecithin routes (taurocholate drawn into mixed micelles; lecithin lowering the interfacial energy of the nucleus) were not measured indulkar2018 C40; elkhabaz2021 C25.

← Concepts and formulas

concept · as used in Dissolution

moisture-induced crystallization

Crystallization of an amorphous drug, alone or in a dispersion, that sorbed water starts or speeds up. In the library it is measured as a nucleation rate, a crystal growth rate or a crystallized fraction that rises with storage relative humidity [konno2008 C11; rumondor2010 C8, C9; rumondor2009b C7]. Two routes are distinguished: water raises molecular mobility (plasticization) and may raise the drug's chemical potential, or water first splits a dispersion into drug-rich and polymer-rich amorphous phases, from which the drug-rich phase crystallizes [marsac2008a C1, C26; rumondor2009c C5; marsac2010 C25]. New aspect (Supersaturation from ASD dissolution): it serves as the solid-state comparison for the polymer ranking in dissolution: dry felodipine dispersions with PVP, HPMC and HPMCAS nucleated alike, whereas with moisture HPMCAS and HPMC inhibited crystallization better than PVP (cited) konno2008a R18. The resveratrol dispersions that resisted crystallization at high humidity (PVP, E100) also stayed amorphous in buffer but gave no concentration gain, and those that crystallized at high humidity (HPMC, HPMCAS, CMCAB) also crystallized in buffer at 35% drug wegiel2015 R21, C7, C9. Indomethacin dispersions at 60% drug with HPMC or EPO crystallized within 5 days at 40 °C/75% RH, the EPO–HPMC ternary not within 100 days xie2017 R26.

Findings

Physical stability: F9, F11, F15, F24, F25, F33, F34. Supersaturation from ASD dissolution: F4, F6, F16, F20.

Related concepts

depends on plasticization by water and water sorption; can follow moisture-induced phase separation; part of solid-state crystallization of amorphous drugs; related to hygroscopicity; related to physical stability and crystallization inhibition by polymers.

Formulas

none specific; the water uptake that drives it is described by Flory-Huggins water sorption isotherm.

How it is measured or obtained

Storage over saturated salt solutions at fixed RH and counting of birefringent nucleation sites in spin-coated films [konno2008 P3, P4]; growth of existing crystals in films at fixed RH [rumondor2010 P3, P4, P5]; PXRD crystallinity of stored powders with PLS calibration [rumondor2009b P5]; AFM and polarized light on films after 1–16 h at 94% RH [marsac2010 P14, R19]. Outside the subcategory, SHG imaging of spray-dried dispersions at 40 °C and 75–82% RH [correasoto2017 R4, C15].

Values in the library
materialvalue or classconditionspaper ids
amorphous felodipine filmnucleation ≈1.4 × 10⁵ → 2.9 × 10⁶ m⁻³ s⁻¹0 → 75% RH, 22 °C[konno2008 R1.a, R3.a]
amorphous nifedipine filmnucleation ≈4.7 × 10⁵ → 6.8 × 10⁶ m⁻³ s⁻¹0 → 75% RH[marsac2008a R1.a]
amorphous felodipine filmgrowth ≈0.030 → 0.066 mm/min (13–80% RH), 2.3–2.8 mm/min at 87–93% RH, with needleshumidity stage, 25 °C[rumondor2010 R1, C9]
felodipine–PVP 25% powder1.2% (0% RH) to 82.1% (93% RH) crystallized after ≈494 days22–25 °C[rumondor2009b R9.a, R9.g]
felodipine–HPMCAS 50% powder9.2–16.6% at every RH after ≈490 days22–25 °C[rumondor2009b R9]
felodipine–PVP 50% filmcrystals by 4 h at 94% RH, after phase separationAFM, polarized light[marsac2010 R19, C24]
FTM–HPMCAS spray-dried dispersion (outside)faster crystallization at 82% than at 75% RH40 °C, SHG[correasoto2017 C15]
Accord tacrolimus capsules (outside)rapid crystallization in the powder blend40 °C/75% RHpurohit2019 C33
resveratrol with HPMC, HPMCAS, CMCAB, PAAcrystalline at the first sampling at 84% RH, then fully; PVP and E100 not25 °C[wegiel2013b R12, R14, R16]
curcumin dispersionsat 84% RH: E100 > 350, cellulosics 75, PVP 22, neat 14 days25 °C[wegiel2014 R13]
indoprofen–PVPseparation at 54% RH, crystals from 75% (30% PVP) or 84% RH (50% PVP)22 °C films[rumondor2011 R11, R14]
lumefantrine–CAP 40:60 precipitated into water (9% water)crystalline from the first day at 40 °C/75% RH; amorphous 3 months under vacuumPXRD[bhujbal2021 R4.a, R5, R10, C17]
tacrolimus generic capsule contents≈36, 68 and 84.5% at 30, 35 and 40 °C/75% RH, ≈11% at 40 °C/54% RH, 4 weeksopen dishtrasi2017 R14
felodipine dispersions with PVP, HPMC, HPMCAS (cited)no difference dry; HPMCAS ≈ HPMC > PVP at high RHstoragekonno2008a R18
flutamide and ezetimibe HPMCAS dispersions (Solid-state methods)first storage time with detected crystallinity, by methodstorage[correasoto2017 R1]
tacrolimus capsules (Bioperformance)% crystallized against storage timestoragepurohit2019 R1
resveratrol dispersions (storage, cited)PVP, E100 stable; HPMC, HPMCAS, CMCAB crystallized at high RHstoragewegiel2015 R21
indomethacin 60% with HPMC; EPO; EPO–HPMCcrystals within 5 days; within 5 days; amorphous beyond 100 days40 °C/75% RHxie2017 R26

Evidence table: moisture-induced crystallization.

Pitfalls and disagreements

The growth jump of felodipine above 80% RH has no counterpart in water uptake or Tg, and its cause is "currently unknown" [rumondor2010 C31, C33]. Bulk powder of pure amorphous felodipine crystallized within 12 days at 0% as well as at 93% RH, so at that resolution water made no difference [rumondor2009b R12, X8]. Whether crystallization follows the wet one-phase route or the phase-separated route changes how polymer content acts (no effect of PVP level at 93% RH) [rumondor2009b C20, C21]. For resveratrol the authors "do not fully understand" why humidity acted more than heat, and the contrast fails at 120 °C [wegiel2013b C40, X8]. In the precipitated lumefantrine series water content varies with the polymer, so the water effect is inferred [bhujbal2021 C51, C56]. A solid-state ranking under moisture need not hold in dissolution: HPMCAS and HPMC were alike in humid solids but HPMCAS dispersions gave far more supersaturation, and the authors suggest the inhibition mechanisms "may vary" with the amount of water konno2008a C33, C34.

← Concepts and formulas

concept · as used in Dissolution

molecular mobility

How fast molecules of an amorphous solid move and rearrange, the kinetic side of crystallization next to the driving force [marsac2006a C4; vaneerdenbrugh2010a C3]. In the library it is read from Tg (higher Tg, lower mobility at a given temperature), from enthalpy relaxation times, from melt viscosity and from model relaxation times, and water raises it by plasticization [konno2006 C2; marsac2006a R4.n; kestur2010b R10; rumondor2010 E1; marsac2008a C1].

Findings

F5, F9, F13, F14, F21, F22.

Related concepts

indicated by glass transition temperature; measured by enthalpy relaxation and structural relaxation time; raised by plasticization by water; related to kinetic barrier to nucleation.

Formulas

Kohlrausch-Williams-Watts equation, Stokes-Einstein equation; the AGV equation is listed on the chapter page as table only.

How it is measured or obtained

Enthalpy recovery after ageing fitted with the KWW function [konno2006 P6; marsac2006a P9]; zero-shear melt viscosity [kestur2010b P4]; Adam–Gibbs–Vogel relaxation time from Tg [rumondor2010 P8]; Tg and Tg − T as indicators [marsac2008a R8].

Values in the library
materialvalue or classconditionspaper ids
amorphous nifedipine, felodipineτ 6.3 and 4.2 h at 23.5 °C; nucleation 2–4 times faster for nifedipinedry[marsac2006a R4.n, C13]
felodipine with 3 wt% PVP K-12, K-29/32, K-90melt viscosity ≈58, 156, 690 Pa·s vs ≈44 Pa·s alone100 °C[kestur2010b R10.c]
amorphous felodipine filmsgrowth follows AGV mobility to the power 0.513–75% RH[rumondor2010 R7, C27]
pimozide–PVPmoisture-induced separation much slower at 4 °C than at 22 °C75% RH[rumondor2009c R11, C41]
ketoprofen–PVPwet Tg −23 °C, mobile, yet no separation94% RH[rumondor2009c R25, C38]
coated ASD powders (outside)crystallization onset linked to Tg − T at the storage condition40 °C[moseson2022a C24, C25]
ritonavir ASDs (outside)Tg only a crude indicator of mobilitydegradation study[alvarenga2022 C21]
celecoxib with miscible surfactantsmain effect "most likely" on mobilityTg-scaled growth[mosqueragiraldo2014 C30]
felodipine free surfacefaster growth "may be attributed" to mobile surface moleculesfilms[kestur2013a C16]

Evidence table: molecular mobility.

Pitfalls and disagreements

Bulk mobility measures did not rank crystallization: DSC relaxation may not describe "the motion involved in nucleation", viscosity "cannot be used as a precise measure" of drug mobility, and growth outran AGV mobility [marsac2006a C37; kestur2010b C24; rumondor2010 C26]. Mobility sets the rate of moisture-induced separation but does not cause it [rumondor2009c C35, C41; li2017 C44]. Tg did not rank polymers for acetaminophen, flutamide, resveratrol or curcumin [trasi2012a C18; trasi2012b C33; wegiel2013b C33; wegiel2014 C22].

← Concepts and formulas

concept · as used in Dissolution

molecular recognition

The specific fit between molecules that lets them assemble in a given arrangement; in crystal engineering hydrogen bonding is the most reliable directional interaction for it [vaneerdenbrugh2011a C2]. In the physical-stability papers it is the name for how an additive may order the drug locally or enter its pre-nuclei, an effect that classical nucleation theory does not directly contain [trasi2012a C48, C49].

Findings

F17.

Related concepts

part of nucleation; contrasts with classical nucleation theory; related to hydrogen-bond donor and acceptor groups and self-association.

Formulas

classical nucleation theory (which does not contain it) [trasi2012a C49].

How it is measured or obtained

Not measured directly in these papers; it is inferred when an additive changes nucleation in a way that growth inhibition, Tg or hydrogen bonding do not explain [trasi2012a C50, C52; trasi2012b C47].

Values in the library
materialvalue or classconditionspaper ids
acetaminophen with 10% w/w PAA26 nuclei per cycle against 10.8; PAA "may" exert a local ordering effecthot-stage cycle to −30 °C[trasi2012a R12.e, C50]
flutamide with 10 mol% nilutamide (structural analogue)one nucleus in the imaged region; nilutamide "may" enter prenuclei and block themfilm cooled to −30 °C and reheated[trasi2012b R12, C47]
15 drugs with 7 polymers (other chapter)hydrogen-bond recognition rules applied to choose polymers that prevent crystallizationspin-coated films[vaneerdenbrugh2011a C51]
Pitfalls and disagreements

Both physical-stability uses are hypotheses: local ordering of acetaminophen near PAA and nilutamide inside flutamide prenuclei were not observed [trasi2012a C50; trasi2012b C47]. The acetaminophen counts behind the PAA reading add up nucleation over zones of different width, so PAA need not raise the rate per unit time [trasi2012a X8].

← Concepts and formulas

concept · as used in Dissolution

nanodroplet agglomeration

Evidence table: nanodroplet agglomeration (names merged there: droplet agglomeration, nanodroplet agglomeration). Content from the release-mechanism chapter (2023–2024), with a row from the Bioperformance chapter.

The joining of drug-rich droplets into clusters or networks

In the 2024 PVP molecular-weight paper droplets that formed in the gel of short-chain PVP dispersions joined into strands anchored in the gel near the gel–solution boundary and stayed there while the polymer left, a release failure the authors name "Failure Mode I", distinct from phase inversion deac2024a R10, C26, C38. In the 2023 surfactant study Tween 80 let ritonavir droplets agglomerate at the gel surface and leave as chunks, which "could potentially explain" slower release yang2023 R10, C20. In the Bioperformance chapter atazanavir droplets with PVPVA agglomerated in solution during a dissolution–absorption run [hate2018 C27].

Findings

Release mechanism and LoC: F29, F31, F16, F20, F25.

Related concepts

prevented, in the authors' hypothesis, by polymer chain entanglement above the critical entanglement molecular weight; not prevented by steric stabilization in dilute solution; contrasts with phase inversion as a cause of the limit of congruency; acts on drug-rich nanodroplets.

Formulas

none.

How it is measured or obtained

Confocal imaging of dye-labelled humid films and of the edge of dissolving compacts deac2024a P10, P8; yang2023 P7, P8; DLS size and PDI in solution [hate2018 R20].

Values in the library
materialvalue or classconditionspaper ids
clotrimazole–PVP K12 10%droplet strands by 11 h; network at the gel–solution boundary within 2 min100% RH films; in situ compact edgedeac2024a R7, R10
clotrimazole–PVP K29/32 10%no agglomeration (films, 11 h; compact, >7 min)samedeac2024a R7, R10
ritonavir–PVPVA + Tween 80, 30%droplets agglomerated in the gel, released as chunkscompacts, confocalyang2023 R10
atazanavir solution with PVPVA (Bioperformance chapter)≈245 nm to ≈10000 nm over 105 minDLS[hate2018 R20]
Pitfalls and disagreements

Agglomeration in the gel was imaged for one short grade, at a loading other than the one released, and inferred for two others deac2024a X7, X11. Droplet growth in dilute solution did not differ with the PVP grade, so solution tests do not predict agglomeration in the gel deac2024a R5, C44.

← Concepts and formulas

concept · as used in Dissolution

nanodroplet reservoir effect

The proposal that the drug-rich phase replenishes drug absorbed from the water phase, keeping the activity and flux at their maximum for as long as it lasts mosqueragiraldo2015 C39; indulkar2015 C54, C55. In the Amorphous solubility papers of 2013–2016 it is argued from the flux plateau and from earlier work: none of them depleted the dissolved drug and followed resupply mosqueragiraldo2015 C39. The flow-through experiments of 2016 test it, by the length of the steady receiver period against the excess over the onset [indulkar2016 R5, R6]. The papers of 2017–2022 add that Sugihara and Taylor expect the amorphous particles to maintain supersaturation by replenishing absorbed drug ("is expected"), and Indulkar and co-workers that an LLPS system sustains maximum flux while a micellar system at the same total concentration gives lower flux; neither flux with and without particles nor resupply was measured in these papers sugihara2018 C43; indulkar2017a C61, C62. New aspect (Bioperformance): replenishment of absorbed free drug by dissolution of drug-rich droplets, which keeps the solution at the amorphous solubility and the flux at its maximum until the droplets are used up [indulkar2016 C25, C31; raina2014a C38]. Micelle-solubilized drug is not an equivalent reservoir [indulkar2016 C26]. A depot role was proposed for amorphous aggregates in vivo, with little in vivo data [wilson2018 C8, C40]; in a PAMPA cell nanodroplets are said to raise the concentration at the donor-side membrane surface and remove the unstirred-layer gradient [hate2022 C58, C61, C76]. New aspect (Mesoporous silica): silica formulations are the library's case where the reservoir is absent. Released drug approached but did not exceed the amorphous solubility, so no drug-rich phase formed to replenish absorbed drug [dening2018 C32, C44], and an acid-first atazanavir–silica run reached the amorphous solubility without LLPS, from which the authors infer that the reservoir "may not occur" with silica [hate2020a R23, C54]. New aspect (Supersaturation from ASD dissolution): in the dispersion-dissolution papers the reservoir idea is cited, not tested: a drug-rich phase in metastable equilibrium with the water "has been suggested" to keep supersaturation constant while drug is absorbed jackson2015 C8, and a polymer that promotes LLPS "may be preferable" for that reason trasi2015b C46. For indomethacin, the droplets that a fast-releasing EPO–HPMC dispersion formed in acid redissolved within minutes when the pH rose to 5, which the authors call a reservoir that becomes available on dilution to higher pH; here the reservoir means redissolution, not replenishment during membrane transport xie2017 C42, X9. New aspect (Release mechanism and LoC): Que and co-workers (2019) take as their starting point "an emerging opinion" that drug-rich colloids act as a reservoir sustaining maximum flux, so that the optimal outcome of ASD dissolution is to exceed the amorphous solubility with colloid formation que2019 C3. They add that the smaller colloids formed with surfactants have a larger specific surface area, which "can potentially" improve absorption through faster replenishment, so colloid size should be considered when formulations release alike que2019 C54. Papers of 2021–2022 use it as the reason to keep released droplets small: smaller colloids "can potentially" improve absorption by faster replenishment, and surfactants that coarsen droplets "would be a poor choice" que2021 C37; correasoto2022a C1, C43.

Findings

Amorphous solubility and LLPS: F8, F16, F23. Bioperformance: F5, F8, F19, F22, F23. Mesoporous silica: F8, F15. Supersaturation from ASD dissolution: F7, F9, F21, F26. Release mechanism and LoC: F4, F13, F16.

Related concepts

depends on the drug-rich phase; inferred from membrane flux; related to thermodynamic activity. Needs drug-rich nanodroplets; contrasts with micellar solubilization. Absent where drug adsorption onto silica keeps the solution below the amorphous solubility; related to free drug concentration; the droplets form under congruent release.

Formulas

Receiver concentration-time profile with flow washout, membrane flux in terms of solute activity.

How it is measured or obtained

Not measured in the Amorphous solubility papers of 2013–2016; later papers use donors with and without nanodroplets and a membrane [indulkar2016 R7]. In the Bioperformance papers: a flow-through cell with a sink receiver, taking the length of the steady receiver period against the excess over the onset [indulkar2016 R5, R6] and a comparison with coarse amorphous particles [indulkar2016 R7]; a hollow-fibre receiver above the amorphous-solubility level and a fluorescence ratio falling to the amorphous-solubility level [hate2018 R13, R16]; hollow-fibre receiver Cmax against donor concentration above the amorphous solubility [ueda2020a R10, C26]; and PAMPA mass flow against donor concentration with a sink receiver, with an interface concentration estimated from it [hate2022 R19, C61]. In the Mesoporous silica papers: dissolution of ritonavir–SBA-15 at 200–1000% of the amorphous solubility with 1 µm filtration to count nanodroplets, against membrane flux [dening2018 P10, R8]; side-by-side comparison of atazanavir–SBA-15 with an HPMC dispersion of the same loading at 200 µg/mL in an absorptive apparatus [hate2020a P12]. Not measured in the ASD dissolution papers; the danazol work shows only that the free drug plateau is the same for all dispersions with a drug-rich phase jackson2015 R9. In the release-mechanism papers: not measured in these papers; colloid size by DLS que2019 R12.

Values in the library

None in the Amorphous solubility papers of 2013–2016; the Bioperformance, Mesoporous silica and ASD dissolution papers give the following.

materialvalue or classconditionspaper ids
clotrimazole 10 / 15 / 20 µg/mLsteady period 1 / 5 / at least 13 h16 h flow-through[indulkar2016 R6, X5]
clotrimazole + 7.5 mg/mL 150–250 µm particlesno reservoir (0.63 to 0.42 µg/mL)5 h[indulkar2016 R7]
atazanavir 90:10 ASDsreceiver above AS level 120 min; 4 h: about 200 minhollow fibre[hate2018 R13, R21]
posaconazole ASDs (FaSSGF)longer supersaturation at higher dose, "most likely" reservoirtwo doseselkhabaz2019a C48
ritonavir on SBA-15no reservoir at the amorphous solubility without excess drug[dening2018 C44]
ritonavir–SBA-15, 400 and 1000% doseabout 24 µg/mL, about 85% of the amorphous solubility; no drug-rich phase by dissolutionpH 6.8[dening2018 R22, C32]
10% atazanavir–SBA-15 against 10% HPMC ASDdonor about 48–57 against up to about 207 µg/mL with LLPS; receiver about 4.3–5.2 against 10.2–11.6 µg/mL200 µg/mL, absorptive[hate2020a R24, R25]
atazanavir, clozapine, two HPMCAS gradesCmax keeps rising above the amorphous solubility with approximately parallel slopeshollow fibre, 37 °C[ueda2020a R10, C26, C27]
atazanavir, PAMPA with 2% SDS receivermass flow 5.0 to 8.8 µg/min between 80 and 1000 µg/mL; estimated interface concentration near a plateau at 400 µg/mLlipid-impregnated hydrophobic PVDF[hate2022 R19, C61]
enzalutamide in ratsaggregate-forming ASD about 30% more AUC than two ASDs that only reached the ceiling (no statistical test)10 mL/kg[wilson2018 R17, C46, X6]
danazol dispersions with LLPSsame maximum flux, read as the maximum transport rate25 °Cjackson2015 C39, C32
indomethacin EPO–HPMC 3:5:2 dispersionapparent ≈93.5 → ≈43 µg/mL within ≈2 min of the shift; 39.1 of 40 µg/mL at 3 hpH 2.2 → 5, 37 °Cxie2017 R10, R20
posaconazole–HPMCAS 10% dispersion, two dosesthe same peak near 20 µg/mL; desupersaturation about an hour earlier at one-fifth of the dose, with fewer dropletsFaSSGF → FaSSIF, 37 °Celkhabaz2019a R12, R6, R14
delamanid salt dispersions during releasestable drug-rich nanodroplets, smaller with HPMCP than with HPMCASPBS pH 6.5, 37 °Cduong2022a R25
ledipasvir–PVPVA 5%; with poloxamer 407; 7.5% with SDS≈225–257; ≈96–130; ≈60–63 nmDLS, 10–60 minque2019 R12
TIPP, Me-TIPP; PHPH, Me-PHPHcolloids 179–193; 348–364 nmDLS, 30 minque2021 R22
clopidogrel dropletsstable with 4–50 µg/mL SDS, TPGS or Tween 80 for 4 hDLScorreasoto2022a R6
Pitfalls and disagreements

The claim that a colloidal drug-rich phase is favourable for absorption rests on literature and argument ("likely") indulkar2015 C55, X15. A plateau of flux shows constant activity but not resupply trasi2015a C14. The Amorphous solubility papers of 2013–2016 treat the effect as untested, whereas the flow-through experiments of indulkar2016 follow resupply by the length of the steady receiver period [indulkar2016 R5, R6]; so it is untested only in the former. In the Bioperformance papers depletion times were back-calculated in a way that does not match a mass balance [indulkar2016 X3]; droplet dissolution speed was estimated, not measured [indulkar2016 R18]; with mesoporous silica the effect "may not occur" [hate2020a C54]. The interface concentration of the PAMPA study is derived from mass flow anchored at 75 µg/mL, so the 1000 µg/mL point equals 75 by construction and the plotted values still rise from about 64 at 400 to 75 at 1000; no interface concentration, layer thickness or droplet dissolution rate was measured, so the mechanism is an interpretation (F22) [hate2022 X7, X8]. The rat difference rests on one aggregate-forming ASD that also dissolved fastest (F23) [wilson2018 X14]. Mesoporous silica: at the tenfold ritonavir dose, flux equalled that of amorphous ritonavir while dissolution through a filter that passes the droplets gave about 85% of the amorphous solubility, so whether the LLPS concentration was reached is unresolved [dening2018 X14, C33]. The method used to look for nanodroplets in the acid-first atazanavir run is not described and its data are not shown [hate2020a C54, R23]. In the ASD dissolution papers, for ritonavir the droplets "appear" to promote crystallization, the opposite of a stabilizing role ilevbare2013d C41. Danazol transport was measured across a dialysis-type membrane only, without absorption data jackson2015 X12. The posaconazole reservoir was inferred from the dose effect; neither the undissolved amorphous drug nor the droplet mass was measured over time elkhabaz2019a X8. The three colloid-forming formulations differ in loading and release rate, so the size difference cannot be assigned to the surfactant alone que2019 X11. No flux or absorption was measured in these papers que2019 C54; que2021 C37.

← Concepts and formulas

concept · as used in Dissolution

Nernst-Brunner equation

Evidence table: Nernst-Brunner equation. Content from the release-mechanism chapter (2019–2022).

The diffusion-layer form of the dissolution rate, dC/dt = (DA/Vh)(C_s - C), with diffusion coefficient D, surface area A, medium volume V, diffusion-layer thickness h and the solubility C_s of the solid form at the dissolving surface indulkar2019a E2, C22. For an amorphous drug-rich surface C_s is the amorphous solubility, so the rate approaches zero as the bulk concentration approaches it indulkar2019a C22. The ledipasvir study prints the same relation as the Noyes–Whitney equation with a Nernst–Brunner diffusion layer, dM/dt = (DA/h)(C_s - C), and concludes that dissolving an amorphous drug cannot raise the free concentration above its amorphous solubility que2019 E1, C2. Printed again in the 2022 ritonavir surfactant study for drug-controlled release at high loading, with C_s the amorphous solubility; release halts when the bulk concentration reaches it indulkar2022 E2, C21.

Findings

Release mechanism and LoC: F1, F3.

Related concepts

a form of the Noyes-Whitney equation; uses the diffusion boundary layer; separates drug-controlled release from polymer-controlled release.

Formulas

Noyes-Whitney equation, saturated-medium condition.

How it is measured or obtained

Used as an argument, not fitted: release from a drug-rich surface into medium presaturated at the amorphous solubility should be zero indulkar2019a C42.

Values in the library
materialvalue or classconditionspaper ids
ritonavir–PVPVA 50%no release into ritonavir-saturated medium, "in agreement with" the equationpH 6.8, 37 °Cindulkar2019a R12, C42
ritonavir–PVPVA 10%unchanged release into saturated medium, read as polymer controlsameindulkar2019a R12, C43
Pitfalls and disagreements

D and h were not given and no rate was computed indulkar2019a E2; the equation does not apply to dispersions whose release exceeds the amorphous solubility que2019 E1.

← Concepts and formulas

concept · as used in Dissolution

non-sink dissolution

Dissolution at a dose that would exceed the crystalline solubility if it all dissolved, so that supersaturation can build up and the competing kinetics of dissolution, nucleation and crystal growth can be seen; non-sink testing is called essential for supersaturating systems and more sensitive to crystals than most solid-state methods moseson2021 C3. In the ASD process papers it is a statement about the dose against the solubility of each solid form, not one apparatus: ritonavir and lopinavir granules at pH 6.8 were "highly non-sink" against crystalline solubilities of 1.8 and 2.9 µg/mL trasi2019 C10, M1, M2, and a bicalutamide dose of 3 µg/mL, the lowest that could be weighed and below the form 1 solubility, still "does not meet the traditional definition of sink conditions" moseson2021 C24. Further non-sink designs in the later papers: bicalutamide–PVPVA powder at a dose giving at most 30 µg/mL, chosen so that nucleation from solution does not interfere [moseson2022b P10, C7]; posaconazole coated powders at a dose equal to the amorphous solubility (8 µg/mL) [moseson2023 P13]; posaconazole after a gastric-to-intestinal pH shift at about 10 times the amorphous solubility (about 200 µg/mL) shah2024 P11; ritonavir powders and tablets at up to 25 µg/mL benson2025 P11; and 10 mg ezetimibe in 50 mL [duong2022c P15]. New aspect (Bioperformance): the dose is larger than the medium can dissolve at the (crystalline or amorphous) solubility, so that supersaturation and its loss can be seen [elkhabaz2017 P7; purohit2018 C30; alhalaweh2016 P10]. Absorptive tests combine non-sink dissolution with a membrane at three volumes, 5 mg of tacrolimus in 240, 100 and 40 mL hate2019 R7, C39. New aspect (Supersaturation from ASD dissolution): in the ASD dissolution papers of 2008–2015 the dose is set against both reference solubilities: non-sink with respect to the crystal so that supersaturation can show, and, in the danazol work, also above the amorphous solubility so that a drug-rich phase can form; danazol films were dosed at 20–30 µg/mL against 8 µg/mL amorphous and about 1 µg/mL crystalline solubility jackson2015 C10, P1. Only part of the dose may dissolve: the highest felodipine value, 14.1 µg/mL, was about 28% of a 50 µg/mL nominal dose konno2008a X15. The papers of 2015–2018 add two dose designs: a dose equal to the amorphous solubility (celecoxib, 8.8 mg in 400 mL, 22 µg/mL), at which a dispersion that stays amorphous should release completely while any drug crystallized in the matrix cannot dissolve xie2015 C17; xie2016a C8, and the whole contents of a marketed capsule in 40 mL, the baseline gastric volume (tacrolimus, 125 µg/mL nominal against an amorphous solubility of about 50 µg/mL) trasi2016 P11, C29.

Findings

ASD process: F14, F21, F23, F26, F27, F28, F29, F38, F39, F40, F41, F46, F47, F48. Bioperformance: F8, F10, F14, F16, F17, F25, F28, F30, F31. Supersaturation from ASD dissolution: F1, F4, F6, F7, F8, F10, F16, F20, F21, F22, F24, F25, F26.

Related concepts

reads desupersaturation; detects residual crystallinity and matrix crystallization; uses the amorphous solubility advantage; also the setting for the release of coated particles (see atomic layer coating) and for the effect of wettability. Contrasts with sink conditions; related to pH-shift dissolution and absorptive sink; measured by free drug concentration; related to supersaturation and amorphous solubility.

Formulas

supersaturation ratio. Sink index, Noyes-Whitney equation.

How it is measured or obtained

IDM: 200 mL of 50 mM pH 4.5 acetate buffer at 37 °C stirred at 300 rpm, a UV dip probe with a scattering-corrected calibration (absorbance at 317 nm minus 450 nm), n = 3, 12 h, maximum 50 µg/mL, S = 6 moseson2020a P9. BCL: 3, 30, 60 and 150 µg/mL for 4 h at 37 °C, triplicate moseson2021 P13. Ritonavir granules: 250 mL, 150 rpm, 0.45 µm PTFE filtrate assayed by HPLC trasi2019 P8, P15. Two-stage pH-shift tests: 60 min in 40 mL fasted-state simulated gastric fluid (pH 1.6), then double-strength intestinal medium added to pH 6.5, samples centrifuged and assayed by HPLC (n = 3), with SHG, two-photon UV fluorescence and focused beam reflectance giving the solid shah2024 P11, P12, P13, P14, P15; posaconazole–HPMCAS powders held 30 min to 4 h at pH 1.6 or 4.0 and then moved to pH 6.5 [moseson2023 P13]. In the Bioperformance papers powder or capsule contents are dissolved in a small volume with in situ UV or sampled HPLC [elkhabaz2017 P7; purohit2018 P8; hate2018 P8]. In the ASD dissolution papers: paddle dissolution of powder with UV sampling through a 70-µm filter konno2008a P3; small-volume vessels with fibre-optic UV probes read every minute alonzo2010 P2; alonzo2011 P2; film dissolution with pyrene aliquots jackson2015 P2; filtered sampling for clear PVP solutions and ultracentrifugation for turbid HPMCAS ones trasi2015b P5, P9. Two-stage tests of indomethacin dispersions, 1 h in pH 2.2 buffer and then pH 5 or 6.8 by adding phosphate xie2017 P7, P8; suspensions of enteric dispersions in acid as non-sink leaching tests li2016b P4; films cast in vials and stirred 48 h at pH 3 li2018 P4, P5.

Values in the library
materialvalue or classconditionspaper ids
IDM–PVPVA extrudatesC720 about 43.1 → 28.8 µg/mL with 0 → 25% crystalline drug50 µg/mL total dose, pH 4.5, 12 hmoseson2020a P9, R6
BCL–PVPVA 30:70fraction dissolved at 4 h about 0.82 → 0.23 as the dose rises 3 → 150 µg/mL (crystal-free)pH 6.8, 37 °Cmoseson2021 P13, R17
RTV and LPV granulesRTV about 4 µg/mL in the co-granule against about 30 alone250 mL, pH 6.8, 0.45 µm filtratetrasi2019 P8, R4
tacrolimus capsules (outside)100 mL gives 50 µg/mL at complete dissolution, equal to the amorphous solubilitypH 4.5, 37 °C, 300 rpmtrasi2017 R3, C12
tacrolimus generic capsules (outside)the more non-sink tests (100 and 40 mL) discriminate crystallinity better than larger volumesUSP and non-pharmacopeial mediapurohit2018 C57
BCL–PVPVA 5 / 10 / 20 / 30 / 50% DL powdersend level about 91 / 96 / 88 / 86 / 73% of the dosedose of at most 30 µg/mL, pH 6.8, 4 h[moseson2022b R6]
BCL–PVPVA 30% DL, cryomilled 2 and 5 minabout 50 and 49% of the dose (about 15 µg/mL, the form 2 solubility)same[moseson2022b R4, M1]
PCZ–HPMCAS 10% DL, extruded at 175 °C (no crystals) against 125 °C (0.3% crystals)peak about 172.5 against 178 µg/mL; about 125 against 14.5 µg/mL at 300 minpH shift at 60 min, dose about 200 µg/mLshah2024 R12, R14
PCZ–HPMCAS 25% DL coated 11–39 nm, pH 6.5about 90% of the dose in 10–20 mindose 8 µg/mL[moseson2023 R9]
ezetimibe–HPMCAS 50% DL, uncoated / thin / thickpeak about 14.0 / 12.5 / 10.1 µg/mL fresh; at 12 months about 5.6 against 12.4 and 11.1 µg/mL10 mg in 50 mL, pH 6.5[duong2022c R13, R23]
ezetimibe ASDs7.5 mg in 15 mL, about 500 µg/mLbuffer, FeSSIF, Ensure Plus[elkhabaz2017 P7]
ritonavir, atazanavir PVP ASDs150 mg in 15 mL, 120 minpH 6.8[alhalaweh2016 P10]
atazanavir ASDs200 µg/mL in 50 mLclosed vessel[hate2018 P8]
tacrolimus capsules5 mg in 900 / 450 / 100 / 40 mLmedium Ipurohit2018 P7, P8
tacrolimus (Accord)maximum 45 µg/mL within 40 min, about 25 µg/mL at 2 hone capsule in 100 mLtrasi2017 R3, C12
tacrolimus 5 mg in 240 / 100 / 40 mLmaximum donor concentration about 21 / 50 / 125 µg/mL; sink index against the amorphous solubility 2.4 / 1 / 0.4absorptive hollow-fibre testhate2019 R7
tacrolimus capsule contents5 mg in 100 mL, pH 4.5, 50 µg/mL HPC, 300 rpmUSP-type test 1 mediumpurohit2019 P5, E3, C35
enzalutamide ASDs100 µg/mL total in 12.5 mL, pH 6.5, 300 rpmclosed vessel[wilson2018 R6]
felodipine dispersions, 10–75% PVP, HPMC or HPMCAS30 mg in 600 mL (50 µg/mL nominal); maxima 0.8–14.1 µg/mLpH 6.8, 37 °C, 50 rpmkonno2008a P3, R10, X15
neat amorphous felodipine100, 500 and 1,000 µg/mL; plateau ≈0.9–1.1 µg/mL, like the crystalpH 6.8, 37 °Calonzo2010 P2, R1
neat amorphous indomethacin300 µg/mL; peak ≈14.9 (25 °C) and ≈11.2 µg/mL (37 °C)pH 2alonzo2010 P3, R7
HPMC–felodipine 90:10 and 50:5030 and 150 µg/mL nominal; UV ≈27 and ≈8.9 µg/mL18 mL, 37 °Calonzo2011 R1
danazol films, three polymers, three loadings20–30 µg/mL nominal; free drug 5.4–9.1 µg/mLpH 6.8, 25 °Cjackson2015 P1, R9
ritonavir and lopinavir 20% dispersions20 mg in 40 mLpH 6.8, 25 °Ctrasi2015b P5
celecoxib dispersions with PVP, HPMCAS, HPMC, PAA, 10–60% drug22 µg/mL nominal (= amorphous solubility) in 400 mLpH 6.8, 37 °C, 16 hxie2015 P5; xie2016a P5
six marketed tacrolimus capsules5 mg in 40 mL (125 µg/mL nominal); plateau ≈46–50 µg/mLpH 4.5, 37 °Ctrasi2016 P11, R10
indomethacin dispersions and crystals4 mg in 50 mL (80 µg/mL), then 100 mL (40 µg/mL)pH 2.2 → 5xie2017 P7
lopinavir films, 15–85% drug2 mg solids in 10 mL, 48 hpH 3, 25 °Cli2018 P4, P5
paclitaxel–HPMCAS 49/51 dispersiondose set to reach the amorphous solubility (31.6 µg/mL) in 15 mLpH 6.8, 37 °C, 16 hque2018 P8, R1
posaconazole–HPMCAS dispersions and Noxafil powder400 µg/mL in the gastric stage, 200 µg/mL after transfer, ten times the amorphous solubilityFaSSGF pH 1.6 → FaSSIF pH 6.5, 37 °Celkhabaz2019a P6
delamanid dispersions and tablets100 µg/mL at full release, about 100 times the amorphous solubility at pH 6.5PBS pH 6.5 or pH 1.6 → 6.5, 37 °Cduong2022a P16
praziquantel dispersions667 µg/mL and 1.5 mg/mL against an amorphous solubility of 1.1–1.4 mg/mLPBS pH 6.5, 37 °Cpolyzois2024 P8, R2
Pitfalls and disagreements

Filtering through 0.45 µm removes colloids above that size, and the authors treat the filtrate as molecularly dissolved drug even though material that formed at pH 6.8 passed larger-pore filters trasi2019 C11, X13. The dose per fluid volume decides how much supersaturation seeds can consume: seeds are expected to be a greater risk in a small fluid volume in vivo, and the apparent potency of the seeds rose with dose in the bicalutamide tests moseson2020a C56; moseson2021 C76; results "should be put in perspective of the minimum and maximum fluid volumes expected in vivo" hate2019 C39. The 12 h window is longer than gastrointestinal transit but lets dissolution and growth both be seen moseson2020a C32. At 30 µg/mL bicalutamide with PVPVA does not nucleate from solution, so a fall at that dose is read as the solid route [moseson2022b C7, R22]. In the posaconazole pH-shift test "desupersaturation" means a fall below the LLPS concentration (about 19 µg/mL), not a return to the crystalline solubility of 1.2 µg/mL shah2024 R11, X15. For the coated powders the replicate numbers and the meaning of the error bars are not printed [moseson2023 X17; benson2025 X20]. In the Bioperformance papers a closed vessel overstates supersaturation over time (F14), and most absorption is not modelled in such tests. The volume decides the result: the same 20% crystalline capsule passed the virtual check at 100 mL and failed at 40 mL (F28) hate2019 R13, C41, and closed dissolution did not rank the rat exposures (F25) [wilson2018 C57]. In the ASD dissolution papers, above the amorphous solubility UV readings include particles, so the apparent maximum of a non-sink test overstates dissolved drug alonzo2011 C27; jackson2015 C12. Results compare only at similar dose-to-volume ratios konno2008a X15. The two drugs of the 2010 study were tested at different pH, volume, stirring and solid amounts alonzo2010 X9. With the dose at the amorphous solubility a test asks whether a dispersion reaches the ceiling, not whether it can stay above it xie2016a X11. A shift to pH 6.8 let three indomethacin dispersions look alike that a shift to pH 5 separated xie2017 C66. In the tacrolimus test the 100 mL control called sink is nominally at the amorphous solubility trasi2016 X5. Where the dose equals the amorphous solubility, complete release and the ceiling cannot be told apart que2018 P8; xie2016a X11; where it is ten to a hundred times higher, the test asks instead how long the drug stays at the ceiling elkhabaz2019a P6; duong2022a P16.

← Concepts and formulas

concept · as used in Dissolution

nucleation and crystal growth

The two steps of crystallization, the formation of new crystals and the growth of existing ones; they have different temperature windows and can respond differently to the same additive, and overall crystallization of a powder is nucleation followed by growth [trasi2012a C35, C53; kestur2013b C35, C47]. The term is also used for a route of amorphous–amorphous phase separation, in which discrete domains of the new phase nucleate and grow, as opposed to spinodal decomposition [saboo2017 C40; yang2022b C50, C55].

Findings

F17, F21, F26, F31, F32, F33.

Related concepts

part of solid-state crystallization of amorphous drugs; consists of nucleation and crystal growth rate; located by nucleation temperature zone.

Formulas

classical nucleation theory, linear crystal growth rate from size-time slope.

How it is measured or obtained

Separated by growing seeded or pre-formed crystals on a hot stage and by locating nucleation zones and counting nuclei in cooling–reheating cycles [trasi2012a P2, P6, P7; trasi2012b P2, P6, P7]; or inferred by comparing overall powder crystallization with linear growth rates [kestur2013b C47].

Values in the library
materialvalue or classconditionspaper ids
acetaminophennucleation zone 50–60 °C, where growth is ≈0.04–0.23 µm/s against ≈45 µm/s at 100 °CDSC and hot stage[trasi2012a R12.a, R8.a, C39]
acetaminophen with PAA or HPMCASPAA slows growth most but gives most nuclei; HPMCAS the reverse10% w/w[trasi2012a C46]
flutamide with PVP or nilutamidePVP slows growth about tenfold without a nucleation effect; nilutamide nearly stops nucleation10 mol%[trasi2012b C7, R11.e, R12]
felodipine powders with 3% PVPearly crystallization 60–77-fold slower; surface and bulk growth ≈2- and ≈7-fold30 °C[kestur2013b R15, R12, C34]
miconazole–PVPVA films after humid casting or storagediscrete drug-rich domains in a polymer-rich matrix, read as separation by nucleation and growth ("may occur")confocal, AFM[saboo2017 C40]
ritonavir–PVPVA films with SDS or Tween 80 vs binary and Spansnucleation and growth vs spinodal decomposition, read from the first morphologyconfocal[yang2022b C55]
tacrolimus genericfall in concentration after 40–50 min read as growth on seeds present before storage ("some evidence")dissolution, 100 mLtrasi2017 C44
Pitfalls and disagreements

Nucleation was counted per thermal cycle or inferred from DSC peak temperatures and rate ratios, never measured as a rate at storage temperature [trasi2012a X8; trasi2012b X4; kestur2013b X7].

← Concepts and formulas

concept · as used in Dissolution

nucleation induction time

The time from creating a supersaturation until crystals are first detected, t_{ind} = t_n + t_g: the time to form stable nuclei plus the time for them to grow to a detectable size; if growth is quick, t_{ind} \propto J^{-1} and a longer time means a slower nucleation rate ilevbare2013c E2, E3, C14. It depends on the detection method, since crystals are seen earlier by SHG than by a probe ratio or light scattering jackson2014 R25, R17.

Findings

F3, F4, F5, F6, F13, F14, F15, F25, F27, F28, F29, F32, F34, F35, F37, F38, F39, F40, F41, F42, F43, F44.

Related concepts

part of nucleation; gives nucleation rate; modified by nucleation inhibition; measured on supersaturation.

Formulas

induction time decomposition, relative nucleation rate from seeded and unseeded induction times, classical nucleation theory.

How it is measured or obtained

A methanol stock of drug is pumped or injected into stirred buffer with or without predissolved polymer and the signal is followed: extinction at a wavelength where the drug does not absorb (280 or 350 nm) or the fall in UV absorbance, taking the crossing of regression lines through the flat and rising (or falling) parts as the time; pyrene fluorescence and SHG as second read-outs; triplicate alonzo2012 P5; ilevbare2013c P9, P10; jackson2014 P8. The stated supersaturation uses a methanol-free solubility; the methanol fraction is about 0.5% v/v ilevbare2013c X16.

Values in the library
materialvalue or classconditionspaper ids
celecoxib; efavirenz; ritonavir, no polymerabout 2.4; 5.1; 120 minat the calculated amorphous solubility, 37 °Cilevbare2013c R8, R9.a
ritonavir, CAB Adp 0.81; efavirenz, CAB Adp 0.81; celecoxib, HPMCabout 244; 28.0; 12.6 min5 µg/mL polymerilevbare2013c R9
celecoxib at 11 µg/mL, none against HPMC27.5 ± 0.7 against 855.5 ± 6.0 minS 7.3ilevbare2013c R15
felodipine, none against 1 µg/mL HPMC15.3 against 136.5 minS 10, 25 °Calonzo2012 R16
danazol, none; PVP; HPMC; HPMC-AS6–10; 88–162; 111–285; 250–516 min10–20 µg/mL, 25 °Cjackson2014 R17
celecoxib 22 µg/mL, 5 µg/mL HPMCAS (ASD dissolution chapter)held for 16 h; J_0/J_p about 4,00037 °Cxie2016a R3, R13
paclitaxel 30.7 µg/mL (S 88) (ASD dissolution chapter)within 6 min; more than 16 h with 20 µg/mL HPMCAS37 °Cque2018 R3
indomethacin S 6 (ASD process chapter)about 40 min; more than 12 h with 5–50 µg/mL PVPVApH 4.5, 37 °Cmoseson2020a R3
11 drugs, 0.1% STC and SDS, matched C/Ceqbuffer 7–87 min; STC 15 to >1000; SDS shorter for 7 of 925 °C, telaprevir 37 °Cchen2015 R3
acetaminophen, S 1.595% of vials 26 min; first crystals 150–785 s20 °Ctrasi2015 R1, R10
celecoxib, nevirapine, flibanserin, 13 bile salts3 min to >16 h (celecoxib); 0–577 (nevirapine); 0–623 min (flibanserin)pH 6.5, 37 °Cli2016a R6
telaprevir, 80 and 150 µg/mL, 26 polymersHPMC >700 and 243; none 14–15 minpH 6.8, 37 °Cmosqueragiraldo2016 R4
telaprevir δ 11.5 and 28.8, six bile salts30 min and immediate in buffer; >960 min with 1.86 mMpH 6.5, 37 °Clu2017 R3, R4
danazol 15 µg/mL, PVP, HPMC, HPMC-AS 1–1000 µg/mLabout 5 min; 26–412 min25 °Cjackson2016 R17
atazanavir without additive, five protocolsabout 40, 92–102, 170, 200, 253 ± 65 minnear the amorphous solubility, 37 °Cmosqueragiraldo2018a R1; elkhabaz2021 R6; indulkar2018 R19; indulkar2019b R3; enright2020 R2
posaconazole without additive, three protocolsabout 5–8, 8.4, 29 ± 5 minpH 6.5, 37 °Celkhabaz2021 R7; duong2022b R10; shah2025 R3
enzalutamide without polymerabout 5–15 min, 30–120 µg/mLpH 6.5wilson2021 R1
Pitfalls and disagreements

The assumption t_n \gg t_g was not tested; strong inhibitors give gradual onsets whose fitted times depend on where the lines are drawn (rise above baseline at about 25 min against a fitted 31.5 min; about 180 against 260 min) ilevbare2013c C14, X14. Methods differ by up to about 40% for single conditions jackson2014 X5. The same polymer, drug and concentration gave 10–13 min in one laboratory and more than 8–16 h in another ilevbare2013c R9; xie2015 R1; xie2016a R3. The efavirenz run was at S about 2.3, not 15 ilevbare2013c X4. Replicate scatter is below 15% ilevbare2013c R17. Values above 960 or 720 min are lower bounds set by the run length lu2017 X16; chen2015 X7. The control induction time of one drug differs up to about sixfold between protocols, so effects compare only as ratios to a control in the same protocol mosqueragiraldo2018a R1.b; enright2020 R2. Several papers do not identify the scattering particles at the induction time indulkar2018 X14; enright2020 X15.

← Concepts and formulas

concept · as used in Dissolution

nucleation inhibition

The slowing of crystal nucleation from a supersaturated solution by an additive, measured as a longer nucleation induction time or a lower nucleation rate. Ilevbare and co-workers propose that a polymer inhibits nucleation by joining clusters of solute molecules and hindering their reorganization into an ordered nucleus, which needs a polymer with more affinity for the solute than for water or for itself ("we assume", "would be expected") ilevbare2013c C4, C5, C35. How additives slow nucleation is more speculative than how they slow growth, because the molecular events cannot be observed ilevbare2013c C9. New aspect (Supersaturation from ASD dissolution): for celecoxib released from dispersions, the authors take the polymer effect on nucleation as "of paramount importance" to the desupersaturation profile, because growth needs nuclei xie2015 C40. Extended induction times with polymers indicate a decreased nucleation rate, PVP-K12 being the least effective and HPMCAS or HPMC showing no discernible nucleation or growth for 8 h xie2015 C42, R1; the greater effect of the cellulose derivatives "may relate" to a greater ability to interact with a dense liquid cluster of celecoxib than the more hydrophilic PVP, which also interacts with the solvent xie2015 C46. With 5 µg/mL HPMCAS the relative effect on nucleation (~4000) was far larger than on growth (70) ("it can be surmised") xie2016a C40, R13.

Findings

Crystallization from solution: F6, F13, F14, F15, F20, F27, F28, F31, F32, F33, F36, F40. Supersaturation from ASD dissolution: F4, F5, F20, F29.

Related concepts

contrasts with crystal growth inhibition; part of crystallization inhibition by polymers; measured by nucleation induction time and nucleation rate; related to polymer hydrophobicity; related to interfacial tension.

Formulas

relative nucleation rate from seeded and unseeded induction times, induction time decomposition, classical nucleation theory.

How it is measured or obtained

Unseeded induction times with and without polymer under identical conditions (see nucleation induction time), optionally combined with seeded growth rates into the nucleation-rate ratio J/J_0 alonzo2012 P10, E10. In the celecoxib dispersion papers: solvent shift to 22 µg/mL celecoxib in pH 6.8 phosphate buffer at 37 °C with 5 µg/mL dissolved polymer, the onset read from a rise in 350 nm extinction with a fall in 249 nm absorbance xie2015 P4, R1.

Values in the library
materialvalue or classconditionspaper ids
felodipine, 1 µg/mL HPMCJ/J_0 7.05 × 10⁻⁴ ("more than a thousand fold"); induction 15.3 → 136.5 minS 10, 25 °Calonzo2012 R16, R17, C38
ritonavir; efavirenz; celecoxib, best polymer120 → 244; 5.1 → 28.0; 2.4 → 12.6 min5 µg/mLilevbare2013c R9, R12
celecoxib at S 7.3, HPMC27.5 → 855.5 min (31-fold)5 µg/mLilevbare2013c R15
celecoxib, 5 µg/mL HPMCAS (ASD dissolution chapter)J_0/J_p about 4,00022 µg/mL drugxie2016a R13
paclitaxel, HPMCAS (ASD dissolution chapter)"highly effective" at S 8820 µg/mL polymerque2018 R3, C13
indomethacin, PVPVA 5–50 µg/mL (ASD process chapter)"highly effective" at S 6; stays supersaturated more than 12 hpH 4.5moseson2020a R3, C11
11 drugs, 0.1% STCinduction time lengthened for all, eight by more than 10-fold25 °Cchen2015 R3, X6
telaprevir, 1.86 mM STC, SGCrelative nucleation rate J/J₀ 2.5 × 10⁻³ and 2.9 × 10⁻⁶ (recomputed 2.58 × 10⁻³ and 3.06 × 10⁻⁶)δ 11.5lu2017 R10, X1
acetaminophen, S 1.5J lowered 18-fold (HPMCAS) and 36-fold (HPMC); raised 2.6-fold by PAA10 µg/mLtrasi2015 R3
telaprevir, 1.86 mM binary and ternary bile salt mixtures>960 min against about 30 in buffer; 3.72–5.58 mM mixtures about 255 minδ 11.5, 37 °Clu2018 R3, R4
nine drugs, 5 µg/mL A5aatazanavir 40 → >300, telaprevir 15 → 91 minpH 6.8, 37 °Cmosqueragiraldo2018a R1
celecoxib 22 µg/mL: no polymer; 5 µg/mL PVP-K12; PVP-K29/32; HPMCAS or HPMCwithin 5 min; ≈1 h; ≈2 h; more than 8 hpH 6.8, 37 °Cxie2015 R1
delamanid at 0.76 µg/mL with 300 µg/mL polymermore than 1000 min with PVPVA, HPMCP and HPMCAS; about 50 min with HPMC; 10.2 min with Eudragit L100 against 10.7 min without polymerPBS pH 6.5, 37 °Cduong2022a R4, R2
racemic praziquantel at 1.1 mg/mL with 300 µg/mL polymer10.9 (PVPVA), 14.3 (HPC), 15.7 (PVA), 24.5 (HPMC 603) and 50.5 min (HPMCAS-LF); HPMCAS-MF and HPMC E5 LV beyond the 83-min runPBS pH 6.5, 37 °Cpolyzois2024 R3
R-praziquantel at 1.4 mg/mL37 min (HPMCAS-MF) and 15.5 min (HPMC E5 LV)PBS pH 6.5, 37 °Cpolyzois2024 R4
Pitfalls and disagreements

The mechanism (cluster association, polymer–solute affinity, self-association, chain rigidity) was not measured; the induction time includes growth to a detectable size ilevbare2013c C5, C39, C43, X14. The nucleation-rate ratio of felodipine rests on one pair of induction times entering to the fourth power alonzo2012 X7. Rankings of polymers differ from rankings of growth inhibition (F6) ilevbare2013c C40. In the celecoxib dispersion papers the induction time includes growth to a detectable size xie2015 E1; the HPMCAS ratio of ~4000 takes the 960-min end of the run as the induction time, so it underestimates the effect xie2016a R13, C40; celecoxib clusters and their interaction with polymers were not measured xie2015 C46. A ranking made with a racemate did not hold for its enantiomer polyzois2024 R4, C8, and the praziquantel run length capped the two best polymers at 83 min so they cannot be ranked against each other polyzois2024 R3.

← Concepts and formulas

concept · as used in Dissolution

nucleation rate

The number of stable crystal nuclei formed per unit volume and time, J. Classical nucleation theory gives J = A\exp(-\Delta G_{crit}/kT) with a barrier that falls steeply with supersaturation, \Delta G^{*} \propto 1/(\ln S)^{2}; where the induction time is dominated by nucleation, t_{ind} \propto J^{-1} ilevbare2013c E3, E4; hsieh2012 E7, E8. The nucleation-rate ratio with and without a polymer is estimated from seeded and unseeded induction times alonzo2012 E10. New aspect (Physical stability): in the solid-state papers of the library it is the slope of the volume density of birefringent sites against time in amorphous films, in m⁻³ s⁻¹ [konno2006 C12, R3; marsac2008a E4]; in solution papers it is derived from induction times or counts of particles or SHG signals per time alonzo2012 E10; elkhabaz2021 E5.

Findings

Crystallization from solution: F6, F14, F27, F32, F33, F34, F42. Physical stability: F1, F2, F9, F10, F11.

Related concepts

inverse of nucleation induction time; modified by nucleation inhibition; described by classical nucleation theory; measures nucleation; set by kinetic barrier to nucleation and thermodynamic driving force for crystallization; related to crystal growth rate.

Formulas

relative nucleation rate from seeded and unseeded induction times, classical nucleation theory, induction time decomposition, depth of field of a microscope objective, Arrhenius equation.

How it is measured or obtained

Not measured as an absolute rate in the papers of the crystallization-from-solution chapter. The ratio is J/J_0 = (t_s/t_{s,0})^{3}(t_{u,0}/t_u)^{4}, with the seeded induction-time ratio replaced by the growth-rate ratio R/R_0 at the same supersaturation and polymer level alonzo2012 P10, E9, E10. In the ASD dissolution chapter the same relation was applied to celecoxib xie2016a R13. In the solid-state papers: spin-coated films stored at a fixed RH and temperature; sites counted under polarized light in 12 areas per film, converted from area to volume with the depth of field of the objective (0.0144 mm at 10×), triplicate, film edges excluded [konno2006 P2, E1; marsac2006a P4; konno2008 P4]. Sites are counted once they reach about 1 µm [konno2008 C38]. In SHG images of griseofulvin the number density of crystal sites was followed over time with a 60 µm depth of field [wanapun2010 R17].

Values in the library
materialvalue or classconditionspaper ids
felodipine, 1 µg/mL HPMCJ/J_0 7.05 × 10⁻⁴ (text: more than thousand-fold; conclusions: factor of 1000)S 10, 25 °Calonzo2012 R17, C38, C46
celecoxib, 5 µg/mL HPMCASJ_0/J_p about 4,000 (unseeded time taken as 960 min)22 µg/mL drug, 37 °Cxie2016a R13
acetaminophen, S 1.5J 1465 (none), 3820 (PAA), 81.86 (HPMCAS), 40.68 (HPMC) # m⁻³ s⁻¹1.2 mL vials, 20 °Ctrasi2015 R3
telaprevir with STC, SGCJ/J₀ 2.5 × 10⁻³, 2.9 × 10⁻⁶δ 11.5lu2017 R10
atazanavir, posaconazole, six mediaSHG count rate about 0.1–1.6 and 0.05–48 counts/min37 °C, relative per fieldelkhabaz2021 R14, E5, X13
posaconazole, PBS and three mediaJ from induction times, fitted for A and γ37 °C, S above about 7–13duong2022b R15, X10
amorphous felodipine≈1.3 × 10⁵ m⁻³ s⁻¹; ≈2–3 × 10³ with 3% PVP, HPMCAS or HPMC0% RH, 22 °C[konno2006 R4]
amorphous nifedipine vs felodipine0.39 vs 0.17 × 10¹⁰ m⁻³ day⁻¹0% RH, 22 °C[marsac2006a R4.a]
nifedipine and felodipine with 7% PVP≈1.4 × 10³ and ≈2.7 × 10² m⁻³ s⁻¹0% RH[marsac2006a R16.b]
felodipine with 3% PVP vs HPMCAS≈8.6 × 10⁵ vs ≈1.3 × 10⁴ m⁻³ s⁻¹75% RH, 22 °C[konno2008 R3.b]
nifedipine vs felodipine with 25% PVP≈4.3 × 10⁵ vs ≈2.3 × 10³ m⁻³ s⁻¹75% RH[marsac2008a R1.f, R1.l]
felodipine (activation energy)145 kJ/mol below Tg; 201 with 3% PVPArrhenius, ≈25–75 °C[marsac2006a R3]
griseofulvin melt (SHG imaging)number density ≈45 → ≈600 mm⁻³ over ≈62–285 min125 °C, SHG[wanapun2010 R17]
Pitfalls and disagreements

The ratio rests on one pair of induction times without uncertainty and on a seeded ratio standing in for a seeded induction-time ratio; a 10% change in the polymer-case time changes J/J_0 about 1.5-fold alonzo2012 X7, C11. The printed inverse of 0.607 is 1.643 against 1.647, with J/J_0 7.05 or 7.06 × 10⁻⁴ alonzo2012 X6. The celecoxib value is a lower bound because no desupersaturation occurred within the experiment xie2016a R13. In the film papers absolute rates are per depth-of-field volume and comparable only within one counting method; in one paper Table II and two figures disagree about fourfold, and the felodipine-alone rate of that paper's Fig. 9 (≈3 × 10⁴) is about fourfold below the other papers' ≈1.3–1.4 × 10⁵ (synthesis) [marsac2006a X1; konno2006 R4.a]. The 2006 methods describe the area-to-volume conversion as multiplication where division is meant [konno2006 X6]. Site density rose roughly linearly, but early points can lie below the fitted line, so a short lag is not excluded [konno2006 X8].

← Concepts and formulas

concept · as used in Dissolution

nucleation temperature zone

The temperature range in which nuclei form at a useful rate; it usually lies below the temperature of fastest growth, and storing outside it helps prevent crystallization [trasi2014b C3]. Each polymorph may have its own zone [trasi2014b C38; lu2016 C42].

Findings

Crystallization tendency: F3, F4. Physical stability: F17.

Related concepts

part of nucleation and of nucleation and crystal growth; includes sub-Tg nucleation; contrasts with the growth window of crystal growth rate; related to glass-forming ability.

Formulas

critical cooling rate to avoid nucleation.

How it is measured or obtained

By cooling the melt to successively lower end points and reheating; the highest end point that gives crystallization on reheating bounds the zone [trasi2014b P1; trasi2012a R12]; by nuclei counts after holds at different temperatures [trasi2014b P7]. The zone limits depend on the cooling and heating rates and serve only to compare samples [trasi2012a C13].

Values in the library
materialvalue or classconditionspaper ids
nilutamidestrong zone near −30 °C; weaker rise from about 50 °C, about 30 °C above TgDSC; surface counts[trasi2014b R5, R9, C41]
acetaminophen50–60 °CDSC[trasi2012a C22]
flutamide10–40 °CDSC[trasi2012b R10]
acetaminophen with 10% w/w HPMC, HPMCAS, E100, PVPh, PVPVA, PVP, PAA10–60, 10–45, 40–60, 40–70, 30–60, 30–50, −10–30 °CDSC cool–reheat[trasi2012a R12]
acetaminophen with 15% w/w PVP, PAA, HPMCASno crystallization in the testsame[trasi2012a R12]
flutamide with 10 mol% PDMA, PVAc, PVPH, PIPA, PVP10–30, 20–40, 30–40, 20–30, 20–40 °Csame[trasi2012b R10]
vemurafenib αapproximately 170–270 °C (inferred)hot stage[lu2016 C43]
indomethacin γ; α (cited)maxima at about Tg and about 20 °C higherliterature[trasi2014b R32]
Pitfalls and disagreements

The method passes the zone on both cooling and reheating, so the two contributions are not separated [trasi2012a X9]; the polymorph of the counted nuclei was not identified for nilutamide [trasi2014b X6]. Storage inside the zone gives high nucleation; a polymer that lowers the zone (HPMCAS for acetaminophen) "could potentially" still give more nuclei at room temperature than another polymer [trasi2012a C47].

← Concepts and formulas

concept · as used in Dissolution

nucleation

Nucleation is the formation of crystal nuclei, the first of two dependent steps of crystallization, each with its own rate and temperature dependence [baird2013 C32; kestur2010a C27]. In classical nucleation theory the barrier to a critical nucleus grows with the cube of the interfacial free energy and falls with the square of the driving force [vaneerdenbrugh2010a E3]; the library adds molecular recognition as a further factor [trasi2012a C48; konno2006 C33]. This draft comes from the crystallization-tendency chapter (supercooled melts and glasses); nucleation from solution is covered by other chapters. New aspects (Miscibility and drug-polymer interactions): For indomethacin and PVP the proposal is that a critical γ nucleus is built of acid dimers, so that "the formation of a critical nucleus of indomethacin would require the breaking of the PVP-indomethacin hydrogen bond"; the same logic is expected to hold for α, which hydrogen-bonds in chains [taylor1997 C43, C44]. During solvent removal nucleation and growth can occur once the drug's solubility in the drying solution is exceeded, and a polymer may alter the supersaturation reached [vaneerdenbrugh2010b C29]. Pure nifedipine and felodipine nucleate much faster than dispersions with even small amounts of polymer, which is the main argument that the polymer acts through kinetics [marsac2006b R16, C42]. New aspect (Crystallization from solution): nucleation from supersaturated aqueous solution differs from nucleation in a supercooled melt in that the driving force is the supersaturation S and the read-out is the induction time at fixed S; it is "energetically more demanding" than growth, so at some supersaturations crystals grow while new nuclei do not form ilevbare2013c C10, E3. Polymers can slow it several-fold at the supersaturation of amorphous dissolution and by much more at lower supersaturation (F13, F14), and for felodipine far more than they slow growth (F6) alonzo2012 C46; ilevbare2013c R12, R15. In a two-phase solution the droplet interface is a candidate site (see heterogeneous nucleation) jackson2014 C45, C53. New aspect (Physical stability): the physical-stability papers treat nucleation as the initiating event that a dispersion must suppress, framed by classical nucleation theory with a thermodynamic barrier and a kinetic barrier, while noting that nucleation in films is "most likely heterogeneous" [marsac2006a C5; konno2006 C33]. New aspect (Supersaturation from ASD dissolution): three readings from dissolving dispersions: a fast initial drop of a highly supersaturated felodipine solution as rapid nucleation, faster and giving more particles at higher concentration konno2008a C24; immediate crystallization of drug released at very high local supersaturation from a 10% drug dispersion alonzo2011 C29; and nucleation inside drug-rich droplets, favoured by the high drug concentration and an expected low crystal–liquid interfacial tension ilevbare2013d C39, C40.

Findings

Crystallization tendency: F3, F4, F7, F15, F16, F18, F19, F21. Miscibility and drug-polymer interactions: F1, F9, F10, F15. Crystallization from solution: F3, F6, F13, F14, F20, F34, F36. Physical stability: F1, F2, F9, F10, F16, F17, F20, F29. Supersaturation from ASD dissolution: F3, F5, F13.

Related concepts

part of the process together with crystal growth rate (contrasts with); measured by nucleation temperature zone; modelled by classical nucleation theory; includes heterogeneous nucleation and sub-Tg nucleation; related to quenched-in nuclei and prenucleation clusters; depends on thermodynamic driving force for crystallization; related to crystallization inhibition and kinetic stabilization; includes secondary nucleation; inhibited by nucleation inhibition; quantified as nucleation rate; controlled by kinetic barrier to nucleation; see molecular recognition and nucleation and crystal growth; related to nucleation induction time and metastable zone.

Formulas

classical nucleation barrier, critical cooling rate to avoid nucleation, classical nucleation theory, induction time decomposition, relative nucleation rate from seeded and unseeded induction times, Arrhenius equation, depth of field of a microscope objective.

How it is measured or obtained

Directly, by the number of nuclei grown to visible size after a hold (two-step method) [trasi2014b P7] or by nucleation-site density over time in films [marsac2006a R1]; by locating a nucleation zone with DSC cooling to successive end points and reheating [trasi2014b P1; trasi2012a R12]; indirectly, from critical heating rates after slow and fast cooling [baird2013 C38] or from the absence of crystallization on reheating [trasi2014b C39]. In solution, induction times are used, which include a growth time chen2015 C5. In the felodipine, bifonazole and nimesulide growth studies nuclei are only formed and then grown: films are stored over P2O5 at 40 °C (or at ambient temperature) before the hot-stage growth runs, and nucleation with the polymers is not quantified [kestur2010a P3, X10; kestur2011 P2]. The spin-coating screen of vaneerdenbrugh2010b scores the crystalline area over 7 days, which mixes nucleation and growth [vaneerdenbrugh2010b P2, C29]. In the crystallization-from-solution papers by unseeded induction times (see nucleation induction time) and by the nucleation-rate ratio from seeded and unseeded runs alonzo2012 P5, P10; ilevbare2013c P9. In the physical-stability papers, by counting birefringent sites in films at fixed RH and temperature, and by the Arrhenius slope of the rate above and below Tg [konno2008 P4; marsac2006a P5]. A lag before detectable crystals in stored powders was read as delayed nucleation [rumondor2009b R17, C29]. In the ASD dissolution papers it is not measured directly but inferred from concentration curves, induction times, particle appearance and Raman lag times konno2008a X4; ilevbare2013d R16; raina2014b C32.

Values in the library
materialvalue or classconditionspaper ids
nilutamide glass≈12.6 nuclei per sample at −30 °C; ≈0.8–2.5 at −20 to 40 °C30-min hold, open surface, 1 min growth at 65 °C[trasi2014b R9]
acetaminophennucleation zone 50–60 °CDSC cool–reheat[trasi2012a C22]
acetaminophen with polymersHPMCAS reduces nuclei to about a third; PAA gives nearly three times more10% w/w[trasi2012a C23]
flutamidenucleation zone 10–40 °CDSC cool–reheat[trasi2012b R10]
nifedipine against felodipinefaster nucleation for nifedipinepure films, 22 °C, 0% RH[marsac2006a R1]
felodipine filmsrate rises with storage RH; drug alone fastest22 °C, with polymers[konno2008 C11]
indomethacin polymorphsδ fastest at 60 °C; α favoured at 80 °C; γ not readily (only from seeds); polymers retarded nucleationamorphous films, storage at 60 and 80 °C[tian2017 R1, R5, C7]
celecoxibsamples "quite hard to nucleate"hot stage[mosqueragiraldo2014 R15]
vemurafenib βnucleation the limiting step above 150 °C (qualitative)hot stage[lu2016 C46]
pure nifedipine, felodipine against dispersionsnucleation much faster for the pure drugscited from a companion study[marsac2006b R16]
indomethacin–PVPnucleus requires breaking the PVP–drug bond (proposed, untested)no crystallization data[taylor1997 C43, X8]
flufenamic acid–PSSA, chlorpropamide–PSSA, lidocaine–PVP filmsfully crystalline within 30 min of coatingspin coating[vaneerdenbrugh2010b R2.an, R2.s, R2.as]
celecoxib; efavirenz; ritonavirinduction time about 2.4; 5.1; 120 minat the calculated amorphous solubilityilevbare2013c R8
felodipine, HPMC 1 µg/mLJ/J_0 7.05 × 10⁻⁴S 10alonzo2012 R17
danazol6–10 min without polymer; 88–516 min with 10 µg/mL polymer25 °Cjackson2014 R17
nine drugs with carboxylated cellulose derivativescontact with the emerging nucleus "clearly a prerequisite" for disruption5 µg/mL, pH 6.8mosqueragiraldo2018a C44
amorphous felodipinerate ≈1.4 × 10⁵ → 2.9 × 10⁶ m⁻³ s⁻¹0 → 75% RH, 22 °C[konno2008 R1.a, R3.a]
nifedipine vs felodipinefaster at every PVP level and RH0–75% RH[marsac2008a R1, C7]
felodipine with 50% HPMCASnegligible crystals for 35–120 days at 52–93% RH, read as delayed nucleationPXRD of powders[rumondor2009b R17, C29]
flutamide with 10 mol% PVAc, PIPAgrowth rate at the DSC exotherm maximum 7.7 and 7.0 against 4.4 µm/s, read as fewer nucleiDSC and growth curve[trasi2012b R11.b, R11.d, R11.f, C18]
flutamide with 10 mol% nilutamideone nucleus in the imaged regioncooled to −30 °C, reheated[trasi2012b R12, C16]
felodipine with 3% PVP≈150-fold lower rate (cited)30 °C[kestur2013b R22, C35]
ritonavir 17 against 20 µg/mL (below and above LLPS)induction about 284 against 119.3 minpH 6.8, 37 °Cilevbare2013d R16, R12
felodipine methanol shift with HPMC, S about 60precipitation not completely suppressed25 °Calonzo2011 C30
nifedipine α in γ slurries with polymerlag lengthened at similar slopes, read as α nucleation inhibition25 °Craina2014b C32
Pitfalls and disagreements

Nucleation is stochastic and often heterogeneous, which scatters crystallization temperatures [baird2010 C19; baird2013 C18]. Nuclei counts are not rates unless area and time are controlled [trasi2014b X7]. Polymers can act oppositely on nucleation and growth: HPMCAS was the best nucleation inhibitor but the weakest growth inhibitor for acetaminophen [trasi2012a C46], and drug–additive hydrogen bonding correlated with growth inhibition but not with nucleation for flutamide [trasi2012b C45]. Classical nucleation theory does not capture molecular recognition or polymer effects [trasi2012a C49]. The role of the hydrogen bond in nucleation is argued, not tested [taylor1997 X8]. The growth-rate ranking of polymers says nothing about nucleation, which was not measured [kestur2010a X10; kestur2011 P3]. The film screen cannot separate crystallization during coating from crystallization during storage except through the day-0 score [vaneerdenbrugh2010b R2]. In solution, how additives slow nucleation is "more speculative" than how they slow growth, because the molecular events cannot be observed ilevbare2013c C9; the papers do not separate nucleation from early growth inside the induction time ilevbare2013c X14. The delayed-nucleation reading of the HPMCAS lag in stored felodipine powders assumes that growth below and above the detection limit follows the same factors [rumondor2009b C28]. Nucleation counts separated polymers at 33% RH that PXRD crystallinity could not separate within 490 days (synthesis) [konno2008 R2.b; rumondor2009b R19]. The flutamide nucleation verdicts rest on two Tmax values per sample and an unnamed test [trasi2012b X4]. Nuclei per cycle are not rates when the zones differ in width [trasi2012a X8]. The felodipine "nucleation then growth" reading rests on curves alone konno2008a X4; the ritonavir 17 µg/mL comparison has no n or SD and mixes droplets with a higher bulk supersaturation ilevbare2013d X18.

← Concepts and formulas

concept · as used in Dissolution

particle breakage

Mechanical break-up of drug particles under the stresses of mixing, for example in the dispersive or kneading elements of an extruder; the authors expect it to add defects and dissolution surface, and suggest that defect stress fields may be the sites where breakage starts [moseson2019 C45, C56]. Clusters of randomly oriented 5–10 nm domains in an extrudate were first read as a "mechanical origin" [moseson2018a R9, C14]. In the bicalutamide population balance model breakage is a size-dependent selection function (critical size 5 µm, two equal-volume daughters, Gaussian spread 12.5%) scaled by each lot's percentage of agglomerates, and the fit needs it: dissolution alone left 26–73% crystallinity at 20 min [moseson2022c E7, E11, E17, R12, R16]. Mechanical stress at the screw elements is held to break the same weak sites as fragmentation by dissolution [moseson2022c C45, C51].

Findings

F12, F36, F37.

Related concepts

contrasts with fragmentation-based dissolution (a dissolution-driven source of fragments).

Formulas

population balance equation, breakage selection function.

How it is measured or obtained

Not measured directly in the ASD process papers; inferred from TEM clusters of similar fragments and from the absence of mechanical input in still films [moseson2018a R11; moseson2019 R16].

Values in the library
materialvalue or classconditionspaper ids
IDM extrudateclusters of 5.8 ± 1.2 nm domains (n = 20)TEM[moseson2018a R11]
IDM crystals in still filmsfragmentation without mechanical input130 °C[moseson2019 R5, R16, C43]
BCL in PVPVA at Tc, population balance modelbreakage rate constant 0.355 ± 0.111 with breakage scaled by % agglomerates; dissolution only leaves 26–73% crystallinity at 20 minfour lots, 20 min[moseson2022c R16, R12]
Pitfalls and disagreements

The 2018 TEM paper noted that "other explanations are also possible" given the high mechanical input of HME [moseson2019 C5]. Breakage in the extruder was not observed, and the supporting images are quiescent PLM at 170 °C [moseson2022c X9, X18].

← Concepts and formulas

concept · as used in Dissolution

peptide-enhancer co-release

The release of an oral peptide and its permeation enhancer from one dosage form at the same rate, so that the two reach the epithelium together and at the same relative amounts as in the solid. Two names are used for it in the library: congruent or synchronous release, borrowed from amorphous dispersion work and judged by equal surface-normalized release rates of every component bapat2025b C3, C15, E1, and corelease or temporal synchronicity, judged by the times at which peptide and enhancer reach their maximum release from a tablet [fagan2025 C44, C46, R20]. The motive is cited rather than measured in both papers: a high local enhancer concentration is needed, the absorption window after the enhancer acts is short, and co-localization of peptide and enhancer at the absorption site is considered important and hard to achieve with a solid oral form, especially in the small intestine bapat2025b C8, C10. Co-release is a release property only; neither paper that measures it measured permeability, transport or absorption, so the benefit remains an expectation ("may improve co-localization at the epithelial membrane", "would likely result in incongruous presentation") [bapat2025b C6; fagan2025 C45]. Evidence table: peptide-enhancer co-release.

Findings

F4, F5, F6, F1.

Related concepts

the same criterion as congruent release applied to three components; ends at the loading boundary of limit of congruency and its failure is incongruent release; achieved here through polymer-controlled release from an eroding gel layer; depends on drug loading and on pH-dependent solubility of the peptide; intended to serve membrane transport and oral bioavailability, neither of which was measured.

Formulas

surface-normalized release rate is the test for co-release in the compact route; equal values for every component are the criterion bapat2025b E1, C15.

How it is measured or obtained

Two routes, one per paper. (1) Surface-normalized release from a constant-area compact in a Wood's rotating die (100 mg, 0.5 cm² exposed face, 100 rpm, 100 mL of 50 mM pH 6.8 phosphate buffer, 37 °C, n = 3), with each component assayed in the same run by reversed-phase HPLC or aqueous size-exclusion chromatography and each profile converted to a rate per unit area and per weight fraction by surface-normalized release rate; equal rates mean the dissolved mixture has the composition of the solid bapat2025b P4, P2, E1. (2) Paddle dissolution of minitablets (40 mL, 75 rpm, samples to 120 min, n = 3) with peptide and enhancer assayed in the same samples by size-exclusion HPLC, compared by their times to maximum release [fagan2025 P4, P7, R20]. Both routes need every component to be assayable: sodium decanoate could not be quantified in the first study, so its co-release is inferred, and in the second the same enhancer was below detection in the two gastric media until the vessel was made basic [bapat2025b R6, C19, X1; fagan2025 R14, R16].

Values in the library
materialvalue or classconditionspaper ids
octreotide : SNAC : copovidone, 1.6% peptideco-release; ≈8.1 / ≈8.4 / ≈8.9 mg min⁻¹ cm⁻²; complete 25–30 minpH 6.8, 0.5 cm² compact, 37 °Cbapat2025b R2.f–h, R5
octreotide : sodium decanoate : copovidone, 1.6% peptideco-release of the two assayable components; ≈23 / ≈25 mg min⁻¹ cm⁻²; complete in about 10 min; enhancer inferredsamebapat2025b R2.j–k, R9, C19
SNAC : copovidone 50:50 (no peptide)≈7.9 / ≈8.7 mg min⁻¹ cm⁻², about 4.4 and 2.7 times the neat ratessamebapat2025b R2.d–e, X18
cyclosporine : copovidone ± enhancer, 1.6% peptidepeptide follows the polymer: complete in about 50 min (binary), about 10 min (decanoate), ≈95% at 60 min (SNAC)samebapat2025b R10, C21
cyclosporine ternaries, 5–20% peptideco-release lost: polymer complete while peptide stalls at ≈54.5% and ≈16% (decanoate), all components slowed (SNAC)samebapat2025b R11.i, R12.i, R13.i
insulin with 72% sodium caprate or SNAC, minitabletstaggered: enhancer maximum at about 10–20 min, insulin at about 30 minsix simulated fluids, 40 mL, 75 rpm[fagan2025 R20, R14, R15]
neat peptide and neat enhancer, no release-controlling excipientrates differ: ≈4.5 (octreotide) against ≈1.8 (SNAC) mg min⁻¹ cm⁻²; amorphous cyclosporine below 0.1% in 6 hpH 6.8, 0.5 cm² compactbapat2025b R2.a–c, R14
Pitfalls and disagreements

The criterion is only as good as the assay: a component that cannot be quantified turns co-release into an inference, as for sodium decanoate in every dispersion of the first study, which also carries its extension "to different types of PEs" bapat2025b X1, C43. Overlapping profiles are not the same as equal rates: the cyclosporine dispersions are called congruent although no normalized rate was computed for any of them, and at 1.6% loading with SNAC the peptide in fact lagged the enhancer and polymer (≈75.5% against ≈85% and ≈89.5% at 30 min) bapat2025b X2, R10.f, C21. In the minitablet study the enhancer's apparent incompleteness is partly an artefact of the centrifugation step, since almost all of it was recovered once the medium was made basic, which makes the measured stagger an upper bound [fagan2025 C28, R16, X9]. Release above 100% in both papers bounds the precision to a few percentage points [bapat2025b X9; fagan2025 X11]. Co-release says nothing about the state of the released enhancer: it may sit in colloidal self-assemblies or a second phase rather than as free monomers or micelles, "which may restrict their efficacies", and SNAC quenched the octreotide fluorescence in solution, an interaction that was not followed up [fagan2025 C43, C32; bapat2025b C31]. No paper in the library relates any co-release measurement to a permeability, cell, tissue or in vivo result; the optimal release timeframe "remains to be elucidated" [bapat2025b C37, C6; fagan2025 C45].

← Concepts and formulas

concept · as used in Dissolution

pH-dependent polymer solubility

Evidence table: pH-dependent polymer solubility. Content from the ASD dissolution chapter (2014, 2015) and from papers of the release-mechanism and crystallization-from-solution chapters.

The change of a polymer's aqueous solubility with pH through ionization of its acidic or basic groups. HPMCAS, an enteric polymer, is a weak acid (pKa about 5), insoluble when un-ionized and soluble when sufficiently ionized kaur2025 C27. In the ASD dissolution chapter this is used twice: an HPMCAS dispersion of nifedipine placed at pH 2 keeps its matrix in place because the polymer is not very soluble there (cited) raina2014b C25, and celecoxib–HPMCAS particles are dosed as an acidified suspension because the polymer stays largely undissolved at pH 3 chen2015a R18. The papers of 2015–2018 add further uses: a resveratrol–HPMCAS dispersion crystallized about equally at pH 6.8 and at pH 1.2, where HPMCAS is "essentially insoluble", which placed the crystallization in the matrix wegiel2015 M4, C16; enteric dispersions of lopinavir at pH 3 leached less than 5 µg/mL of polymer li2016b R3, C8; at pH 3 HPMCAS, HPMCP and CAP stay undissolved, which keeps a mixed dispersion's composition and lets the polymer lower the drug's maximum concentration li2018 C12, C45; and the cationic EPO dissolves by ionization at pH 2.2 but is "soluble up to pH 5" xie2017 M3, C29. New aspect (Release mechanism and LoC, 2024–2025): the HPMCAS grades differ in how much they need to ionize: the more succinoylated LF dissolved about three times faster than HF at pH 6.8 and 7.5, and the authors propose that it needs less ionization to dissolve bapat2025a R1, C25. HPMCAS alone stays dissolved at pH 5.8 and above at 0.5 mg/mL, while about 77% ionization is estimated to be needed for it to start dissolving kaur2025 C11, R3, C28. A drug that complexes the polymer lowers its solubility at a pH where it would otherwise dissolve (insoluble drug-polymer complex) bapat2024 C29. Co-precipitation into acidified water uses the low solubility of HPMCAS at low pH to make high-loading particles hiew2025 C6.

Findings

Supersaturation from ASD dissolution: F2, F15, F1, F15, F16, F18, F19, F21, F24, F25, F27. Release mechanism and LoC: F23, F33, F34, F35.

Related concepts

related to polymer ionization, drug leaching and polymer-controlled release. Set by critical ionization for polymer dissolution; lowered at the surface by microenvironmental pH and by an insoluble drug-polymer complex.

Formulas

Henderson-Hasselbalch equation.

How it is measured or obtained

By polarized light of the undissolved matrix raina2014b P5, by colorimetric assay of dissolved polymer chen2015a P12, or by polymer solubility at fixed pH kaur2025 R4.

Values in the library
materialvalue or classconditionspaper ids
nifedipine–HPMCAS 50:50 at pH 2matrix undissolved and amorphous for 3 hpolarized light, Ramanraina2014b R15
HPMCAS-LF from celecoxib particles at pH 3about 1.5–3.5 µg/mL in the liquid over 24 h without surfactant25 °Cchen2015a R18
HPMCAS LF and MF at pH 5.0 (Release mechanism and LoC)about 250 and 110 µg/mLblank FeSSIF-V1 pHkaur2025 R4
HPMCAS grades with posaconazole (Crystallization from solution)incomplete release where the grade is less solublepH 5.5–7.5shah2025 C16
HPMCAS at gastric pH (Release mechanism and LoC)insoluble, so exposed surface area mattered only in the FaSSIF stagetwo-stage releasehiew2025 C32
HPMCAS LF / MF / HF / HPMCP, spray-dried alone≈15 / ≈19 / ≈68 / below 5 µg/mLpH 3, 25 °C, 1–3 hli2016b R2
the same from 33% lopinavir dispersionsbelow 5 µg/mLpH 3li2016b R3
HPMCAS-HF from lopinavir dispersions with SDS at pH 5≈74.5–134 µg/mL25 °Cli2016b R13
cellulosic polymers in lopinavir release testsmostly below detection, estimated 3–25 µg/mLpH 3, 25 °Cli2018 R5
HPMCP-50; HPMCP-55893 ± 95 and 189 ± 18 µg/mL at pH 5.0; insoluble below pH 4.548 h, 37 °Cnguyen2023c R4
HPMCAS-LF; -MF; -HF1687 ± 47 and 1401 ± 69 µg/mL at pH 5.5; HF only from about pH 6.048 h, 37 °Cnguyen2023c R4
Eudragit L 100-55 coat on tabletsintact 15 to more than 17 h at pH 1.6–3.0; failed after ≈130 min at pH 4.5 and ≈150 min at pH 5.0; dissolved within 10–15 min at pH 6.0500 mL, 37 °Cnguyen2023b R7
neat HPMCAS LF, MF, HF≈1.50 / 0.90 / 0.45 (pH 6.8) and ≈1.73 / 1.09 / 0.63 mg/min/cm² (pH 7.5)compacts, 50 mM phosphate, 37 °Cbapat2025a R1
HPMCAS LF, MF slurries in waterpH 4.52, 4.61 (HF 4.73)overnight stirringbapat2025a M3, M4, M5
HPMCAS with ≈5 mg/mL solubility at pH 6.0lowered by lipophilic weak bases through complexationspike testbapat2024 C29
bedaquiline–HPMCAS 20% in FeSSIF-V1 (pH 5.0)≈22.5–25% releasedpowder, 120 minkaur2025 R16, C51
Pitfalls and disagreements

A surfactant can dissolve the polymer at low pH and undo the effect (SDS raised dissolved HPMCAS to about 860 µg/mL at pH 3) chen2015a R18. The low dissolved levels at pH 3 lie far below the printed calibration range of the assay chen2015a X8. HPMCAS-HF, the grade with the highest pKa, leached most of the three grades at pH 3, "somewhat counterintuitive", perhaps from a small low-pH-soluble fraction ("may") li2016b C9, C10; the dispersion polymer values lie below the detection limit or near the quantitation limit li2016b X7. Dissolved polymer does not guarantee released drug: delamanid release from an HPMCAS-HF dispersion stayed near zero at pH 6.5 while about 30% of the polymer dissolved nguyen2023c R11, R12. The printed polymer solubilities above about 3.3 mg/mL exceed what the stated amounts allow nguyen2023c X1. The MF slurry pH has no stated source bapat2025a X4; raising the bulk pH speeds the neat polymer as well as reducing drug ionization, so the two effects are not separated in the grade comparison bapat2025a K2.

← Concepts and formulas

concept · as used in Dissolution

pH-dependent solubility

The rise of the solubility of an ionizable drug as pH moves toward and past the pKa; for a weak base the total solubility is the free-base solubility times (1 + 10^{\mathrm{p}K_a-\mathrm{pH}}) indulkar2015 E8. The amorphous solubility follows the same shape with the amorphous free-base solubility in place of the crystalline one, so the un-ionized concentration at the LLPS onset is constant across pH (F10) indulkar2015 C46, R9. The papers of 2017–2022 add pazopanib, for which the crystalline free base follows the curve from pH 5 to 8.4 and the amorphous solubility follows its curve from pH 6 upward but lies below it at pH 5 and 5.5 sugihara2018 R2, R3, C10, C11. New aspect (Crystallization from solution): in the pH-shift studies the shift itself generates supersaturation, since weak bases with pKa 5–8 dissolve at gastric pH 1.5–3.5 and can precipitate at duodenal pH 5–7 hsieh2012 C1; the Bjerrum plot ties the pH, the total concentration and the solubility of whatever solid is present, and the curve moves by \log_{10}(S_0'/S_0) pH units when the solid's solubility changes (0.85 units for 11.3 against 1.6 µg/mL) hsieh2012 E2, R9. New aspect (Supersaturation from ASD dissolution): a weak acid. Indomethacin (pKa 4.42, cited) has an aqueous solubility of 1.5 µg/mL at pH 1.2 and 105 µg/mL at pH 7.4 (cited) xie2017 M1; the measured solubility of the α crystals rose from 2.8 µg/mL at pH 2.2 to 15 µg/mL at pH 5 xie2017 R1, R2. In a two-stage test the rise of pH after the acid stage therefore turns what separated in acid into a solid that can dissolve again: the drug-rich droplets of an EPO–HPMC dispersion disappeared within minutes of a rise to pH 5, "consistent with" an increase in the amorphous solubility on ionization xie2017 C40, R20. Weak bases (formerly the page "pH-dependent solubility of weak bases", from ASD process and Supersaturation from ASD dissolution): the solubility of a weakly basic drug rises when it is ionised at low pH and falls when the pH rises. Ritonavir (pKa 1.8 and 2.6) is "highly, not completely" ionised at pH 1.2, with a crystalline solubility of about 0.4 mg/mL there against 1.8 µg/mL at pH 6.8, so dissolution in 0.1 N HCl is at sink and at pH 6.8 strongly non-sink; lopinavir is not ionised at either pH trasi2019 M1, M2, C14. On a pH rise the ionised drug becomes supersaturated and, above its amorphous solubility, forms a drug-rich phase trasi2019 C40. For posaconazole the acid stage releases drug that becomes supersaturated at pH 6.5; extruded dispersions release more in acid than amorphous ones because crystalline drug sits apart from HPMCAS, which does not dissolve in acid shah2024 C41, R12. Coated posaconazole powders were held 30 min to 4 h at pH 1.6 or 4.0 and then moved to pH 6.5 [moseson2023 R10, R12, R13]; coated and uncoated ritonavir tablets released alike in 0.1 N HCl, where the drug is far more soluble benson2025 R12. For a weak base formulated with an enteric polymer, the drug and the polymer change their solubility in opposite directions across the gastric-to-intestinal range, and the window in which neither dissolves well decides the outcome. Delamanid, with a fitted pKa of 3.94 ± 0.04 against a reported 4.3, loses about 500-fold of its crystalline solubility and about 200-fold of its amorphous solubility between pH 1.6 and 6.5, while the enteric polymers dissolve only from about pH 5–6; the authors summarize that at pH 1.6 the drug dissolves and the polymers do not, at pH 3.0 and 5.0 both are poorly soluble, and at pH 6.5 the polymers dissolve and the drug hardly at all nguyen2023c R1, R2, R3, R4, C14, C15. Posaconazole shows the same pattern between gastric and intestinal fluid, which the authors attribute to nearly complete ionization in acid elkhabaz2019a R1, C11.

Findings

Amorphous solubility and LLPS: F10, F23. Crystallization from solution: F1, F2, F34. Supersaturation from ASD dissolution: F21, F24, F25. ASD process: F23, F24, F41, F46, F48.

Related concepts

depends on ionization and pKa; applies to crystalline solubility and amorphous solubility; related to intrinsic solubility and pH-induced precipitation; related to pH-shift dissolution, precipitate redissolution and polymorphism; produces supersaturation read in non-sink dissolution; mixing in the drug-rich phase gives mutual amorphous solubility reduction; sets the window with pH-dependent polymer solubility; drives salt disproportionation; read with gastric pH variability and drug leaching.

Formulas

pH-solubility profile, Henderson-Hasselbalch equation, Bjerrum function, amorphous-to-crystalline solubility ratio.

How it is measured or obtained

Shake-flask crystalline solubility in 0.1 M buffers over about ±2 pH units of the pKa; LLPS onset by antisolvent addition, fluorescence and solvent-free pH-shift titration at each pH indulkar2015 P3, P8, P9, P10. In the pH-shift studies the crystalline solubility of the neutral form is measured at a pH at least two units above the pKa for bases (pH 10 buffer) or below it for acids (pH 2 buffer) hsieh2012 P11; hsieh2014 P5; potentiometric (CheqSol) titration of the neutral concentration and 72 h shake-flask solubility at fixed pH hsieh2012 P4, P11. For indomethacin: shake-flask solubility of the γ and α forms in pH 2.2 McIlvaine buffer (37 °C, 48 h) and of the α form at pH 5, with and without dissolved polymer xie2017 P2, R1, R2. For weak bases in the ASD process papers: dissolution in 0.1 N HCl and pH 6.8 phosphate buffer, and an acid-to-pH 6.8 shift with ultracentrifugation of the supernatant trasi2019 P8, P9, P11, P12. In the ASD dissolution papers: crystalline solubility by shake flask in each buffer and amorphous solubility by the onset of light scattering during slow addition of a stock, with a Henderson–Hasselbalch fit over the measured values to give the pKa nguyen2023c P1, P2, E1; the same measurements in simulated gastric and intestinal fluids elkhabaz2019a P2, P4; duong2022a P1, P2.

Values in the library
materialvalue or classconditionspaper ids
clotrimazolecrystalline 0.55 (pH 8) to about 62 µg/mL (pH 4); LLPS 7.7 to 490.2 µg/mL37 °Cindulkar2015 R4, R5, R18
atazanavircrystalline 1.04 (pH 9) to about 40 µg/mL (pH 3); LLPS about 65 to about 1970 µg/mL37 °Cindulkar2015 R4, R6
nicardipineLLPS 5.5 (pH 9) to about 355 µg/mL (pH 5.5); no crystalline value37 °Cindulkar2015 R7, R1
CRH1un-ionized onset about 12 µg/mL at pH 6.8 and pH 4.625 °Calmeidaesousa2016 R24
pazopanibcrystalline about 0.60 → 0.018 µg/mL; amorphous 60 → 9.2 µg/mL (pH 5 → 8.4); ratio about 103 at pH 5, 500–600 from pH 6.437 °C, 0.1 M buffers + 5 µg/mL HPMCsugihara2018 R1, R2, R4
loratadineBjerrum data on the curve for S0 = 11.3 µg/mL, 0.85 pH units from the curve for the crystal (1.6 µg/mL)37 °Chsieh2012 R9, E2
dipyridamoledata left the ionization curve at pH about 5.1 and met the crystal curve at pH about 4.037 °Chsieh2012 R4
papaverine, dipyridamole, glyburide, warfarincrystalline solubility in pH 10 or pH 2 buffer: 12.2, 5.4, 0.2 (titration), 3.7 µg/mL25 °C, no polymerhsieh2014 R4
posaconazolecrystalline 0.27 (pH 5.5–7.0) to 347.03 µg/mL (pH 1.0); amorphous 8.92–9.20 to 7761.96 µg/mL; diprotic HH fitphosphate buffers, 0.14 M, 37 °Cduong2022b R1, R2, E4
indomethacin (cited)1.5 µg/mL at pH 1.2 to 105 µg/mL at pH 7.4; pKa 4.42literaturexie2017 M1
indomethacin γ; α1.61; 2.8 µg/mL at pH 2.2; α 15 µg/mL at pH 537 °C, no polymerxie2017 R1, R2
delamanid, amorphous and crystalline154.5 → 0.76 and 10.2 → 0.018 µg/mL between pH 1.6 and 6.5, a ratio of 42; fitted pKa 3.94 ± 0.04 against a reported 4.3 (Henderson–Hasselbalch fit)37 °Cnguyen2023c R1, R2, R3
praziquantelamorphous 1.17–1.43 mg/mL across six buffers; calculated pKa 1.14, so the drug is neutral above about pH 337 °Calvarenga2025 R1, R4
ritonavir from the marketed tabletabout 84 µg/mL in acid falling to about 4.6 after the shift to pH 6.8200 mL acid, 30 min, then NaOH and buffertrasi2019 R8
ritonavir solution without excipientsabout 97 → 16 µg/mL after neutralisation; precipitate not birefringentultracentrifuged supernatanttrasi2019 R9, R10
posaconazole (outside)solubility much higher in the gastric than in the intestinal medium because the drug is nearly completely ionised in acidbiorelevant mediaelkhabaz2019a C11, C40
delamanid (outside)pH-solubility profile of a weak base by the Henderson–Hasselbalch equationbuffers and medianguyen2023b E1, R13
posaconazole form Icrystalline solubility 86.5 µg/mL at pH 1.6 (FaSSGF) and 1.2 µg/mL at pH 6.5 (FaSSIF V2); LLPS concentration 2326 and 19.1 µg/mL37 °Cshah2024 R11, C14
PCZ–HPMCAS extruded at 125 °C against 175 °C, 10 / 25 / 50% DLabout 38 / 43 / 73.5 against 30 / 28.5 / 39.5 µg/mL after 60 min at pH 1.6two-stage testshah2024 R12, R15, R18
coated and uncoated 20% DL RTV–PVPVA tablets in 0.1 N HClabout 87–91% at 60 mintabletsbenson2025 R12
delamanid in biorelevant media, crystalline; amorphous17.6 / 0.52 / 0.086 / 0.018 and 69.9 / 7.93 / 3.11 / 0.76 µg/mL (FaSSGF, FaSSIF V1, FaSSIF V2, PBS pH 6.5)37 °Cduong2022a R1
posaconazole, crystalline115.1 ± 9.4 µg/mL in FaSSGF against 1.69 ± 0.06 µg/mL in FaSSIF48 h, 37 °Celkhabaz2019a R1
posaconazole, amorphousabout 20 µg/mL in FaSSIF with 20 µg/mL HPMCAS; 8 µg/mL in plain buffer pH 6.537 °Celkhabaz2019a R2, R4
Pitfalls and disagreements

The predicted amorphous curve is the crystalline curve times one factor, so it is not an independent test of the shape indulkar2015 X14. The relation holds where the solution is in equilibrium with the neutral form and not the salt indulkar2015 E8. Below pH 6 the amorphous boundary of the pazopanib diagram is a model curve, not a measurement sugihara2018 X12. Solubility was measured in other buffers than the precipitation, and buffer compositions are not given hsieh2014 X8. The legend of the loratadine Bjerrum figure names the predicted amorphous solubility, the text the supernatant value (11.0 against 11.3 µg/mL) hsieh2012 X6. The plotted Henderson–Hasselbalch fit of the posaconazole paper lies far below the data at pH 2.5–3.0 for one assignment of the two pKa values duong2022b X3. The pH profile of indomethacin is cited, not measured, and its amorphous solubility was measured at pH 2.2 only, so the ionization explanation of the droplet disappearance at pH 5 is an inference xie2017 M1, R3, C40. Ionization does not explain the whole pH dependence of release: praziquantel, neutral above about pH 3, still lost release after gastric stages at pH 3.0 and 5.0, so the pH dependence of release need not come from the drug alvarenga2025 R4, R10. Acid-stage release does not rule out the problem: the neutral partner drug still lowered ritonavir release in acid, and the fall after the pH shift reflects loss of ionisation, dilution and mixing with the partner (not separated) trasi2019 C41, C47. The final pH after the shift was not measured and the acid volume is printed as 250 mL in the caption and 200 mL in the methods trasi2019 X4, X5. The fitted curve for delamanid follows the amorphous data but gives about 3.7 instead of the measured 10.2 µg/mL for the crystal at pH 1.6 nguyen2023c R3. The gastric supersaturation that the drug's own pH dependence creates did not order the final release of delamanid dispersions nguyen2023c C39.

← Concepts and formulas

concept · as used in Dissolution

pH-induced precipitation

The precipitation of an ionizable drug when a change of pH makes its neutral, less soluble form exceed the crystalline solubility: a weak base dissolved in the stomach can precipitate at duodenal pH 5–7 hsieh2012 C1; the 2014 series also shifted two weak acids to a final pH of 1.9–3.3 hsieh2014 P2. Precipitation of a base releases protons and lowers the pH, dissolution consumes them hsieh2012 C6.

Findings

F1, F2, F16.

Related concepts

produces amorphous precipitation; classified by chaser and non-chaser behaviour; related to ionization and ph-dependent solubility.

Formulas

Bjerrum function, supersaturation factor, scattering vector.

How it is measured or obtained

By potentiometric (CheqSol) titration in a Sirius GLpKa titrator: drug dissolved at low pH, titrated with KOH to the turbidity point, then alternating acid and base aliquots; neutral concentration from mass and charge balance, with the solid examined by polarized light, DSC and PXRD or synchrotron WAXS and the supernatant by HPLC hsieh2012 P4–P6, P9–P12; hsieh2014 P1–P7. For the 2014 polymer series the drug was dissolved in its ionized form with or without 1 mg/mL polymer and the pH moved two units beyond the pKa hsieh2014 P2.

Values in the library
materialvalue or classconditionspaper ids
ten weak basesfive crystalline (supersaturation 3.1–14.7 min) and five amorphous (7.2–20.7 times crystalline solubility)37 °C, 0.15 M KClhsieh2012 R1, R5, R10
papaverine, dipyridamole, glyburide, warfarin, no polymerpeaks about 240, 84, 6.5 and 165 µg/mL; crystallized25 °Chsieh2014 R1
glyburide, warfarin with six to eight polymersamorphous precipitate for at least 6 h; warfarin 103–224 µg/mL1 mg/mL polymerhsieh2014 R4
pazopanib HCl shifted from simulated gastric to pH 6.5 (amorphous solubility chapter)supersaturation 5 ± 2 min without HPMC, about 39 min with 50 µg/mL37 °Csugihara2018 R22
Pitfalls and disagreements

The titration amounts and replicate numbers are not printed, the duration of supersaturation has no criterion, and the degree of supersaturation is defined differently for the two types hsieh2012 X13, X5, X3. In 2014 solubility was measured in other buffers over 72 h and concentration in KCl within 1 h hsieh2014 X8. No in vivo data test the link to absorption hsieh2012 C28.

← Concepts and formulas

concept · as used in Dissolution

pH-shift dissolution

Two-stage dissolution in which the dose dissolves in acid and the pH is raised, creating supersaturation of a weak base [hate2017 C8, C41]. Two-stage tests were also used for the enteric-polymer pretomanid ASD: a gastric stage, then fasted or fed intestinal medium [nguyen2023a P11, P12, C63].

Findings

F10, F14, F26, F27.

Related concepts

related to non-sink dissolution and ionization.

Formulas

none.

How it is measured or obtained

30 min in 0.1 N HCl, then an equal volume of 0.17 M Na2HPO4, giving pH 6.5 [hate2017 P7].

Values in the library
materialvalue or classconditionspaper ids
nevirapine powder (100 mL) and tablet (400 mL)nominal S 3.9; donor 475–500 µg/mL after the shift37 °C[hate2017 R7, R18]
ketoconazole, clozapine on silicadissolved amount decreased by 30–35% on shiftingpH 1 to 5.5/6.8[hate2020b R10, R11]
pretomanid ASD tablets1 h gastric stage, then intestinal medium: all three tablets crystallized30 mg in 150 mL[nguyen2023a R22, P12]
Pitfalls and disagreements

The PVPVA run used another route to supersaturation [hate2017 X15].

← Concepts and formulas

concept · as used in Dissolution

pH-shift supersaturation

The supersaturation that arises when a weak base dissolved as its ion at low pH meets a higher pH, as on transfer from the stomach to the small intestine, so that its solubility falls by orders of magnitude while the dissolved amount stays duong2022b C2, C38; enright2020 C2. If the un-ionized concentration then exceeds the amorphous solubility a colloidal drug-rich phase forms, otherwise the drug can only crystallize indulkar2015 C53; trasi2019 C40. The content comes from Dissolution / D. Crystallization from solution (posaconazole and atazanavir, 2020–2022) with comparison rows from the chapters on amorphous solubility and LLPS, Bioperformance and ASD process; the pH-shift titration of weak bases of 2012–2014 is treated under pH-induced precipitation.

Findings

F1, F2, F20, F34.

Related concepts

part of supersaturation; depends on pH-dependent solubility and ionization; related to pH-induced precipitation, amorphous solubility and liquid-liquid phase separation.

Formulas

The diprotic Henderson–Hasselbalch relation \log C = \log C_o + \log(10^{pK_{a1}+pK_{a2}-2pH} + 10^{pK_{a2}-pH} + 1) fitted to posaconazole solubility duong2022b E4; see the shared pH-solubility profile and Henderson-Hasselbalch equation.

How it is measured or obtained

By the crystalline and amorphous solubility across pH (shake flask and onset of light scattering), which bound the possible outcomes duong2022b R1, P3, P6; by a pH-shift titration in which the concentration at precipitation is recorded indulkar2015 R8; and by two-stage dissolution or neutralization of an acidic drug solution with the dissolved drug measured after ultracentrifugation trasi2019 P11, P12, R9.

Values in the library
materialvalue or classconditionspaper ids
posaconazolecrystalline 347.03 µg/mL at pH 1.0 against 0.27 at pH 5.5–7.0; amorphous 7761.96 against 8.92–9.20 µg/mLphosphate buffers, 0.14 M, 37 °Cduong2022b R1
posaconazoleamorphous/crystalline about 34 from pH 2 to 7 (22–28 at pH 1.0–1.6)as aboveduong2022b R1, C19, X5
atazanavirsupersaturates in the intestine after dissolving in the stomach (cited); every run at the amorphous solubilitypH 6.5 mediaenright2020 C2, C10
ritonavir with lopinavir (Aluvia composition)ritonavir about 97 → 16 µg/mL dissolved on neutralizing from pH 1.2 to 6.8ultracentrifuged supernatanttrasi2019 R9
nevirapine (pKa 2.8)supersaturated solutions readily made by raising the pHabsorptive dissolution[hate2017 C8]
Pitfalls and disagreements

For posaconazole the amorphous-to-crystalline ratio is constant only from pH 2 to 7, and the plotted Henderson–Hasselbalch fit departs from the data at pH 2.5–3.0 for one pKa assignment duong2022b X5, X3. Undissolved crystals carried from the stomach can remove the induction period (up to 30% of a 40 mg crystalline dose may stay undissolved, cited) duong2022b R20, R13. Two-step pH-change tests are increasingly used because many weak bases are expected to supersaturate on gastric emptying [hate2017 C41].

← Concepts and formulas

concept · as used in Dissolution

phase inversion

Evidence table: phase inversion. Content from the release-mechanism chapter (2022–2025), with rows from the Solid-state methods chapter.

The change of which of two separated phases is continuous and which forms discrete domains, as their relative amounts change. In dissolving PVPVA dispersions the lower-volume phase forms the discrete phase and the higher-volume phase the continuous one, so inversion from a discrete to a continuous drug-rich phase "is anticipated" as drug loading rises; the low-composition component tends to form the discrete phase, which gives a discrete drug-rich phase and fast congruent release at low loading (cited) yang2022a C46, C59. In MePHPH–PVPVA compacts the morphology inverted at 50% (hydrophobic continuous, hydrophilic discrete), persisted and coarsened deac2023a C26. In the Solid-state methods chapter dry dextran–PVP blends with distinct phases had a dextran-rich continuous phase with PVP-rich domains at high dextran molecular weight and inverted morphology for DEX40-PVP90 and DEX6-PVP90 [vaneerdenbrugh2012c C43]. The 2024 papers locate it: clotrimazole films with PVP K12 and K29/32 held drug-rich droplets to 30% and a continuous drug-rich phase at 40% after 1 h at 100% RH, named "Failure Mode II" deac2024a R8, C23, C40; MePHPH films kept droplets to 30% and were continuous from 50%, PHPH films switched between 10 and 15%, and the lever-rule fraction of drug-rich phase jumps from about 0.15 to 0.82 across the critical point, taken as a surrogate for inversion deac2024b R18, R19, R35, C64.

Findings

Release mechanism and LoC: F20, F25, F27, F29, F30.

Related concepts

part of phase separation morphology; its loading is shifted by associative phase separation and segregative phase separation; relative phase amounts from the lever rule; gives the drug-rich barrier layer when the drug-rich phase becomes continuous.

Formulas

lever rule (relative phase amounts).

How it is measured or obtained

Fluorescence confocal imaging of the edge of a dissolving compact with two dyes that partition into the two phases, and imaging of compact surfaces after partial dissolution deac2023a R6, R9; in dry blends local AFM-IR spectra of the continuous phase and the domains [vaneerdenbrugh2012c R15, R17].

Values in the library
materialvalue or classconditionspaper ids
MePHPH–PVPVA 5–30%; 40%; 50%discrete particles below 1 µm; networks; inverted, hydrophobic continuousin situ confocal of the dissolving compact edgedeac2023a R6, C26
MePHPH–PVPVA 30%; 50% compact surfaces50% surface the inverse of the 30% surfaceafter partial dissolutiondeac2023a R9, C35
dextran–PVP blends DEX450-PVP12, DEX40-PVP12; DEX40-PVP90, DEX6-PVP90 (Solid-state methods chapter)dextran-rich continuous phase; phase inversionAFM-IR, dry films[vaneerdenbrugh2012c C43, R15, R17]
clotrimazole–PVP K12, K29/32 filmsdroplets at 20–30%, inverted at 40%100% RH, 1 h, confocaldeac2024a R8
MePHPH–PVPVA films 10–60%droplets to 30%; co-continuous 1 h, droplets 6 h at 40%; continuous 50–60%100% RH, confocaldeac2024b R18
PHPH–PVPVA films 5–20%droplets 5–10%; continuous 15–20%samedeac2024b R19
Pitfalls and disagreements

For ritonavir the inversion is an expectation argued from phase volumes, not located at a measured loading yang2022a C46. In the dissolving compacts the continuous drug-rich phase appeared at 40% as networks before full inversion at 50%, so the change was gradual over loading deac2023a C26. The loading at which MePHPH becomes continuous is stated as above 40%, 40% or higher, and 35–40% in different parts of the 2024 paper deac2024b X4; for PHPH the computed critical point (3.7% as the paper states; about 4.2% read from its diagram, see critical point) lies below the film switch deac2024b X5. Inversion was imaged for two PVP grades only deac2024a X8.

← Concepts and formulas

concept · as used in Dissolution

phase separation kinetics

Evidence table: phase separation kinetics. Content from the release-mechanism chapter (2017–2022).

The rate at which a hydrating dispersion undergoes water-induced amorphous–amorphous phase separation, set against the rate at which it dissolves. Saboo and co-workers (2020) state that the thermodynamic favourability of water-induced AAPS depends on drug loading, polymer type, the relative affinity of drug and polymer for water and the water absorbed, and that its kinetics compete with dissolution ("it has been suggested") saboo2020a C39. The competition "may be key": if dissolution is faster, drug and polymer release congruently and the surface keeps its composition; if AAPS is faster, the polymer-rich domains dissolve first, the surface turns drug-rich and drug release slows saboo2020a C41. The ritonavir and ledipasvir papers explain the steep drop of release over a small loading step the same way, by a faster rate of AAPS relative to dissolution at high loading ("can be attributed"; "may") indulkar2019a C33; que2019 C35. Saboo and co-workers (2021) assume separation in the hydrated matrix to be faster than polymer dissolution and propose that TPGS may slow it or slow coarsening saboo2021 C38, C41, C51; Correa Soto and co-workers (2022) find the kinetics and morphology changed by the surfactant, with a significance for release "if any" unknown correasoto2022a C61, and in the atazanavir study separation needs mobility that the surfactants supply correasoto2022b C41.

Findings

Release mechanism and LoC: F8, F20.

Related concepts

the rate of amorphous-amorphous phase separation; proposed cause of the limit of congruency; depends on drug-polymer-water miscibility.

Formulas

none.

How it is measured or obtained

Not measured as a rate in the release papers: inferred from films dipped in water for seconds or held at high humidity, together with the release data indulkar2019a X6; saboo2020a C41. The time course was followed only by the pyrene ratio of ritonavir films at 97% RH, where all PVP and PVPVA films began to separate as early as 1 h purohit2017b R2, C22.

Values in the library
materialvalue or classconditionspaper ids
ritonavir 50:50 PVP, PVPVA filmsseparated within 10 s in buffer; 10:90 did not25 °Cpurohit2017b R4, R9
ritonavir PVP, PVPVA filmsAAPS from about 1 h at 97% RHpyrene I/IIIpurohit2017b C22
felodipine dispersions ≤ 10%dissolution thought to outpace AAPS with every polymerargumentsaboo2020a C41
atazanavir–PVPVA 10% filmsbinary uniform for 3 h at 37 °C, separated within 10 min at 50 °C; surfactant films within 10 min100% RHcorreasoto2022b R9, R12, R10, R11
Pitfalls and disagreements

Neither the rate of AAPS nor that of dissolution was measured on the same sample; the competition is the authors' inference from films plus release data indulkar2019a X6. At low loading too little drug for a contiguous layer may keep release congruent as well as slower AAPS saboo2020a C42.

← Concepts and formulas

concept · as used in Dissolution

phase separation morphology

Evidence table: phase separation morphology. Content from the release-mechanism chapter (2021–2023), with rows from the Physical stability chapter.

The shape and connectivity of the drug-rich and polymer-rich phases that form when water separates a drug–polymer dispersion: discrete (circular, separated) drug-rich domains in a continuous polymer-rich phase, bicontinuous structures, or a continuous drug-rich phase with discrete polymer-rich domains saboo2021 R21, R23; correasoto2022a R20. Saboo and co-workers (2021) propose that at high loading whether release is drug- or polymer-controlled "depends largely" on the architecture of the drug-rich phase formed in the hydrated matrix saboo2021 C37; in the abstract discrete spherical drug-rich domains with surfactant "appeared to be linked" to congruent, rapid release and a contiguous drug-rich phase to its loss saboo2021 C53. For clopidogrel the binary films matched the release profiles and "earlier reports" that continuous drug-rich phases go with poor release correasoto2022a C32. Domain size and interconnectivity of the drug-rich domains "appear" critical for release of ritonavir–PVPVA, and a continuous drug-rich phase is called catastrophic for drug release yang2022a C4, C58.

Findings

Release mechanism and LoC: F20, F21, F25.

Related concepts

the outcome of amorphous-amorphous phase separation; kept discrete when drug-rich phase coarsening is slowed; a continuous drug-rich phase acts as a drug-rich barrier layer; set within the gel layer; changed by surfactant partitioning into the drug-rich phase.

Formulas

none.

How it is measured or obtained

AFM topography and deflection and AFM-nanoIR ratio images of 30% felodipine films after 12 h at about 100% RH saboo2021 R21, R23; micro-CT of tablets after 10 min of dissolution saboo2021 R19; fluorescence confocal imaging with Nile red (drug) and Alexa 488 (polymer) of films before and after 5 min at 100% RH, with a detection limit of about 500 nm correasoto2022a R20, R21; time-lapse fluorescence and O-PTIR of ritonavir films (Physical stability chapter) [yang2022b R4, R22].

Values in the library
materialvalue or classconditionspaper ids
felodipine–PVPVA 30% with 0, 2% TPGS; 5, 10% TPGSirregular semi-continuous domains; circular, discrete domainsAFM, 12 h at ≈100% RHsaboo2021 R21
felodipine–PVPVA 30% with 0; 10% TPGScontiguous, elongated drug-rich regions; round, separated drug-rich domains in a continuous drug-lean phaseAFM-nanoIRsaboo2021 R23
clopidogrel–PVPVA 40, 50, 60%uniform; bicontinuous; continuous drug-rich phase with discrete polymer-rich domains5 min at 100% RHcorreasoto2022a R20
clopidogrel–PVPVA with 5 g SDS per 100 g at 50%homogeneous within the ≈500 nm detection limitsamecorreasoto2022a R21
clopidogrel–PVPVA with TPGS; with Tween 80, at 50 and 60%bicontinuous, then large irregular structures; fine-scale heterogeneous patternsamecorreasoto2022a R22, R23
ritonavir–PVPVA 30% binary; with SDS or Tween 80; with Span 85 (Physical stability chapter)bicontinuous; discrete circular drug-rich domains; continuous drug-rich phasefilms, time-lapse[yang2022b R4, R22, C9]
ritonavir–PVPVA 10–20%; 30%; 40%discrete droplets 0.5–2 µm; porous continuous layer; continuous layerconfocal of dissolving compactsyang2022a R6, R10, R12, R13
MePHPH–PVPVA 5–30%; 40%; 50%discrete particles below 1 µm; networks; inverted morphologyin situ confocal of the dissolving edgedeac2023a R6, C26
PHPH–PVPVA 10–20%networksamedeac2023a R7
Pitfalls and disagreements

Morphology was imaged in films or humidified compacts, not in the dissolving gel layer; the contiguous network "likely also forms" there saboo2021 C39. Morphology and release did not track in every system: with TPGS the 50% clopidogrel film was bicontinuous correasoto2022a R22, and Correa Soto and co-workers (2022) find kinetics and morphology changed by the surfactant with a significance for release "if any" unknown correasoto2022a C61.

← Concepts and formulas

concept · as used in Dissolution

physical stability

The ability of an amorphous drug or dispersion to stay amorphous, and unseparated, during manufacture and storage [vaneerdenbrugh2010a C19; kestur2013b C46]. In this chapter it is approached through the crystallization tendency of the neat drug; dispersion stability is treated in other chapters. New aspects (Miscibility and drug-polymer interactions): For polymer dispersions, physical stability is read as the time to the first crystalline peaks under a stress condition, and it depends on whether the polymer bonds the drug. Naringenin and quercetin dispersions with E100 or PVP showed no crystals for more than 200 to more than 450 days at each of five storage conditions, whereas dispersions with HPMCAS, HPMC, CMCAB or PAA crystallized within 1–3 days at 84% RH/25 °C and at 75% RH/40 °C [wegiel2013a R9, C22]. Lumefantrine–PVPVA dispersions crystallized after 1 to 8 weeks at 40 °C/75% RH, while enteric-polymer dispersions showed drug crystals only at 50% drug loading hiew2022a R6, C10. Phase separation is expected to lower stability: a phase-separated dispersion "would be expected" to crystallize faster in storage and dissolution [purohit2015a C2, C35; li2016c C1, C41]. Dry storage, humidity and polymer content each change the ranking of polymers [wegiel2013a R9, X3; vaneerdenbrugh2011a C50]. New aspect (Physical stability): for the resveratrol and curcumin dispersions it is likewise read as days before crystals appear at a set storage condition, and it depended "greatly" on polymer and condition [wegiel2013b C23; wegiel2014 C21]. New aspect (Supersaturation from ASD dissolution): two settings in which physical stability decides dissolution performance. For dispersions with two polymers: at 60% indomethacin and 40 °C/75% RH the HPMC and the EPO binaries both crystallized within 5 days (growth much slower with EPO), whereas the EPO–HPMC ternary stayed amorphous for more than 100 days, contrary to the expectation that partly replacing EPO with HPMC would make it similar or slightly worse ("unexpected"); at 30% drug the ternary was also more stable than the HPMC binary xie2017 R26, C51, R27. For suspensions of dispersions dosed preclinically, the crystallization tendency "is expected" to depend on the extent of supersaturation, the polymer solubility in the medium and the polymer's ability to inhibit crystallization in solution and matrix li2018 C60. Lopinavir–HPMCP dispersions, with the strongest solubility suppression, were the most stable against crystallization ("correlates"), and where suppression brought the concentration to or below the crystalline solubility the authors see no driving force for crystallization, so that such dispersions "should remain" physically stable, dry and as suspensions li2018 C61, C62, C63, C64.

Findings

Crystallization tendency: F17, F20, F21. Miscibility and drug-polymer interactions: F15, F17, F23, F24, F26. Physical stability: F24, F25, F26, F30, F33, F34, F35. Supersaturation from ASD dissolution: F18, F20, F23.

Related concepts

includes glass stability and surface crystallization; depends on crystallization tendency; related to amorphous salt; depends on drug-polymer interactions, acid-base interaction and amorphous-amorphous phase separation; includes crystallization inhibition; tested by accelerated stability testing; lost through moisture-induced crystallization; depends on solubility suppression in suspensions; related to ternary amorphous solid dispersion and matrix crystallization.

Formulas

none.

How it is measured or obtained

By storage at set temperature and humidity followed by PLM, XRPD or fluorescence [baird2010 P7; tian2016 R17; hiew2022b R7]; by Raman or PXRD crystallinity against time [kestur2013b R3]. For the lumefantrine and polyphenol dispersions: open-dish storage at 40 °C/75% RH with PXRD at times from 1 to 76 weeks hiew2022a P8; five conditions (22–25 °C over P2O5, 22–25 °C at 84% RH over potassium chloride, 40 °C at 75% RH over sodium chloride, 50 °C and 90 °C over Drierite) with PXRD for the first sharp peaks [wegiel2013a P3]; for thin films, polarized-light scoring of the crystalline area over 7 days of dry storage, expressed as an amorphicity index [vaneerdenbrugh2011a P2, P3, E1]. For resveratrol and curcumin, storage tables of first sampling times with crystals by XRPD at five or six temperature–humidity conditions [wegiel2013b P3, P4, R12; wegiel2014 P5, R13]. In the ASD dissolution papers: open-vial storage of 60% and 30% dispersions at 40 °C/75% RH with PXRD up to 100 days xie2017 P16, R26; in suspension, concentration over 48 h and polarized light microscopy of 50% dispersions in pH 3 buffer without a dissolved inhibitor li2018 P6, P7.

Values in the library
materialvalue or classconditionspaper ids
indoprofen; droperidol, nifedipine; clotrimazole, felodipinecrystalline in 1 day; by 3 months; edges only at 3 monthsquenched glasses, 0% RH, 14–20 °C below Tg[baird2010 R23, R24, R25]
felodipine with 3% PVPnot completely crystallized after 24 weeks30 °C, dry[kestur2013b C11]
indomethacin–PVP dispersions, 10–90% drugamorphous over 3 months (all compositions)40 °C, desiccant[tian2016 R16, C35]
indomethacin with HPMC or HPMCAS, 10–90% drugabove the miscibility limit crystalline in 2–15 days; at or below it amorphous 13–14 months40 °C, desiccant[tian2016 R17, C53]
pretomanid–HPMCAS dispersionsstable several months; neat glass crystallized within minutesambient[nguyen2023a C62]
lumefantrine HCl and sulfate saltsno recrystallization for at least 16 weeks40 °C/75% RHhiew2022b R7
delamanid saltsno PXRD peaks after 2 weeks40 °C/75% RHduong2022a C32
naringenin, quercetin with E100 and PVPno crystals for >200 to >450 daysfive conditions, 40–50% polymer[wegiel2013a R9]
naringenin, quercetin with HPMCAS, HPMC, CMCAB, PAAfirst crystals after 1–3 days84% RH/25 °C and 75% RH/40 °C, 30–80% polymer[wegiel2013a R9]
lumefantrine–PVPVA at 50, 25, 10 and 5% drug loadingfirst crystals after 1, 2, 4 and 8 weeks40 °C/75% RH, open dishhiew2022a R6
lumefantrine at 50% drug loading with HPMCAS, Eudragit L 100, HPMCP, CAPfirst drug crystals after 1, 8, 32 and 40 weekssamehiew2022a R6
resveratrol with PVP K29/32, E100, HPMC, HPMCAS, CMCAB, PAAPVP never crystallized (> 400 days); E100 > 400 days at 84% RH; the others crystalline at day 1 at 84% RH25 °C[wegiel2013b R12]
curcumin with E100, cellulosics, PVP; neat> 350, 75, 22 and 14 days at 84% RH25 °C[wegiel2014 R13]
curcumin dispersionsall > 350 days at 0% RH/25 °C; all crystalline within 1 day at 90 °C/0% RH and 60 °C/98% RHstorage[wegiel2014 R13, C23]
indomethacin 60% with HPMC; EPO; EPO–HPMC 6:2.9:1.1crystals within 5 days; within 5 days, slower growth; amorphous beyond 100 days40 °C/75% RH, open vialsxie2017 R26
indomethacin 30%, EPO–HPMC against HPMCternary more stable (text only)40 °C/75% RHxie2017 R27
lopinavir 50% HPMCP dispersion in suspension≈2.5–3.0 µg/mL over 48 h; no crystals at 48 hpH 3, 25 °C, no inhibitorli2018 R6, R7
lopinavir 50% EC; CA dispersions in suspension≈4.3–5.0 µg/mL to 12 h, then ≈1.6–3.4; ≈10.5–11.2 µg/mL to 12 h, then ≈2.3–3.9sameli2018 R6
delamanid sulfonate salts, neatseven of eight amorphous with Tg 83.7–117.8 °C against 43.3 °C for the free base; all amorphous after 2 weeks at 40 °C/75% RH, four liquefiedopen dishduong2022a R20
delamanid salt dispersions at 20% drug with HPMCASTg 100.4–117.0 °C against 86.7 °C; water uptake ≈10–13.6% against ≈8.2% at 95% RH37 °Cduong2022a R23, R22
praziquantel dispersions at 20% drugHPMC E5 LV amorphous at 23 weeks; HPMCAS-MF small crystalline peaks by 21 weeks40 °C/75% RHpolyzois2024 R7
Pitfalls and disagreements

Miscible dispersions were stable while phase-separated ones crystallized quickly [tian2016 C53]. Extrapolation of high-temperature growth data can overestimate stability [kestur2013a C7]. The class of the neat drug is only a first flag (see F17). The storage time reached by dispersions without crystals is not stated for lumefantrine, so the ranking is relative and no shelf life follows hiew2022a X9. Some dispersions crystallize only partly and then stop, which the authors do not fully understand [wegiel2013a C23, C43]. Peaks in stored CAP dispersions came from crystalline material in the polymer itself, not from the drug hiew2022a C11, R7. Small unexplained peaks appear in low-loading HPMCP traces after 64–76 weeks hiew2022a X10. The polyphenol dispersions differ in polymer content (30–80%) and in storage protocol from the lumefantrine ones, so the two sets are compared only in direction [wegiel2013a X3; hiew2022a X9]. In the resveratrol and curcumin tables, day values are first sampling times with unstated intervals and a 5–10% detection limit [wegiel2014 X10; wegiel2013b X16]. The mildest and the harshest conditions did not separate any polymer [wegiel2014 C23]. Long-term stability of the EC and HPMCP dispersions at 15 and 33% drug is inferred from 48-h concentrations; suspension and matrix stability were tested only at 50% drug, where the EC dispersion lost supersaturation after 12 h li2018 X8. The 30% indomethacin comparison is stated in the text only xie2017 R27. The praziquantel statement that both dispersions stayed stable for several months is not borne out by the peaks in the HPMCAS-MF sample polyzois2024 X1.

← Concepts and formulas

concept · as used in Dissolution

pKa

The pH at which half of an ionizable drug is protonated; two pH units above the pKa a weak base is almost fully un-ionized and two units below almost fully ionized, which set the pH range of the weak-base solubility studies indulkar2015 C16. New aspects (Miscibility and drug-polymer interactions): The acid dissociation constant is also used to classify the drugs of a polymer screen as acidic, weakly acidic or basic, and as a proxy of donor strength: a lower pKa means a stronger acid and a better hydrogen-bond donor [vaneerdenbrugh2010b M3, M4, M5, M6, M7, M8; rumondor2011 C30]. The values are computed, not measured. In the later papers the pKa decides whether a proton can move between drug and polymer: PSSA (−1.5) with the basic pKa of anthranilic acid (2.0), lidocaine (amine 7.8) and dibucaine (amine 9.8), and not PAA (4.5) or flufenamic acid (basic −2.1) [vaneerdenbrugh2011a R1, R2, R9, C22, C23]; lumefantrine (amine 8.73, cited) with enteric polymers of pKa 4.32–6.21 hiew2022a M1, R22. New aspect (Release mechanism and LoC): the pKa of the buffer species, relative to the surface and bulk pH, decides whether a buffer carries protons away from a dissolving enteric polymer. BIS-TRIS (pKa 6.5) and phosphate (7.2) bind protons at the lower surface pH and release them at the bulk pH, BIS-TRIS better because more of it is in the base form at a surface about 0.4 units below bulk; Tris (8.1) and TEA (10.2) are mostly protonated at both and cannot act as proton carriers, which slows HP-50 dissolution qi2022 C27. For HPMCAS-MF, pH 7.5 phosphate gave faster dissolution than pH 9.0 phosphate because the latter has a low buffer capacity bapat2023 C15. The polymer pKa values used were 4.2 for HP-50 and 4.92 or 5.0 for HPMCAS-MF, both cited qi2022 C23; bapat2023 M3. The 2025 grade paper titrated HPMCAS LF and HF, giving pKa 4.91 and 5.06 at the half-neutralization point against a cited 4.97 for MF bapat2025a R8, C11, M3, M4, M5; the 2024–2025 papers flag weak bases with pKa above about 5 as at risk of complexing HPMCAS at the gel pH bapat2024 C45.

Findings

C. Amorphous solubility and LLPS: F10, F23. Miscibility and drug-polymer interactions: F15, F17, F21, F24, F26. Physical stability: F13, F24. Release mechanism and LoC: F23, F32, F33.

Related concepts

sets ionization and pH-dependent solubility; indicates donor strength in hydrogen bonding; related to drug-polymer interactions, hydrogen-bond basicity, acid-base interaction and hydrogen-bond donor and acceptor groups. Of buffer species, sets buffer capacity at a given pH and the microenvironmental pH; of the polymer, sets the critical ionization for polymer dissolution.

Formulas

Henderson-Hasselbalch equation.

How it is measured or obtained

UV-metric titration at 37 °C in 0.15 M NaCl (atazanavir), or taken from the literature or predicted by software (the other drugs) indulkar2015 P2, M1, M3; almeidaesousa2015 M3. In the polymer screens, calculated with the ChemAxon plugins of MarvinSketch 5.2.0 from the structures [vaneerdenbrugh2010b P9]. Functional-group densities of the polymers (mmol/g of COOH, amide, amine) were calculated from the structures in the same way [vaneerdenbrugh2010b P10]. For the enteric polymers the pKa was measured by potentiometric base-to-acid titration, as the pH at 50% neutralization, with the carboxylic acid content between the two end points (HPMCAS 1.19 mmol/g, pKa 4.97; HPMCP 1.69, 4.32; CAP 2.94, 4.57; Eudragit L 100 4.48, 6.21), giving 99, >99, >99 and 80% ionization at pH 6.8 hiew2022a P17, R22. In the 20-system moisture study, calculated with MarvinSketch unless marked otherwise in the table [rumondor2011 P9]. In the release-mechanism papers: buffer pKa values calculated or stated (table in the HP-50 paper) qi2022 C27, X16; polymer pKa cited qi2022 C23; bapat2023 M3.

Values in the library
materialvalue or classconditionspaper ids
clotrimazole; atazanavir; nicardipine5.89 (cited); 4.52 (measured); 7.2 (cited)37 °Cindulkar2015 M1, M2, M3
ritonavir1.8 and 2.6citedilevbare2013a M1
loratadine; efavirenz5.0; 10.2citedilevbare2013a M3, M2
telapreviracid 11.8; base 0.31citedmosqueragiraldo2015 M1
CRH14.6 (base)method not printedalmeidaesousa2016 M1
ibuprofen; phenylbutazone; diclofenac4.35; 4.35; 4.03 (acids)citedalmeidaesousa2015 M1, M2, M4
pazopanib6.4 (strongest basic group)stated without a source; used for the 37 °C curvessugihara2018 M1, C9
flurbiprofen; flufenamic acid; chlorpropamide4.37; 3.88; 4.33 (acidic)computed[vaneerdenbrugh2010b M3, M4, M5]
chlorzoxazone9.39 (weakly acidic)computed[vaneerdenbrugh2010b M6]
bifonazole; lidocaine6.69; 7.75 (basic)computed[vaneerdenbrugh2010b M7, M8]
indoprofen against other carboxylic acids (other chapter)a somewhat weaker acid, with the smallest phase separationPVP dispersions with moisture[rumondor2011 C33]
PAA; PSSA; E100 amine4.5; −1.5; 8.5computed[vaneerdenbrugh2011a R2]
anthranilic acid; flufenamic acid (basic pKa)2.0; −2.1computed[vaneerdenbrugh2011a R1, R9]
HPMCAS, HPMCP, CAP, Eudragit L 1004.97, 4.32, 4.57, 6.21 (acid content 1.19, 1.69, 2.94, 4.48 mmol/g)titration, n = 2hiew2022a R22
lumefantrine (tertiary amine)8.73citedhiew2022a M1
indomethacin, ketoprofen, indoprofen in PVPpKa 4.5, 5.02, 5.8; resist, resist, separate slightly20-system table[rumondor2011 R15.a, R15.d, R15.e]
20 drug–polymer systemsOPLS-DA loading of pKa ≈ −0.35: lower pKa goes with no separationdiscriminant model[rumondor2011 R17, C40]
curcumin against E100pKa 10.51, 9.88, 8.38 against an average 8.4 for the basic monomeracid–base pairing[wegiel2014 M1, M5, C16]
HP-50 in BIS-TRIS, phosphate, Tris, TEA buffersbuffer pKa 6.5, 7.2, 8.1, 10.2; ≈44.8, 28.4, 6.6, 1.8% HP-50 dissolved at 60 min50 mM, pH 6.8qi2022 R2, C27
HP-50; HPMCAS-MFpKa 4.2; 4.92 or 5.0 (cited)qi2022 C23; bapat2023 M3
HPMCAS LF, MF, HF4.91, 4.97 (cited), 5.06back-titration, half-neutralizationbapat2025a M3, M4, M5
bedaquiline8.5 (measured)SI, not suppliedkaur2025 M1
Pitfalls and disagreements

Several pKa values are predicted, not measured (tolnaftate, sorafenib, griseofulvin) almeidaesousa2015 M3, M5, M6. The pKa values of the polymer screens are calculated and rest on one program [vaneerdenbrugh2010b P9]. Flufenamic acid is treated as purely acidic because its aniline N–H is in an intramolecular bond [vaneerdenbrugh2010b C12]. The acid–base reading of the PAA/PSSA reversal is the authors' hypothesis; interactions in the films were not measured [vaneerdenbrugh2010b C33]. The pKa values of the moisture discriminant model are calculated and correlate with donor type and carbonyl shift, so their separate weight is not established [rumondor2011 P9, X10]. The proton-carrier argument uses calculated buffer pKa values and a cited surface-to-bulk gradient; surface pH was not measured in the HP-50 paper qi2022 X16. The pKa of HPMCAS-MF is used as 4.92 or 5.0 (cited) in the 2023 HPMCAS dissolution paper, against 4.97 measured by titration in the lumefantrine study and cited in the 2025 grade paper (synthesis: comparison of the values on this page) bapat2023 M3; hiew2022a R22; bapat2025a M4.

← Concepts and formulas

concept · as used in Dissolution

plasticization by water

The lowering of the glass transition temperature of an amorphous drug by absorbed water, taken in these papers as about 10 °C per 1% water ilevbare2013a C23, E15; indulkar2015 C39. A water-saturated drug-rich phase therefore has a wet Tg far below that of the dry amorphous drug, and its state at the test temperature (supercooled liquid or glass) follows from it (F2). New aspect (ASD process): in the coating study of four drug–polymer systems, water sorbed at the storage humidity lowers the glass transition of the powder, and the wet Tg onset minus the storage temperature (Tg − T, negative when stored above Tg) is the number compared with crystallization onset [moseson2022a P6, E2, R12]. Nucleation and growth speed up with humidity because sorbed water raises mobility and lowers the wet Tg, so a coating that works on the surface cannot rescue a powder whose bulk is mobile [moseson2022a C41, C25]. In dissolution, hydration lowers the Tg of a drug-rich bicalutamide layer, and the authors list mobility above the wet Tg among the reasons why not every ASD is susceptible to matrix crystallization [moseson2022b C63]. For hydrating posaconazole–HPMCAS the gastric stage lets crystals grow inside the wetted matrix after water uptake and plasticization (the authors' reading) shah2024 C45. New aspect (Physical stability): in drug–polymer dispersions water erases the Tg gain of a high-Tg polymer: at 75–76% RH felodipine and nifedipine dispersions with up to 25% PVP fell below the Tg of the dry drug [konno2008 C16; marsac2008a C17]. Plasticization is "directly related to the hygroscopicity of polymer", yet per gram of water it lowers the Tg of the pure drug most [konno2008 C20; marsac2008a C19]. New aspect (Supersaturation from ASD dissolution): the ASD dissolution papers use it in two places: to explain why wetted amorphous felodipine crystallizes faster at 37 than at 25 °C (dry Tg about 45 °C, just below 35 °C at 75% RH, cited) alonzo2010 M1, C34, and to read the low Tg of an isolated ritonavir drug-rich phase as a ritonavir-rich phase holding a few percent of water ilevbare2013d C8. New aspect (Release mechanism and LoC): the wet Tg of the drug-rich phase decides whether nanodroplets are glassy or liquid at the test temperature. Indulkar and co-workers (2017) estimate that water-saturated amorphous nifedipine droplets have a Tg near 17 °C (dry 42 °C, 2.5% water), which makes drug exchange between droplets and solution slow at 5 °C, the premise of their isotope test indulkar2017b C16, M1, C13. Ritonavir, with a wet Tg around 0 °C, is a supercooled liquid under release conditions que2019 R28, C49; indulkar2019a M1. For indomethacin the relevant wet Tg is "plausibly" that of the drug-enriched surface (a 70% dispersion with about 6% water, onset 18 °C) rather than that of the neat drug (estimated 29 °C) saboo2020 C52, R30, M1; by the same 10 °C per 1% rule every lumefantrine dispersion's wet Tg would lie below 37 °C hiew2022b C44.

Findings

Amorphous solubility and LLPS: F2. ASD process: F44, F38, F41. Physical stability: F5, F6, F9, F12, F33, F34. Supersaturation from ASD dissolution: F1, F9. Release mechanism and LoC: F5, F9, F18.

Related concepts

lowers the glass transition temperature; measured with water sorption; decides glass-liquid phase separation against LLPS; related to supercooled liquid. Raises surface molecular mobility; lowers the Tg that decides surface crystallization; sets how long an atomic layer coating protects a powder. Special case of plasticization; set by hygroscopicity; raises molecular mobility; related to matrix crystallization, drug-rich phase and moisture-induced crystallization. Gives the wet glass transition temperature.

Formulas

water plasticization rule of thumb, Tg − T, Gordon-Taylor equation.

How it is measured or obtained

DSC of the isolated drug-rich phase or of amorphous drug stored at high humidity, with water from gravimetric sorption or from drying the pellet ilevbare2013a P8, P9, P15; mosqueragiraldo2015 P4, P5; almeidaesousa2015 P8. For stored ASD powders the wet Tg onset was read in hermetically sealed DSC pans after 24 h at the storage humidity, 5 °C/min, triplicate preparations [moseson2022a P6]. The Tg of hydrated bicalutamide could not be determined moseson2021 R27, X8. In the felodipine and nifedipine moisture papers, DSC of bulk samples equilibrated at each RH and sealed [konno2008 P6; marsac2008a P7], reported as ΔTg dry minus 75% RH [konno2008 R9]. In the ASD dissolution papers: by DSC of the phase isolated by ultracentrifugation ilevbare2013d P9; for felodipine the humid Tg is cited, not measured in the medium alonzo2010 C34. In the release-mechanism papers: dry Tg by DSC, water content extrapolated from a 25 °C sorption profile to 100% RH, and a rule of about 10 °C Tg depression per 1% water indulkar2017b P3, P4, E6. DSC of a 70% dispersion after 4 h at 100% RH saboo2020 P23; sorption at 37 °C extrapolated to 100% RH with the rule yang2021 P9.

Values in the library
materialvalue or classconditionspaper ids
ritonavirTg 50.4 → 0.4 °C with 4.03–5.15% waterisolated phase, 10–50 °Cilevbare2013a R5, R6
clotrimazole; atazanavirTg 28 → about 14 °C (1.4% water); 104 → about 51 °C (5.2%)precipitates, 37 °Cindulkar2015 R22, M1, M2
telaprevirTg 103 → 52 °C; 4.31% water at 95% RHpellet, 37 °Cmosqueragiraldo2015 R2, M1
sorafenib; griseofulvinTg 88.2 → 49 °C; 90.8 → 88 °C at 97% RHamorphous drugalmeidaesousa2015 M5, M6, R9
erlotinib–HPMCAS 60% DLwet Tg − T about −8.8 °C (75% RH) and −2.3 ± 1.1 °C (43% RH)24 h at RH, T = 40 °C[moseson2022a R12]
erlotinib–PVPVA 50% DL−0.5 ± 1.2 °C43% RH[moseson2022a R12]
naproxen–HPMCAS 10% DL; lumefantrine–PVPVA 40% DLabout +11.3 °C (75% RH); +10.7, +14.3, +11.3 and +11.4 °C (43% and 31% RH)same[moseson2022a R12]
rule of thumb for stabilitymore than 50 °C between storage temperature and Tg (cited); the authors state the benefit of the coating holds at about 0 to +15 °C[moseson2022a E3, C45, R17]
felodipine with 25% PVP, HPMCAS, HPMCTg 54.9 → 31.1, 44.2 → 35.6, 43.1 → 34.4 °C0 → 75% RH[konno2008 R5]
felodipine dispersions ≤ 25% polymerTg ≈30–35 °C after 75% RH, below dry felodipine ≈43 °C25 °C[konno2008 R7, C16]
nifedipine pure; 25% PVP≈43 → 26 °C; ≈54 → 29 °C0 → 76% RH[marsac2008a R6]
amorphous felodipine (cited)Tg ≈45.7 → 29.6 °C, smooth0 → 94% RH[rumondor2010 R10]
pimozide–PVP 50:50wet Tgs −21 and 44 °C94% RH[rumondor2009c R17]
ketoprofen–PVP 70:30wet Tg −23 °C94% RH[rumondor2009c R25]
celecoxib 6:4 dispersionsTg 64–103 → 22–42.1 °C after 3 days at 94% RHDSC[xie2016b R17, R20]
tacrolimus; tacrolimus–HPMC 1:163.6 → 51.4 °C; 77.2 → 49.0 °C after 3 days at 75% RHDSCtrasi2017 R15
lumefantrine dispersions precipitated into water4–6% water (HPMCP, HPMCAS), 9% (CAP); Tg 45–112 °CTGA; DSC[bhujbal2021 R10]
felodipine (cited)Tg about 45 °C dry, just below 35 °C after 75% RHstorage dataalonzo2010 M1
ritonavir drug-rich phase from a PVP dispersionTg inflection 1.05 °C against 50 °C for the amorphous drugwater, 37 °C, DSC at 20 °C/minilevbare2013d R2, M1
indomethacin (cited)Tg falls rapidly with water content, as for felodipineliteraturealonzo2010 R24
nifedipinedry Tg 42 °C; wet Tg approximately 17 °C (estimated)2.5% water (estimated)indulkar2017b M1, C16
ritonavirTg 50 °C; wet Tg around 0 °C (cited)release conditionsque2019 R28
indomethacin; indomethacin–PVPVA 70%wet Tg 29 °C (estimated); onset 62.64 → 18.48 °C with ≈6% water37 °C, 100% RHsaboo2020 M1, R30
loratadine, miconazole, danazol, elbasvirwet Tg 13.8 (DSC), −4.7, 73.3, 129.1 °C (rule)37 °Cyang2021 M1, M2, M3, M4
atazanavirdry 105 °C, wet 55 °Ccitedcorreasoto2022b M1
Pitfalls and disagreements

The griseofulvin Tg falls only 2.8 °C with an estimated 2.7% water, against 39 °C for sorafenib with 1.8%, and storage time and water content are not stated almeidaesousa2015 X11. The water content of the telaprevir pellet was not measured mosqueragiraldo2015 X3. For the coated powders the wet Tg values are not printed, only Tg − T bars, and the definition in words is the reverse of the sign used [moseson2022a R12, X24, E2]. Uncoated powders failed in about 1–2 weeks across the whole range of Tg − T, so Tg − T orders the coated failures only in part [moseson2022a X15]. The 0 to +15 °C statement applies to coated powders only [moseson2022a C45, R11]. The rule of 10 °C per 1% water given in the Definition fits the pure drugs but not the 25% polymer dispersions of the felodipine study, which drop about 5 °C per 1% (synthesis: 23.7 °C with 4.68% water [konno2008 R6]). Plasticization did not by itself cause phase separation or rank nucleation [rumondor2009c C38; konno2008 C26]. Plasticization by water did not rank celecoxib dispersions at 94% RH: four Tgs within about 5 °C, very different stability [xie2016b C46]. The water content of the ritonavir phase was not measured ilevbare2013d C8. Plasticization does not rank crystallization: indomethacin, with a similar Tg drop, crystallized much more slowly than felodipine during dissolution alonzo2010 C42. The 17 °C nifedipine value is an estimate from a rule taken from indomethacin; no Tg of water-saturated nifedipine was measured indulkar2017b X8. The 70% indomethacin dispersion is a model of the surface layer saboo2020 X16, and most wet Tgs are rule estimates yang2021 P9.

← Concepts and formulas

concept · as used in Dissolution

plasticization

Lowering of the glass transition temperature of a mixture by a component with a lower Tg; in the library water is the usual plasticizer of drugs, polymers and dispersions, and drugs, surfactants and plasticizers lower the Tg of polymers [konno2008 C2, C14; marsac2008a C1; correasoto2022b C39]. The opposite, a higher-Tg component raising the Tg, is antiplasticization [konno2008 C16]. New aspect (Supersaturation from ASD dissolution): plasticization by water acts during dissolution as well as during storage. For delamanid salts, four of eight liquefied at 40 °C/75% RH, which the authors attribute "presumably" to plasticization by water, and the salts took up 5.8–21.1% water against far less for the free base duong2022a R20, C27. In the undissolved matrix of an enteric dispersion in acid, absorbed water lowers the Tg and raises molecular mobility, which the authors give as the reason why the drug can crystallize there although the medium is subsaturated; water content and Tg were not measured in that state nguyen2023c C43. In hot-melt extrusion the drug itself plasticizes the polymer, which the authors use to justify extruding a drug at the polymer's Tg ("would") alvarenga2025 C46. New aspect (Release mechanism and LoC): in the release papers of 2021–2022 plasticization of the dispersion by the drug or by an added surfactant is used to explain faster polymer release. Clopidogrel (Tg −9 °C) lowered the dispersion Tg, and the faster PVPVA release from its binary dispersions is called a plasticization effect, as for PMMA with 20 wt% PEO, whose dissolution rate rose by a factor of two (cited) correasoto2022a C48, R30. TPGS lowered the Tg of 30% felodipine–PVPVA dispersions and "could" raise the limit of congruency through higher molecular mobility saboo2021 R5, C43. Surfactants and VP lowered the Tg of 10% atazanavir–PVPVA dispersions, and improved release is "due, at least in part," to plasticization raising polymer-chain mobility correasoto2022b R20, C40. In the other direction, more low-polarity drug "would be anticipated" to reduce water penetration and water plasticization and so lower the polymer rate yang2021 C32, and a drug–polymer interaction that persists in water is proposed to do the same que2021 C44. Surfactants can also promote crystallization by plasticizing the matrix (cited), and Tween 80 and TPGS "could possibly" plasticize ritonavir droplets so that they coalesce indulkar2022 C40, C48; except for SDS every surfactant lowered the single Tg of 30:70 ritonavir–PVPVA (midpoints 70.90–77.51 against 82.24 °C) indulkar2022 R18. Built into PVPVA dispersions of high-Tg drugs, plasticizers lowered the Tg and raised release and the limit; the authors suggest increased polymer chain mobility, that is a faster disentanglement rate, as one mechanism correasoto2023 C30, C39. Faster initial water entry from drug plasticization, together with phase separation moving most water into the hydrophilic phase, is a "possible explanation" for polymer release rising faster than water penetration in MePHPH–PVPVA up to 20% deac2023a C51, C50. The 2023 surfactant study attributes barrier disruption by non-ionic surfactants to plasticization: Span 20 and Span 85 lowered the Tg of amorphous ritonavir from 46.8 °C to 7.7–27.8 °C and, partitioning into the drug-rich phase, are taken to soften the drug-rich layer so that flow removes it yang2023 R22, C11, C18, C35. The 2025 high-loading particle study warns that SDS, also a plasticizer, may predispose amorphous formulations to phase separation and recrystallization hiew2025 C58.

Findings

Physical stability: F6, F9, F22, F28, F32. Supersaturation from ASD dissolution: F23, F24. Release mechanism and LoC: F15, F18, F21, F26, F31.

Related concepts

special case plasticization by water; contrasts with antiplasticization; measured by glass transition temperature; raises molecular mobility; tested by Tg-scaled crystal growth rate; lowers physical stability and matrix crystallization; limits in situ salt formation. Speeds polymer chain disentanglement.

Formulas

Gordon-Taylor equation gives the ideal-mixing Tg that plasticization lowers.

How it is measured or obtained

DSC of samples equilibrated at a given RH and sealed hermetically, onset or midpoint Tg [konno2008 P6; marsac2008a P7]; the drop in Tg between the dry state and storage at 75% RH, ΔTg [konno2008 R9]. Outside the subcategory, Tg of drug–polymer–surfactant or plasticizer blends by DSC [correasoto2023 R17, C30; nguyen2023a R13]. In the ASD dissolution papers: water sorption at rising relative humidity with DSC of the same materials for Tg, and open-dish storage at 40 °C/75% RH with visual inspection and PXRD duong2022a P12, P10, P13; in extrusion, the drug Tg and the polymer Tg set the processing window alvarenga2025 M1, M2, M3, E2. In the release-mechanism papers: DSC of dispersions with and without the additive saboo2021 R5; correasoto2022b R13.

Values in the library
materialvalue or classconditionspaper ids
felodipine with 25% PVP, HPMCAS, HPMCTg 54.9 → 31.1, 44.2 → 35.6, 43.1 → 34.4 °C0 → 75% RH, 25 °C[konno2008 R5]
felodipine–PVP 0–100%ΔTg ≈15 °C (7% PVP) to ≈158 °C (pure PVP)dry minus 75% RH[konno2008 R9]
25% polymer dispersionsTg drop ≈13.3 °C at ≈1.1% water (PVP) vs ≈6.2 °C (HPMCAS)25 °C[konno2008 R6, C14]
nifedipine, pure and 25% PVP≈43 → 31 °C with ≈1.15 g/100 g water; ≈54 → 43 °C with ≈2 g/100 g25 °C[marsac2008a R7, C19]
pimozide–PVP 50:50two Tgs −21 and 44 °C wet against one at 94 °C dry94% RH[rumondor2009c R17]
PTM–HPMCAS–TPGS (outside)Tg ≈79 → 63 °C with TPGS at 20% loadingDSC[nguyen2023a R13, C22]
atazanavir and ledipasvir ASDs with plasticizers (outside)lower Tg than the binary ASDDSCcorreasoto2023 C30
celecoxib with 10% TPGS or sucrose palmitateTg 55.34 → 44.81 and 44.46 °C; growth fasterDSC[mosqueragiraldo2014 R5, C16]
pretomanid–HPMCAS with TPGS (other chapter)Tg falls as TPGS risesDSC[nguyen2023a R13, C22]
ritonavir–PVPVA with Span 20 or Span 85Spans in the drug-rich phase, read as plasticizing it and speeding separation ("likely")O-PTIR, NMR, confocal[yang2022b C58, X13]
griseofulvin, DPB, celecoxib with 5% PHBTg −5 to −12 °C; growth up to ≈10-fold fasterDSC; melt growth[sato2016 R7, R11, X6]
delamanid sulfonate salts, neatwater 5.8–7.1% (aromatic), 8.1–11.6% (camsylate, edisylate), 16.2–21.1% (esylate, mesylate); four liquefied95% RH; 2 weeks at 40 °C/75% RHduong2022a R20
delamanid edisylate 1:1 with excess acid59% water uptake and Tg 53.9 °C against 11.6% and 117.8 °C for the 2:1 salt95% RHduong2022a R21
delamanid salt dispersions at 20% drug with HPMCASwater ≈10–13.6% against ≈8.2% for the free-base dispersion; Tg 100.4–117.0 against 86.7 °C95% RHduong2022a R22, R23
delamanid free-base dispersions, 0 to 20% drugTg 121.0 → 86.7 °C (HPMCAS) and 120.1 → 82.0 °C (HPMCP); water at 95% RH ≈10.8–11.6% → ≈7.9–8.2%DSC, sorptionduong2022a R9, R10
praziquantel, racemate and R-enantiomerTg about 37 and 34 °C, used to place the extrusion temperatures at 150 and 120 °CDSCalvarenga2025 M2, M1
felodipine–PVPVA 30% with 0, 2, 5, 10% TPGSTg 89.2, 86.0, 80.8, 71.1 °C (felodipine 44.7, PVPVA 105.4 °C)DSC, drysaboo2021 R5
atazanavir–PVPVA 10% with SDS, CTAB, TPGS, Tween 80, Span 20, Span 80, Span 85, VPTg lowered by 16, 9, 14, 14, 11, 13, 7, 16 °C from the binaryDSC, drycorreasoto2022b R20
clopidogrel–PVPVA 40–60%PVPVA ≈4.1–6.7 against ≈2.6–2.7 mg/min/cm² for neat PVPVAcompacts, 37 °Ccorreasoto2022a R18, C48
loratadine–HPMCAS 5%HPMCAS released faster than from neat HPMCAS, "feasible" plasticization by a low-Tg drugcompactsyang2021 C31, R18
ritonavir–PVPVA 30:70 with 5 parts Tween 80, TPGS, Span 20, Span 85, SDSTg midpoint 70.90, 72.84, 73.24, 77.51, 84.93 °C against 82.24 °CDSC, dryindulkar2022 R18
8:1 atazanavir and ledipasvir glasses with nine plasticizersTg lowered by 30.4–43.3 and 47.6–53.1 °Cmodulated DSCcorreasoto2023 R17, R18
ledipasvir–PVPVA 10% with 5 and 10 g TEACTg 99.1 → 85.8 °C; release 20 → 94% by 90 minDSC; compacts, pH 6.8correasoto2023 R9
amorphous ritonavir with Span 20 (80–20, 60–40)onset Tg 14.8, 7.7 °C (46.8 °C neat)DSCyang2023 R22
amorphous ritonavir with Span 85 (80–20, 60–40)27.8, 12.7 °CDSCyang2023 R22

Evidence table: plasticization.

Pitfalls and disagreements

Two framings coexist: water is the more efficient plasticizer of PVP dispersions at equal water content (compared with cellulose dispersions) and the more efficient plasticizer of the drug alone per gram of water (compared with PVP dispersions); both hold, for different comparisons [konno2008 C14; marsac2008a C19]. A rule of thumb in the library puts the Tg drop at about 10 °C per 1% water yang2021 E3, which fits pure drugs but overestimates the drop of the 25% polymer dispersions, about 5 °C per 1% (synthesis: 23.7 °C with 4.68% water for 25% PVP [konno2008 R6]). Plasticization alone does not cause moisture-induced phase separation [rumondor2009c C38]. Lower plasticization by water is offered as an alternative to the thermodynamic reading for HPMCAS dispersions rumondor2010c C32, X12. The Span plasticization rests on Tgs given only in the supplement [yang2022b X13]. Liquefaction was reported for four salts while the text and the table disagree on which, and the photograph of one looks unliquefied duong2022a X1, X11. The water content and Tg of the wetted matrix in acid, on which the mobility argument rests, were not measured nguyen2023c C43. For the extrusion window no Tg of a drug–polymer blend was measured alvarenga2025 C46. The dispersion Tg of the clopidogrel study is in the SI and not in the main text correasoto2022a R26, and the loratadine–HPMCAS dispersion Tg was not measured yang2021 C31. Among the atazanavir additives the Tg depression and the release enhancement did not rank together (TPGS lowered the Tg by 14 °C and raised release only 4-fold, Span 80 by 13 °C and 35-fold) correasoto2022b R20. The Tg of the drug-rich layer formed in situ was not measured; plasticization is inferred from drug–Span mixtures yang2023 X17.

← Concepts and formulas

concept · as used in Dissolution

polymer adsorption to drug-rich droplets

The accumulation of a dissolved polymer at the interface of the drug-rich droplets of a phase-separated solution, where it is thought to reduce droplet coalescence and to disturb heterogeneous nucleation at the droplet–water interface ("likely"); with the cellulosic polymers it is accompanied by some polymer mixing into the droplets jackson2014 C33, C50, C53, C48. The zeta potential of danazol droplets moved with the charge of the polymer over 1–1000 µg/mL (PVP −7.1 to −3.5, HPMC −2.9 to −2.2, HPMC-AS −8.9 to −18.6 mV against −8.1), and bile salts made telaprevir droplets about −40 to −53 mV against −9.2 mV jackson2016 R18; lu2017 R8.

Findings

F15, F32.

Related concepts

part of liquid-liquid phase separation; related to droplet coalescence, zeta potential and polymer adsorption.

Formulas

none.

How it is measured or obtained

Indirectly: droplet size by DLS over hours, zeta potential of the droplets, and the lowered onset of phase separation; preliminary NMR gave the polymer content of the droplets (not shown) jackson2014 R22, R23, R5, R26.

Values in the library
materialvalue or classconditionspaper ids
danazol droplets aloneabout 490 nm at once, about 9800 nm after 1 h25 °Cjackson2014 R22
danazol droplets with HPMC; HPMC-ASabout 305–345 nm up to 2 h; about 230–250 nm up to 4 h10 µg/mL polymerjackson2014 R22
zeta potential: alone; PVP; HPMC; HPMC-AS−8.1; −5.3; −2.3; −13.7 mV25 °Cjackson2014 R23
polymer in the dropletsaround 10–20% for HPMC, below about 10% for PVP, none for HPMC-ASpreliminary NMRjackson2014 R26
ritonavir nanodroplets (ASD dissolution chapter)charge repulsion between polymers adsorbed at the ritonavir–water interface "likely" stabilizes against coalescence37 °Cilevbare2013d C38
telaprevir droplets, 1.86 mM six bile saltszeta about −40 (SGC) to −53 mV (STCDC)180 µg/mL, pH 6.5lu2017 R8
Pitfalls and disagreements

The NMR is preliminary and not shown, with no value for HPMC-AS; the site of nucleation was not measured jackson2014 X15. The coalescence claim has no droplet size in the first minutes for danazol alone jackson2014 X6. Zeta potential was measured at 180 µg/mL, not in the induction-time solutions lu2017 X6.

← Concepts and formulas

concept · as used in Dissolution

polymer adsorption

The attachment of a dissolved polymer to a surface, here the drug crystal (and, for danazol, the droplet interface). Every explanation of crystal growth inhibition in these papers assumes that the polymer must adsorb on the crystal to act, and "there is a general consensus" that it must (Mullin 2001, outside the library) ilevbare2012c C3, C35; ilevbare2013b C47. Adsorption can be physical (van der Waals, electrostatic, usually reversible) or chemical, and is driven by hydrophobic interaction, electrostatic attraction and hydrogen bonding ilevbare2012c C4. On crystal surfaces (formerly the page "polymer adsorption on crystal surfaces", from Crystallization from solution): the binding of a dissolved polymer to the faces of a growing drug crystal, which blocks growth sites and slows or shapes growth; it is usually face-selective, because molecular crystals are anisotropic, and changes habit when it slows the fast faces ilevbare2012c C3, C5, R18. It is the central assumed mechanism of crystal growth inhibition: the polymer occupies growth sites as a mechanical barrier and pins advancing steps alonzo2012 C9; ilevbare2012c R19. HPMCAS-LF was seen by AFM on three faces of felodipine, (1 1 −1), (1 −2 −2) and (1 −1 1), with no visible difference in density, taken as nonspecific adsorption, and AFM-IR identified the adsorbed material on a dried film schram2015 R23, R25, R20, R21.

Findings

Crystallization from solution: F7, F8, F10, F11, F12, F23, F24, F27, F36, F38, F42, F44.

Related concepts

related to surface coverage, step pinning, polymer conformation, crystal habit and BFDH morphology prediction; mechanism of crystal growth inhibition.

Formulas

adsorbed amount by solution depletion, Langmuir-Freundlich isotherm, Kubota-Mullin model, Cabrera-Vermilyea step pinning.

How it is measured or obtained

By depletion: seeds equilibrated with polymer solution for 16–24 h, the amount adsorbed per area from the polymer lost from the supernatant, C_a = (C_i - C_f)\,V/(m \times A), with the polymer assayed by the phenol–sulfuric acid method at 490 nm, or by surface tension for HPMC ilevbare2012b P9, E10; alonzo2012 P6. In the ritonavir screen and the 2013 growth paper adsorption was not measured ilevbare2012c C35; ilevbare2013b X14. Adsorption on crystal faces is also read indirectly by growth-rate ratios against polymer concentration, by crystal habit and PXRD of the grown crystals, and by FTIR shifts of the drug bands after exposure to polymer alonzo2012 R8; ilevbare2012c R4, R6; ilevbare2013b R12.

Values in the library
materialvalue or classconditionspaper ids
HPMC on felodipine seedsabout 60–167 µg/mL/m² up to 0.38 µg/mL equilibrium; 285–534 at 0.62–1.12 µg/mLsurface tension, 16–24 halonzo2012 R6
CAP Adp 0.85 on ritonavir seedsplateau about 41 mg/m² (pH 3.8); about 27 mg/m² (pH 6.8)depletion, 4.0 mg seeds in 20 mLilevbare2012b R9, R10
PVPVA on indomethacin crystalsglobule spacing 160 ± 50 nm (5 µg/mL); 70 ± 20 nm (50 µg/mL)AFMmoseson2020a R12
HPMCAS on paclitaxel dendritesadsorption-site spacing about 10–16.8 nmSEM finger widthque2018 R12
HPMCAS-LF pre-adsorbed on felodipine seedsovergrown by fresh drug in polymer-free solution (growth ratio about 1.8, then 1.08 in a second run)S 4, 25 °Cschram2016 R2, R3
A5a, A5b, ECA, ECB, ECD on amorphous atazanavirA5a even, no globules; ECA, ECB small even globules; ECD larger; A5b large uneven globules5 µg/mL, 1 h, tapping-mode AFM in buffermosqueragiraldo2018a R4
HPMCAS L, M, H on posaconazole dropletspolymer on every droplet surface from the ζ-potential ("is expected to delay surface crystallization")pH 6.5shah2025 R15, C43, C44
HPMC, felodipine seedsinhibition plateau (ratio about 0.55) where fitted coverage reaches about 1 (1 µg/mL)S 8, 25 °Calonzo2012 R7, R8
Pn-IPAAmd, ritonaviraspect ratio 4.4 against 8.8; (200) PXRD peak about 245 against 150 countsS 7.6, 37 °Cilevbare2012c R4, R6
PVPVA, celecoxib and efavirenz seedsN–H bands 3331 → 3321, 3225 → 3217; 3316 → 3308 cm⁻¹overnight in 100 µg/mLilevbare2013b R12
HPMCAS on paclitaxel seedspolymer slows but does not block growth at S 88seeded ASD dissolutionque2018 C30, C38
HPMCAS, earlier felodipine work"may adsorb at the crystal surface and block growth sites"dilute supersaturated solution[rumondor2010 C38]
felodipine, HPMCAS-LF, pH 3adsorption on three faces exposing methyl/oxygen, chlorine/methyl and methyl/amine/oxygen groupsAFM in liquidschram2015 R23, R25
HPMC-606, HPMCAS-MF on atazanavir with SDSstrong adsorption keeps SDS off the crystal ("we can speculate"), not measured1 mg/mL polymer, 0.1 mg/mL SDSindulkar2019b C43
bile salts on atazanavir needlesblocking of the needle sides "hypothesized" from aspect ratios 41–83 against 12.4biorelevant mediaelkhabaz2021 C47, R21
Pitfalls and disagreements

Adsorption by depletion has no crystal-free control, so loss by aggregation or on vessel walls would count as adsorption ilevbare2012b X15. The amount adsorbed did not predict the effect: more adsorbed at pH 3.8 and less inhibition ilevbare2012b R9, R7. Maximal adsorption did not stop growth at S 7.6 with 100 µg/mL polymer ilevbare2012b R17. Isotherm fits missed adsorption at low concentration alonzo2012 C21. The adsorbed amount was not measured in either felodipine–HPMCAS paper schram2015 X7. The AFM coverage ranking is qualitative, one image per polymer mosqueragiraldo2018a X16. The face-specific binding of Pn-IPAAmd rests on means of 50 crystals with overlapping spreads and PXRD relative intensities, with no adsorption or face-specific rate measured ilevbare2012c X12. The BFDH fast faces are assumed to be the fast faces of the real crystals ilevbare2012c C45. The PVPVA hydrogen bond is proposed from N–H shifts alone ilevbare2013b X13. Nonspecific adsorption is a visual judgement and the (1 −1 1) region shows streaks schram2015 X8. Face-selective adsorption is the stated general case for ritonavir ilevbare2012c C5, whereas HPMCAS-LF on felodipine showed no visible difference in density between three faces schram2015 R23, R25; neither paper measured face-specific adsorbed amounts (synthesis: contrast between papers).

← Concepts and formulas

concept · as used in Dissolution

polymer chain disentanglement

Evidence table: polymer chain disentanglement. Content from the release-mechanism chapter (2020–2025), with rows from the Miscibility and drug-polymer interactions and ASD process chapters.

The step in which polymer chains leave the swollen, plasticized gel layer for the medium. A glassy polymer dissolves by solvent ingress, swelling, plasticization and gel-layer formation, chain disentanglement by reptation over a characteristic time and diffusion of the free chains; for high-molecular-weight neutral polymers such as PVPVA under stirring, solvent ingress or disentanglement is typically rate-limiting (cited) correasoto2022b C33. Polymer dissolution as a whole is controlled by water diffusion into the matrix, chain disentanglement from the plasticized gel and chain diffusion in the boundary layer; a polymer with Tg above the test temperature must take up a critical amount of solvent before its chains can disentangle, and the further the temperature lies below Tg, the more solvent is needed hiew2022b C38, C39, E1. Que and co-workers (2021) add from the literature that solvent quality (Flory–Huggins χ) matters, and that neat PVPVA at high water activity has its Tg below room temperature and gels and dissolves rapidly que2021 C42. Disentanglement is faster above Tg; below Tg the gel layer thins and dissolution changes from disentanglement to cracking (cited) saboo2020 C54. Enteric polymers must also ionize, which increases hydration and chain mobility and enables reptative disentanglement qi2022 C10; the higher hydration of HP-50 salts "likely" offsets the effect of a lipophilic drug on the water fraction of the gel qi2022 C40. A neat PVPVA compact first swelled and then shrank, read as chains that had not yet had time to disentangle and later disentangled and dissolved yang2022a C32, R9. Correa Soto and co-workers (2023) cite the Devotta free-volume model, in which the maximum chain mobility rises with the fractional free volume of the gel, and take the disengagement rate as proportional to chain mobility correasoto2023 E2, E3, C39. In low-loading MePHPH gels about as much water per polymer was needed to disentangle as in neat PVPVA, as expected if the hydrophilic phase controls gel erosion, and the congruent release rate is proposed to be controlled by water penetration and by disentanglement at the gel/solution surface deac2023a C52, C73. The 2024 phase-diagram paper takes the gel–solution boundary as the polymer concentration at which chains disentangle, which a strongly interacting drug such as phenolphthalein "may impact" deac2024b C39; below the limit droplets leave when the chains disentangle, above it a continuous drug-rich phase cannot deac2024b C47.

Findings

Release mechanism and LoC: F15, F18, F22, F23, F24, F25, F26, F29, F30.

Related concepts

takes place in the gel layer; needs plasticization by water below the wet glass transition temperature; sets the rate of polymer-controlled release; faster with plasticization by the drug or a surfactant; needs chains above the critical entanglement molecular weight to be entangled in the first place.

Formulas

critical polymer volume fraction for glassy polymer dissolution; the disentanglement rate expression above is named and printed only by Hiew and Taylor (2022) hiew2022b E2. free-volume chain mobility (Devotta model).

How it is measured or obtained

Not measured directly in the library. It is inferred from polymer release rates of compacts saboo2020 C55; correasoto2022b C40 and estimated through the critical polymer volume fraction and the Narasimhan–Peppas disentanglement rate k_d = B/(1 - v_p)^{1.9} hiew2022b E1, E2.

Values in the library
materialvalue or classconditionspaper ids
PVPVA (Tg 102.9 °C, density 1.19 g/cm3)critical polymer volume fraction 0.89, so at least 11% water to start disentangling37 °C, estimatedhiew2022b R21
lumefantrine salt–PVPVA dispersions35–55% water at 95% RH, more at lower loading40 °Chiew2022b R5
lumefantrine–PVPVA 5–35%; 40–50% (Miscibility chapter)PVPVA ≈4.49–4.91 against 4.58 neat; 0.21–0.004 mg/min/cm²pH 6.8, 37 °Chiew2022a R13, C59
ritonavir–PVPVA tablets (ASD process chapter)discrete drug-rich nanodroplets in the gel layer move into solution as the polymer disentanglesuncoated tablets, 37 °Cbenson2025 C28
Pitfalls and disagreements

The papers propose but do not measure how the drug changes disentanglement: a drug–polymer interaction that persists in water is proposed to occupy polymer solvation sites and so slow plasticization and disentanglement que2021 C44, interaction of the hydrophobic drug with the polymer "is expected to" retard chain hydration hiew2022a C49, and above a critical loading dilution by the drug "likely" prevents enough water uptake for disentanglement hiew2022a C59. A lower Tg from TPGS "should theoretically" let disentanglement start with less water saboo2021 C43. With 10 °C per 1% water, the wet Tg of every lumefantrine dispersion should lie below 37 °C, so the authors find release "difficult to rationalize" by wet Tg and the disentanglement model alone hiew2022b C44. PVPVA dissolves when a critical water concentration is reached at the gel–solution interface, at a steady state between water penetration and disentanglement benson2025 C61. For HPMCAS-MF (about 18 kDa, below the critical values estimated for other polysaccharides) the authors judge molecular entanglement "unlikely" and dissolution diffusion- rather than disentanglement-controlled, since the rate stayed linear in the square root of rotation speed with no plateau bapat2023 C45, C30, R27.

← Concepts and formulas

concept · as used in Dissolution

polymer chain stiffness

How rigid a polymer backbone is

The authors attribute the advantage of cellulose derivatives over most synthetic polymers of similar hydrophobicity "most likely" to their semirigid, bulky backbones, which adsorb flat with more contact, against flexible chains that adsorb in loops with little contact ilevbare2012c C39. For nucleation the same property is given as a "perhaps" reason why bulky cellulose esters disrupt solute packing more than flexible chains ilevbare2013c C39.

Findings

F8, F13.

Related concepts

related to polymer conformation, conformational flexibility, polymer hydrophobicity and polymer adsorption.

Formulas

none.

How it is measured or obtained

Not measured. The argument rests on the classification of the polymer chemistry (cellulose against vinyl-type chains) and on a molecular-dynamics result from the literature that stiffer chains adsorb more easily ilevbare2012c R16, C39.

Values in the library
materialvalue or classconditionspaper ids
synthetic polymers on ritonavir growthabout 0.9–1.4 except Pn-IPAAmd (3.25)5 µg/mLilevbare2012c R9
cellulose-based polymers on ritonavir growthup to 2.985 µg/mLilevbare2012c R9
PAlAmn (SP 20.70) and Pn-IPAAmd (22.64) on ritonavir and efavirenz induction timesabout 112 and 119 min (ritonavir), 4.4 and 5.0 min (efavirenz), against 172–244 and 21.6–28.0 min for adipate esters of similar SPinduction timeilevbare2013c R9, K4
Pitfalls and disagreements

Only two synthetic polymers fall in the matching SP range for the nucleation argument, and for celecoxib the synthetic Pn-IPAAmd was among the best ilevbare2013c K4, X11. Rigidity was not measured, and the SP values of the synthetic polymers are not printed in the growth paper ilevbare2012c X11. Pn-IPAAmd is flexible yet the best growth inhibitor, attributed to a specific interaction ilevbare2012c C44, C47.

← Concepts and formulas

concept · as used in Dissolution

polymer conformation

The spatial arrangement of a polymer chain in solution and when adsorbed on a crystal: extended or condensed (globular), and, on a surface, trains lying on it, loops bulging into solution and tails ilevbare2012c C39. In these papers conformation is invoked to explain why the amount of polymer adsorbed does not predict how well it inhibits growth ilevbare2012b C29, C30. Simulated conformations of cellulose oligomers: short-spacer side chains stay extended (Rg 1.12–1.14 nm) and long-spacer charged ones fold (A5b Rg 0.92 nm); in-liquid AFM shows HPMCAS as globules at pH 3 and a flat layer at pH 6.8 mosqueragiraldo2016 R18, R19; schram2015 R12, R10.

Findings

F8, F10, F11, F23, F25, F36, F37.

Related concepts

related to adsorbed polymer conformation, polymer chain stiffness, polymer ionization, polymer adsorption and conformational flexibility.

Formulas

Kubota-Mullin model, Langmuir-Freundlich isotherm.

How it is measured or obtained

It was not measured in any of these papers. It is inferred from the pH dependence of the growth ratio, adsorption isotherms, the zeta potential of seeds with polymer, and the Kubota–Mullin factor α, and by analogy with poly(acrylic acid), whose chains stretch as pH and ionization rise (pyrene-labelled chains, mean square radius of gyration) ilevbare2012b R7, R9, R8, R16, R20.

Values in the library
materialvalue or classconditionspaper ids
CAP Adp 0.85 on ritonavirextended at pH 6.8 (α 4.35, plateau about 27 mg/m²); condensed at pH 3.8 (α 1.25, plateau about 41 mg/m²)σ 0.99ilevbare2012b R9, R16, C46
seeds with CAP Adp 0.85zeta potential −52.6 mV (pH 6.8); −27.2 mV (pH 3.8)10 mM citrateilevbare2012b R8
cellulose esters against synthetic polymerssemirigid backbones lie flat in trains; flexible chains form loops, which fits the synthetic polymers' ratios of about 0.9–1.4ritonavir growthilevbare2012c C39, R9
ionized adipate estersextended adsorbed chains block drug attachment bettercelecoxib, pH 6.8 against 3.8ilevbare2013b C59, R13
PVPVA on indomethacinadsorbed chains described as a flatter train at lower concentration, a thicker layer at higherAFMmoseson2020a C51
cellulose oligomers A5a and A5bRg 1.12 and 0.92 nm; SASA 0.088 and 0.0705 nm² per atomMD 40 nsmosqueragiraldo2016 R19
A5a, A5b chains, alone and next to 25 telaprevir or atazanavir moleculesRg 3.58 and 3.16 nm alone; A5b 2.86 and 2.64 nm next to the drugMD, 310 K, 10 nsmosqueragiraldo2018a R7
HPMCAS against Eudragit E PO beside 10 enzalutamide moleculesRg about 1.38 against 0.69 nm (extended against globular)MD, 15 nswilson2021 R21
Pitfalls and disagreements

The extended-against-condensed reading rests on the pH effect, higher depletion at pH 3.8 (which includes any loss other than adsorption) and α derived from a single point ilevbare2012b X15, X8. Other "plausible" explanations are a changed interaction with incoming drug molecules or with the surface energy of the crystal face ilevbare2012b C32. The cellulose-against-synthetic rigidity argument cannot be checked from the paper because the SP and rigidity of the synthetic polymers are not printed ilevbare2012c X11. Each simulation was run once and the chains are idealized (fully ionized, average substitution) mosqueragiraldo2018a X9, X10; wilson2021 X14.

← Concepts and formulas

concept · as used in Dissolution

polymer-controlled release

Dissolution paced by the dissolving polymer, fast and typical of low drug loading, at which the drug can exceed its amorphous solubility and form drug-rich droplets [li2019 C48]. In a phase-separated film the polymer-rich phase plays this role as "glue" that dissolves quickly and frees drug-rich domains [li2019 C50]. For ritonavir–PVPVA below 25% DL the polymer controls release; a single-phase spray-dried powder at 25% DL dissolved at about 3.5 mg·min⁻¹·cm⁻¹, and phase separation by water in the spray solvent lowered it to about 2.27 and 0.90 li2020 C63, R10. The marketed lopinavir–ritonavir tablet "appears" polymer-controlled because it forms a milky dispersion at pH 6.8 trasi2019 C44. New aspect (Supersaturation from ASD dissolution): the polymer-controlled regime (cited) is connected with what happens in solution: at 10% drug there is too little drug to form a dissolution-limiting layer, the drug dissolves at a fraction of the polymer rate, and it can reach "very high local supersaturations", "most likely local", that are depleted by rapid precipitation alonzo2011 C37, C39, C47, E4. In acid, where HPMCAS barely dissolves, release of celecoxib from a 33.3% drug dispersion "appears" to follow the polymer chen2015a C31. Release from HPMC dispersions of indomethacin and HPMCAS or HPMC dispersions of celecoxib became faster as drug loading fell, "indicative of" polymer-controlled dissolution, HPMC gelling and releasing "probably" by matrix-regulated diffusion xie2017 C31, C64; xie2016a C20; a carrier that dissolves fast by ionization (PAA at pH 6.8, EPO at pH 2.2) releases a burst that crystallizes unless an inhibitor is present xie2016a C24; xie2017 C29. New aspect (Release mechanism and LoC): the polymer carries the drug into the medium because there is too little drug to form an intact surface layer ("is thought to occur"), so drug and polymer leave at the polymer's normalized rate and drug release can far exceed that of the neat amorphous drug indulkar2019a C25, C26. Release that continues into a medium already at the amorphous solubility is the authors' test of it indulkar2017b C35; indulkar2019a C43. The two-component Higuchi model does not predict it: its critical mixture ratio is far below any practical loading, about 1.7 × 10⁻³ for felodipine–PVPVA saboo2020a R27, C36, C37. The polymer itself is slowed by the drug, "most likely" by the hydrophobicity of the formulation or by drug–polymer interactions saboo2019 C13; bhardwaj2018 C49. At the limit four phenolphthalein analogues released at the neat-polymer rate, so the system is "agnostic" to the compound and drug release "can be predicted" from polymer release que2021 C39, C41. The polymer rate in a dispersion need not be the neat rate: clopidogrel made PVPVA dissolve about twice as fast, which the authors attribute to plasticization ("is thought to") correasoto2022a C30, C48. For a binary dispersion of non-interacting components at low loading the soluble polymer carries the drug at the same relative rate, and congruent, complete release is "generally" observed indulkar2022 C20, E1. For HPMCAS-MF dispersions of indomethacin and its methyl ester at 10%, drug and polymer followed each other across buffer capacities and media, and the authors conclude that drug release from HPMCAS dispersions of model acidic or neutral drugs is controlled by polymer release bapat2023 C16, C49; in this regime Noyes–Whitney type equations "fail" to describe drug release bapat2023 C2. Hiew and co-workers (2023) restate the transition for copovidone dispersions and found release of grazoprevir particles drug-dominated once the surface drug reached about 50% hiew2023 C35, C53. For HPMCAS the 2024–2025 papers take polymer solubility at the gel–solution interface as the rate-limiting step, through the flux J_p = (D_p/\delta)\,C_p, so that a drug that lowers this solubility by forming an insoluble complex slows both components bapat2024 C31, E3, C32; kaur2025 C41. Kaur and co-workers support polymer control by low release at acidic pH and in FeSSIF-V1, where the drug is far more soluble but HPMCAS does not dissolve kaur2025 C40, C51. For PVP, congruent dispersions released like the neat polymer and more slowly with higher molecular weight deac2024a C19, C31.

Findings

ASD process: F14, F15, F21, F23, F38, F48. Supersaturation from ASD dissolution: F9, F10, F15, F20, F25. Release mechanism and LoC: F1, F2, F4, F11, F14, F15, F23, F28, F29, F32, F34.

Related concepts

contrasts with drug-controlled release; related to drug-rich nanodroplets, drug leaching and congruent release. Contradicts the Higuchi two-component dissolution model at low loading; tested with the Nernst-Brunner equation; capped by the polymer's intrinsic dissolution rate; its rate is set by polymer chain disentanglement in the gel layer; slowed by insoluble drug-polymer complex formation with enteric polymers.

Formulas

congruent release relation, Noyes-Whitney equation, Higuchi-Corrigan critical mixture ratio, saturated-medium condition.

How it is measured or obtained

Release against drug loading: LPV concentration at 10 min fell from about 16.9 µg/mL at 15% DL to about 1.2 µg/mL at 100% DL for miscible films [li2019 R2]. In the ASD dissolution papers: by particle disintegration under polarized light, by the speed of release in UV and by dissolved polymer measured by colorimetry alonzo2011 P6, P2; chen2015a P12. In the release-mechanism papers: equal normalized drug and polymer rates from constant-area compacts, and release into presaturated medium saboo2019 R8; indulkar2019a R12; integrated over time, (dC/dt)_{drug} = (dC/dt)_{polymer}\,m_{drug}/m_{polymer} gave ≈7.4 against ≈7.6 mg ritonavir at 20 min from a 10% tablet indulkar2019a E3, R1, R2.

Values in the library
materialvalue or classconditionspaper ids
LPV–HPMC E5 miscible, 15% DLabout 25 µg/(mL·min) peak rate; about 16.9 µg/mL at 10 min30 µg/mL dose[li2019 R2.a]
ritonavir ASDshigh-DL PVP and PVPVA lose polymer-controlled release by rapid AAPSoutsidepurohit2017b C3, C54
ritonavir ASDsLLPS was seen only for ASDs whose release was polymer-controlled and that stayed miscible during the initial phaseoutsidepurohit2017b C6
ledipasvir–PVPVA at 2 and 5% DLrelease polymer-controlled and congruentoutsideque2019 C9
indomethacin–PVPVA at 10% DL or lessdrug and polymer release rates resemble the neat polymer rateoutsidesaboo2020 C11
10% DL ritonavir and lopinavir ASDsdissolution polymer-controlled, driven by the polymer's aqueous solubilityoutside[tres2018 C23]
ritonavir–PVPVA, spray-dried, 25% DLabout 3.5 mg·min⁻¹·cm⁻¹ from methanol; about 2.27 from 10:90 and about 0.90 from 60:40 water:methanolpH 6.5, 100 rpmli2020 R10
marketed lopinavir/ritonavir tablet (Aluvia)milky dispersion at pH 6.8, read as nanodroplets; drug loading inferred at 25% or lowernot measuredtrasi2019 R20, C44, C45
BCL–PVPVA 5 and 10% DLdrug and polymer released together; about 91 and 96% of the dose within 10 mindose of at most 30 µg/mL[moseson2022b R6, R7, C17]
felodipine 90:10 HPMC dispersionparticle gone within 5 min; 80–100% of the drug in solution within about 10 min37 °Calonzo2011 R4, R2
ritonavir and lopinavir 20% HPMCAS against PVP dispersionsmaximum within 20 min against about 2 hpH 6.8, 25 °Ctrasi2015b R14
celecoxib–HPMCAS 33.3% particles, pH 3HPMCAS ≈3.5 (none) to ≈860 µg/mL (SDS) at 24 h, drug following it in absolute termssuspension, 25 °Cchen2015a R18, X9
celecoxib–HPMCAS 10 / 30 / 50 / 60% drug≈18.3 / ≈10.5 / ≈5.0 / ≈2.0 µg/mL at 1 h (22 nominal)pH 6.8, 37 °Cxie2016a R4
celecoxib 50%, PVP-K12 against HPMCAS≈16.1 against ≈9.0 µg/mL at 2 hpH 6.8, 37 °Cxie2015 R6
indomethacin–HPMC 10 / 30 / 50% drug≈39.5 / ≈24.5 / ≈18.5 µg/mL at 60 min (80 nominal)pH 2.2, 37 °Cxie2017 R10
delamanid salt dispersions, polymer release against drug releaseat pH 5.0 HPMCP-55 released ≈65% of its polymer and no drug; HPMCAS-LF released ≈92% of its polymer after pH 1.6 with ≈47.5% drug25% drug, 37 °Cnguyen2023c R12, R11
praziquantel–HPMCAS-MF 20 / 30 / 40% drug≈100 / ≈94 / ≈83% released at 1.5 mg/mL, a gradual decline without a release cliffPBS pH 6.5, 37 °Cpolyzois2024 R9
nifedipine 10, 20% with HPMC-E5 or PVPVArelease continued to ≈214–218 µg/mL in medium presaturated at 110 µg/mL5 °C, D2Oindulkar2017b R8, R9
ITZ–PVPVA 10%199 µg/min/cm², about 4 times amorphous ITZ; polymer at 0.22–0.29 of neat PVPVA0.1 N HCl, 37 °Cbhardwaj2018 R4, R12
ritonavir–PVPVA 10% tablet≈67 mg PVPVA by 20 min against ≈46 mg for neat PVPVApH 6.8, 37 °Cindulkar2019a R2
nilvadipine 10% in PVPVA2.13 mg/min/cm² against 0.002 for amorphous nilvadipine (synthesis: about 1100-fold)pH 6.8, 37 °Csaboo2019 R5
felodipine 10% in PVP, PVPVA, HPMC, HPMCAS, EUDS≈3.8, ≈2.4, ≈0.14, ≈0.82, ≈0.16 mg/min/cm² (amorphous drug ≈0.0008)pH 6.8; EUDS 7.4saboo2020a R14, R13
four phenolphthalein analogues at their limitsdrug and PVPVA ≈2.8–3.7 against neat ≈3.0 mg/min/cm²compactsque2021 R21
clopidogrel–PVPVA 40–60%PVPVA ≈4.1–6.7 against neat ≈2.6–2.7 mg/min/cm²compactscorreasoto2022a R18
lumefantrine free base 5–35%drug ≈3.15–3.9 mg/min/cm²compactshiew2022b R12
indomethacin–HPMCAS-MF 10%drug = polymer, ≈0.12 → 0.82 mg/min/cm², following the neat polymerpH 6.8 phosphate 3–51 mM/ΔpHbapat2023 R9, R10
bedaquiline–HPMCAS 20% in FeSSIF-V1 (pH 5.0)≈22.5–25% in 120 min despite 628 µg/mL crystalline solubilitypowder, in situ UVkaur2025 R16, R2, C51
clotrimazole–PVP congruent dispersionsslower with higher PVP grade, like neat PVPcompacts, pH 8.0deac2024a C19, R3
Pitfalls and disagreements

The boundary between polymer- and drug-control was not located for LPV–HPMC here [li2019 C48]. Phase separation can lower as well as raise polymer-controlled release depending on where the drug-rich phase ends up li2020 C64. Polymer release was not measured in the 2011 felodipine study, and the local supersaturation at the dissolving particles "cannot be discounted" but was not measured alonzo2011 C28. In the celecoxib suspensions the polymer–drug link holds for absolute concentration in four media, not for supersaturation chen2015a X9. Polymer release was not measured in the celecoxib and indomethacin papers either, so the regime is inferred from drug release xie2015 C50; xie2017 C31. For praziquantel the gradual decline with loading is read as polymer-controlled release, although polymer release was not measured polyzois2024 C17. Polymer-controlled does not mean fast, against the general description of the regime as fast in the Definition: 10% felodipine–HPMC released at ≈0.14 mg/min/cm², about a sixth of HPMCAS saboo2020a R14. The persisting drug–polymer interaction proposed for low-loading ritonavir was not measured indulkar2019a C36. The 10% ITZ profiles were non-linear (R² 0.957–0.983), which "might" reflect polymer hydration and swelling bhardwaj2018 R4, C20. Drugs and surfactants change the polymer rate itself, so the neat-polymer rate bounds polymer-controlled release only roughly correasoto2022a R18; correasoto2022b R22. Kaur and co-workers did not measure polymer release, so polymer control is inferred from the pH dependence of drug release kaur2025 X14. In PVP the coupled rates of different grades were compared at different loadings deac2024a R1.

← Concepts and formulas

concept · as used in Dissolution

polymer hydrophobicity

Water affinity of a polymer, judged here by aqueous solubility and by a calculated solubility parameter; the two rank cellulose acetate suberate and HPMCAS differently [mosqueragiraldo2018b C13, X6]. HPMCAS grade AS-HF is more hydrophobic than AS-LF (more acetate, less succinate) and goes more into the drug-rich phase [ueda2020a C34, C35]; for the enzalutamide polysaccharides the polymer needs a balance of hydrophobic and hydrophilic substituents [wilson2020 C28, C30]. New aspect (Crystallization from solution): in the growth and nucleation papers it is judged by the Fedors solubility parameter \delta (lower means more hydrophobic; water 49.01 MPa^1/2) relative to that of the drug ilevbare2012c E1; ilevbare2013c E5, M29, and the working claim is that a polymer must have a moderate hydrophobicity relative to the drug to inhibit crystallization: a very hydrophilic polymer stays solvated, a very hydrophobic one collapses on itself ilevbare2012c C36; ilevbare2013c C4. For six dihydropyridines PVPVA, HPMC and HPMCAS (moderately hydrophobic) delayed crystallization of the precipitate most, the very hydrophilic PAA and the hydrophobic P2VP not at all, with hydrophobicity not measured; for telaprevir the calculated SP did not predict the order across chemistries raina2015b C41, C42, X9; mosqueragiraldo2016 C25.

Findings

Bioperformance: F7, F8, F10, F19, F24, F27. Crystallization from solution: F8, F13, F16, F17, F25, F26, F36, F37, F44.

Related concepts

governs polymer partitioning into the drug-rich phase, polymer dissolution pH threshold; measured by solubility parameter; related to amphiphilicity, polymer chain stiffness, degree of substitution, hydrophobic interactions and polymer adsorption.

Formulas

Fedors group-contribution solubility parameter.

How it is measured or obtained

Gravimetric aqueous solubility at pH 6.8; Fedors solubility parameter [mosqueragiraldo2018b P11, P21]. In the crystallization-from-solution papers calculated by the Fedors group-contribution method from the repeat unit (with a molar-volume correction for glassy polymers) ilevbare2012c E1, E2, E3, and used in a multivariate model with the other polymer descriptors (SP, DP, Mn, monomer Mw, hydrogen-bond donors and acceptors, Tg) ilevbare2012c R12, R14.

Values in the library
materialvalue or classconditionspaper ids
CA Sub / HPMCAS / HPMC / PVPVA3.3 / 20.5 / 37.1 / 45.9 mg/mL; 23.18 / 21.47 / 23.93 / 23.59 MPa^1/2pH 6.8[mosqueragiraldo2018b M2, M3, M4, M5]
ezetimibe in Ensure Plusopposite polymer ranking in the aqueous and oily phases "raises questions" about hydrophilicity[elkhabaz2017 C52]
ritonavir, cellulose esterssolubility parameter 20.56–23.28 inhibited growth; more hydrophobic ones did notilevbare2012c C25, C30
PVP / HPMCAS filmscontact angle 11.8° / 45°spin-coatedsaboo2020a R4
CPHPC-106 / cellulose acetate suberatedissolves (cited 43.5 mg/mL) / does not (3.0 mg/mL); the better solution inhibitor was the insoluble oneenzalutamide[wilson2020 M2, M3, C35]
14 new cellulose estersSP 19.62–23.28 MPa^1/2; effective (ratio 1.64–2.98) at 20.56–23.28, ineffective (0.83–1.01) at 19.62–20.41ritonavir growth, 5 µg/mLilevbare2012c R10
OPLS-DA of 19 cellulose-based polymersSP loading about 0.70, R²Ycum 0.713, Q²Y 0.512ritonavir growthilevbare2012c R12, R14
effective polymers, ritonavir; efavirenz; celecoxibmean SP 20.87; 21.73; 24.28 against drug SP 20.03; 21.89; 23.38induction time at 5 µg/mLilevbare2013c R13
16 polymers on three drugswindow 20.56–23.28 for drugs of SP 20.03–23.38seeded growthilevbare2013b R9, M1–M3
pH-shift precipitation, nine polymersPAA (very hydrophilic) and CMCAB failed for warfarin; CAP-adipate (most hydrophobic) failed for both acids1 mg/mLhsieh2014 R4, C39
celecoxib, HPMCAS; PAAHPMCAS and HPMC effective, very hydrophilic PAA not22 µg/mL drugxie2016a C18
PVPVA, HPMC, HPMCAS; PAA, P2VPbeyond 24 h for four drugs; as buffernominal 10 mg/mL, 4.5 mg/mL polymerraina2015b R9
six carboxylated cellulose derivatives (neutral structures)Fedors SP 25.5 (A5a), 24.3 (A5b), 19.9–22.2 MPa^1/2 (ethers); ECA (19.9) the most broadly effective5 µg/mL, nine drugsmosqueragiraldo2018a R6, R2
HPMCAS L, M, Hmore acetyl, less succinoyl: longer posaconazole induction times, more polymer in dropletspH 5.5–7.5shah2025 R3, R17, C48
Pitfalls and disagreements

CA Sub is "more hydrophobic" than HPMCAS by aqueous solubility but not by solubility parameter [mosqueragiraldo2018b X6]. Hydrophobicity cuts both ways: it improved inhibition of crystallization and lowered the ceiling (F19, F24); HPMCAS-HF, the most hydrophobic grade, was the only effective pretomanid inhibitor (F27) [ueda2020a C35; wilson2020 C35; nguyen2023a R5]. SP and the carboxyl content of the new esters co-vary, so their effects are not separated ilevbare2012c X10. The SP values of the commercial and synthetic polymers are not printed in the 2012 paper ilevbare2012c X11. The 2013 text misstates the failing range as SP "greater than 20.56" ilevbare2013b X2. The rule predicts the best polymer for ritonavir and efavirenz but the synthetic Pn-IPAAmd and PAA are exceptions for celecoxib, and PVPVA works for celecoxib and efavirenz through a proposed hydrogen bond ilevbare2013c X11; ilevbare2013b C51. The rule was reached from three drugs ilevbare2013c K3. The cellulose ether with the lowest calculated SP was the best inhibitor for fast crystallizers, so the SP window does not carry across chemistries mosqueragiraldo2018a R2, R6.

← Concepts and formulas

concept · as used in Dissolution

polymer ionization

The degree to which the acid or base groups of a polymer are ionized at the test pH. The ω-carboxyalkanoate substituents (adipate, suberate, sebacate) of the new cellulose esters have a pKa of about 4.43, so they are nearly fully ionized at pH 6.8 and less than 25% ionized at pH 3.8; the ritonavir and celecoxib in the growth tests are un-ionized at both pH ilevbare2012c R15; ilevbare2013b R18, C33. HPMCAS-LF (pKa 5.5) is taken as nearly fully ionized at pH 6.8 and un-ionized at pH 3; two carboxylated cellulose esters lost their whole effect on telaprevir at pH 3.0; PAA failing for acetaminophen is attributed to its ionization at pH 6.8 schram2015 C4; mosqueragiraldo2016 R7; trasi2015 C27. Above the polymer pKa the degree of ionization still matters: for HPMCAS (pKa about 4.9) a rise from pH 5.5 to 7.5 weakened every grade against posaconazole nucleation, and the grade with the least succinoyl was the best inhibitor shah2025 R3, C14, M2. New aspect (Supersaturation from ASD dissolution): in the dissolution of dispersions, ionization decides whether the polymer dissolves and so how fast the drug is released: EPO is highly soluble at pH 2.2 "due to ionization", which gave rapid and complete dissolution of the indomethacin–EPO dispersion above the amorphous solubility, followed by crystallization xie2017 C29. In leaching from suspended lopinavir dispersions, a small extent of HPMCAS ionization from pH 3 to pH 5 "significantly enhanced" leaching in media with an ionic surfactant (with SDS drug from about 13 to about 36 µg/mL and polymer from about 21 to about 120 µg/mL), lopinavir itself not ionizing over this range li2016b C24. HPMCAS LF, with a lower pKa than HF, is taken as more ionized at pH 5 li2016b C27. The authors "can only speculate" that ionized chains become less coiled and expose less polar, uncharged groups to SDS li2016b C49.

Findings

Crystallization from solution: F11, F13, F16, F23, F25, F27, F36, F44. Supersaturation from ASD dissolution: F10, F15, F20.

Related concepts

related to ionization, degree of substitution, polymer conformation and polymer self-association; related to polymer-surfactant complexation, pH-dependent polymer solubility and drug leaching.

Formulas

none.

How it is measured or obtained

Not measured: the degree of ionization is taken from the pKa of the substituent (literature) and the pH of the medium ilevbare2012c R15; ilevbare2013c R18. The effect is read from growth ratios or induction times at two pH, with non-ionizable HPMC as the control ilevbare2012b R7; ilevbare2013c R14. In the dispersion-dissolution papers it is likewise not measured but inferred from the medium pH and cited pKa values li2016b C27, C24.

Values in the library
materialvalue or classconditionspaper ids
adipate, suberate, sebacate substituentspKa about 4.43; about 100% ionized at pH 6.8; less than 25% at pH 3.8literatureilevbare2012c R15; ilevbare2013c R18
CAP Adp 0.85; HPMC on ritonavirgrowth ratio 2.98 → 1.12; 2.19 → 2.31 from pH 6.8 to 3.8S 7.6ilevbare2012b R7
CA 320S Sub 0.63 on celecoxib6.1 → 1.5 (75% lower)S 6.6ilevbare2013b R13
CAP Adp 0.85 on efavirenzinduction time 24.9 → 12.6 min19 µg/mLilevbare2013c R14
HPMCAS, Eudragit E100 in the pH-shift studyHPMCAS unionized at the acidic final pH 1.9–3.3; E100 cationic1 mg/mLhsieh2014 C36, R4
PAA in celecoxib dispersions (ASD dissolution chapter)pKa 4.28, completely ionized at pH 6.8pH 6.8xie2016a C24
CAP-Adp-085, CA-Sub-090, telaprevir68 → 9 and 105 → 8 min (pH 6.8 → 3.0)150 µg/mL, 5 µg/mL polymermosqueragiraldo2016 R7
HPMCAS L, M, H (A/S about 0.28–0.64, 0.5–1.1, 1.25–3.5)posaconazole induction time M >240, 208, 136 min at pH 5.5, 6.5, 7.5; ζ of droplets −12.9, −10.8, −7.4 mV (L, M, H, pH 6.5)FaSSIF-V2 buffer, 37 °Cshah2025 R3, R15, M2
carboxylated ethyl cellulose ECD (two acids)modelled fully ionized; partial protonation "possible"MD, 310 Kmosqueragiraldo2018a C32, X9
HPMCAS-HF lopinavir dispersions with SDS, pH 3 → pH 5drug about 13 → about 36 µg/mL; polymer about 21 → about 120 µg/mL25 °Cli2016b C24
EPO in indomethacin dispersionshighly soluble at pH 2.2 owing to ionization37 °Cxie2017 C29
Pitfalls and disagreements

The pH arm changes the buffer species (acetate against phosphate) and sometimes the polymer-free rate or time ilevbare2013b X11; ilevbare2013c X9. The size of the loss at pH 3.8 does not follow the carboxyl content in the middle of the ranking ilevbare2012b X17. PAA, fully ionized at pH 6.8, did not inhibit any of the three drugs ilevbare2013b R9.b. The degree of ionization was not measured in these papers schram2015 C4; mosqueragiraldo2016 X24. Ionization and hydrophobicity of HPMCAS change together with pH and were not measured; the pH effect on the induction time is measured, its route is not shah2025 X8. The degree of ionization of the HPMCAS grades at pH 3 and pH 5 was not measured, and how a small degree of ionization raises SDS-driven leaching is "currently unclear" li2016b C24, C27, C49.

← Concepts and formulas

concept · as used in Dissolution

polymer partitioning into the drug-rich phase

The distribution of a dissolved polymer between the aqueous phase and the drug-rich phase that forms above the amorphous solubility, expressed as the polymer:drug weight ratio in the drug-rich phase or as the partition coefficient K = C_p/C_q (polymer in the drug-rich phase over polymer in water) ueda2021 P4; ueda2022 E3. For ibuprofen it is seen as the polymer that disappears from the solution NMR spectrum when droplets form, because polymer in the viscous droplets reorients too slowly to give a signal ueda2020b C22; ueda2021 C7. Polymer in the drug-rich phase lowers the chemical potential of the drug there and so the amorphous solubility (F19–F21) ueda2021 C11. New aspect (Bioperformance): a large share of polymer in the drug-rich phase lowers the chemical potential of the drug there and may lower the flux plateau [mosqueragiraldo2018b C34, C35, C37]. HPMCAS grade AS-HF distributed much more into the drug-rich phase than AS-LF for four drugs, which the authors say accounts for its lower amorphous solubility [ueda2020a C20, C33]; HPMCAS and PVP are not expected to enter the atazanavir–darunavir phase [alkalla2026 C38]. New aspect (Crystallization from solution): the share of a dissolved polymer found in the drug-rich precipitate against the solution, with PVPVA and HPMCAS in both (about 7% of the felodipine precipitate), PAA almost only in the water and P2VP in the precipitate raina2015b R12, C20; from 2021 the polymer share in the droplets was set against crystallization inhibition, and it did not rank HPMCAS against Eudragit E PO for enzalutamide but did rank three HPMCAS grades for posaconazole wilson2021 C38; shah2025 C51.

Findings

Amorphous solubility and LLPS: F15, F19, F20, F21, F22. Bioperformance: F7, F19. Crystallization from solution: F19, F26, F37, F44.

Related concepts

lowers the amorphous solubility through the chemical potential of the drug in the drug-rich phase; driven by the hydrophobic effect and drug–polymer interaction (Flory-Huggins interaction parameter); measured with the help of NMR chemical exchange broadening; affects colloidal stability. Depends on polymer hydrophobicity. Related to amorphous precipitation.

Formulas

van't Hoff equation, Flory-Huggins reduction of amorphous solubility, ideal-mixing reduction of amorphous solubility. Drug-rich phase composition, polymer partitioning into the drug-rich phase by depletion.

How it is measured or obtained

Quantitative ¹H NMR of the dissolved polymer (peak at 2.0 ppm for PVP and PVP-VA, 3.1 ppm for HPMC) against TSP and a calibration line, compared with the polymer concentration before drug is added; the missing part is taken as being in the drug-rich phase and divided by the phase-separated drug ueda2021 P3, P4. Variable-temperature NMR gives K and, from a van't Hoff analysis, ΔG, ΔH and ΔS of transfer ueda2022 P12. Other methods in the library assay the polymer in the ultracentrifuged pellet or supernatant [mosqueragiraldo2018b R14; shah2025 R16]. Colorimetric assay of polymer in the centrifuged pellet and Nile red fluorescence for drug [mosqueragiraldo2018b P12–P14]. Solution NMR of the polymer with and without droplets (acetyl or hydroxypropyl peak), the lost signal being read as polymer in the droplets [ueda2020a R7, R8]. Ultracentrifugation of the suspension and ¹H NMR of precipitate and supernatant in d6-DMSO, masses scaled to 10 mL raina2015b P8.

Values in the library
materialvalue or classconditionspaper ids
ibuprofen with six polymerspolymer:drug ratio 0.40 (PVP K12), 0.52 (K25, K90), 0.87 (PVP-VA), 0.95 (HPMC 603), 1.14 (HPMC 615); dissolved drug 131–89 µg/mL1000 µg/mL polymer, 400 µg/mL drug, pH 2.0 (D2O), 37 °Cueda2021 R5
ibuprofen with PVP K25, PVP-VA, HPMC 603ratio stops rising above 200 (K25) and 500 µg/mL polymer (PVP-VA); HPMC 603 keeps rising (about 0.08 → 0.95)25–1000 µg/mL polymerueda2021 R8
ibuprofen with HPMC, PVP-VA, EUD-Epolymer still in solution at S_a + 300 µg/mL: about 141, 85, 289 of 300 µg/mL37 °Cueda2020b R13
ibuprofen, 15–60 °Cratio 0.24 → 0.62 (PVP), 0.46 → 1.32 (PVP-VA), 0.20 → 1.46 (HPMC, to 55 °C)1000 µg/mL polymerueda2022 R10
polymer transfer into the ibuprofen-rich phaseΔG −12 to −19 kJ/mol; ΔH of HPMC 58 → 12, PVP-VA 25 → 5 kJ/mol15–60 °C, quadratic van't Hoff fitueda2022 R22, R23
telaprevir ASDs, 150 µg/mL drugpolymer fraction of the pellet about 0.9 (cellulose acetate suberate), below 0.3 (PVPVA, HPMCAS)pH 6.8, 37 °C[mosqueragiraldo2018b R14, C35]
posaconazole with HPMCAS grades L, M, Hpolymer weight fraction in the phase about 0.05, 0.14, 0.31, water ignored100 µg/mL drug, 900 µg/mL polymer, pH 6.5, 37 °Cshah2025 R16, R17, C30, E3
enzalutamide dropletsEudragit E PO associates with the droplets more than HPMCASpH 6.5, 37 °Cwilson2021 R7, C19
telaprevir, CA Sub / HPMCAS / 70% HPMCAS / PVPVApolymer fraction 0.90 / 0.21 / 0.27 / 0.22150 µg/mL[mosqueragiraldo2018b R14]
felodipinePVPVA and HPMCAS distributed; PAA in the supernatant; P2VP with the drugprecipitatesraina2015b C20, R12
ibuprofen, polymerspolymer ratio falls with total drug37 °Cueda2021 R10
atazanavir, nifedipine, clozapine, ketoconazole droplets with 1000 µg/mL AS-LF / AS-HFNMR-detected polymer about 975 / 880, 955 / 480, 920 / 415, 990 / 600 µg/mL37 °C[ueda2020a R8, C20]
felodipine 100 mg, PVPVA 45 mgprecipitate 6.8 mg, supernatant 36.7 mg10% DMSO, pH 6.8raina2015b R12
felodipine, HPMCAS7.1 mg and 34.2 mgsameraina2015b R12
felodipine, PAA; P2VP (18 mg)0.9 and 46.6 mg; 17.7 mg and not detectedsameraina2015b R12
enzalutamide droplets, HPMCAS, Eudragit E PO12.7–24.7 and 40.8–41.0 w/w% (NMR); about 19–23 w/w% both (colorimetry)120 and 70 µg/mL drug, pH 6.5wilson2021 R7, R9, X4, X5
Pitfalls and disagreements

The "polymer in the drug-rich phase" is the NMR-invisible polymer and would include polymer adsorbed at droplet surfaces; the droplet composition and the activity of the drug in it were not measured ueda2021 X4; ueda2020b X4. The molecular-weight rule fails between PVP K25 and K90, polymer hydrophobicity was not measured, and the ranking of HPMC 603 against PVP-VA reverses with polymer concentration ueda2021 X7, X8. Two papers state that polymers used in ASDs have minimal impact on the amorphous solubility or do not take part in the drug-rich phase, which the ibuprofen data contradict for PVP K25 (154 → 121 µg/mL) [trasi2016 C32; alkalla2026 C38; ueda2021 R5]. The transfer enthalpy is per polymer species of different molar masses and has no stated uncertainty ueda2022 X9, X8. In the telaprevir study HPMCAS and PVPVA fractions are equal although their solubilities differ twofold [mosqueragiraldo2018b X7]. For atazanavir only about 12% of AS-HF disappeared from the solution signal although the ceiling fell by more than half, and the signal does not separate polymer mixed into the droplet from polymer adsorbed at its surface (F19) [ueda2020a X4, X10]. The felodipine precipitate study used four polymers, one drug and single determinations, and its totals deviate from the stated amounts by up to about 8% raina2015b X9, X12.

← Concepts and formulas

concept · as used in Dissolution

polymer salt formation

Evidence table: polymer salt formation. Content from the release-mechanism chapter (2022–2023), with rows from the Bioperformance chapter.

Pre-ionizing an acidic dispersion polymer by reacting its acid groups with a base (sodium or an amine) before the dispersion is made. Pre-ionization removes the generation and transport of protons during dissolution; the comparisons of HP-50 with HP-50-Na (faster in 50 mM phosphate, independent of buffer capacity, soluble in water) "confirm" that proton generation and removal hinder dissolution of the protonated polymer qi2022 C31. Polymer salts dissolved about 3-fold faster than HP-50 at pH 6.8, and pre-ionization via salt formation is called a successful strategy for designing polymers for better dispersion performance qi2022 C3, C6. The triethylamine salt of HPMCAS, which releases no protons, had a gel pH close to the bulk and released faster than protonated HPMCAS bapat2023 C41. In the Bioperformance chapter base was added at one mole per mole of HPMCAS-HF acid groups to pretomanid dispersions, which "likely" forms a polymer salt [nguyen2023a E7, C67].

Findings

Release mechanism and LoC: F23, F24.

Related concepts

removes the dependence on buffer capacity and on the microenvironmental pH; exceeds the critical ionization for polymer dissolution before dissolution; a form of polymer ionization of enteric polymers.

Formulas

none.

How it is measured or obtained

Acid–base reaction of the polymer with the base, then dispersion preparation bapat2023 P4, M4; the sodium content of HP-50-Na by ICP-OES and ¹H NMR qi2022 R3; rotating-disk dissolution of neat and drug-loaded compacts qi2022 R10, R15.

Values in the library
materialvalue or classconditionspaper ids
HP-50-Na3.38–3.52 wt% sodium, 91–95% of acid groupsICP-OES, ¹H NMRqi2022 R3
HP-50 and nine salts≈0.92 against ≈2.35–3.09 mg/min/cm²50 mM pH 6.8 phosphate, 37 °Cqi2022 R10
HP-50-Na; HP-50≈2.80 → 2.45; ≈0.92 → 0.14 mg/min/cm² from 29 to 3 mM/ΔpHpH 6.8 phosphateqi2022 R12
miconazole 20% on HP-50, HP-50-Na, PTEAdrug ≈0.22 / 3.15 / 2.70 mg/min/cm²50 mM pH 6.8 phosphateqi2022 R15
HPMCAS-TEA against HPMCAS-MF≈1.62 against ≈0.89 mg/min/cm²; gel pH 6.7 against 6.050 mM pH 6.8 phosphatebapat2023 R16, R15
Pitfalls and disagreements

Water uptake does not rank the salts: the sodium salt took up most water without dissolving faster than the amine salts qi2022 X17, C35. The amounts used to prepare the partial salts are not printed qi2022 X9. The salts change the dry dispersion as well: Tg ranged from 55 °C for the tris salt to 231 °C for the sodium salt qi2022 R8.

← Concepts and formulas

concept · as used in Dissolution

polymer self-association

The association of polymer chains with one another in solution, which frees them less to interact with the drug or to adsorb on the crystal. Ilevbare and co-workers propose it for two cases: a very hydrophobic polymer that "is likely" to interact more favourably with other polymer molecules than with the drug, and un-ionized carboxylic acid polymers at pH 3.8, whose loss of effect "may be attributed to increased self-association" ilevbare2013b C50; ilevbare2013c C4, C43. The long-spacer charged cellulose oligomers (A5b, A6) fold onto their backbone in simulation and are said to self-aggregate; A7 was not simulated mosqueragiraldo2016 R18, C62, X9.

Findings

F11, F13, F25, F36.

Related concepts

related to polymer ionization, polymer hydrophobicity and polymer conformation.

Formulas

none.

How it is measured or obtained

Not measured in either paper; it is inferred from the effect of pH and of polymer hydrophobicity on growth ratios and induction times ilevbare2013c C5, C43; ilevbare2013b X14.

Values in the library
materialvalue or classconditionspaper ids
efavirenz with CAP Adp 0.85; CAB Adp 0.81induction time 24.9 → 12.6 min; 27.9 → 13.6 min from pH 6.8 to 3.819 µg/mL drug, 5 µg/mL polymerilevbare2013c R14
the most hydrophobic esters (CAB Adp 0.25, CAP Seb, CAB Seb)growth ratios about 0.85–1.3 on celecoxib, efavirenz and ritonavir5 µg/mLilevbare2013b R9
A5b; A6 oligomersRg 0.92 and 1.02 nm; SASA 0.0705 and 0.077 nm² per atomMD 40 nsmosqueragiraldo2016 R19
A5b ((CH2)8 tether)most compact chain, shrinking next to the drug; RDF peak only at 6–7 nm; large uneven globules on amorphous atazanavirMD and AFMmosqueragiraldo2018a R7, R9, R4, C27
Pitfalls and disagreements

The pH arm changes the buffer species and the polymer-free induction time (5.1 against 6.6 min) as well as the ionization ilevbare2013c X9. For growth, the same pH loss is explained by a condensed adsorbed conformation, not by self-association in solution (F11) ilevbare2012b C46.

← Concepts and formulas

concept · as used in Dissolution

polymer-surfactant complexation

Evidence table: polymer-surfactant complexation. Content from the ASD dissolution chapter (celecoxib, 2015).

Association of surfactant molecules with polymer chains in solution, which can raise the solubility of the polymer. SDS is proposed to raise the solubility of HPMCAS at pH 3 "most likely" by forming polymer–surfactant complexes, as reported for HPMC with SDS and during release from solid dispersions (cited) chen2015a C32. With lopinavir, PVPVA and SDS "may be able to form a complex" with a higher solubilizing capacity than either alone, and slight ionization of HPMCAS at pH 5 raised SDS-driven leaching of drug and polymer by a mechanism the authors call "currently unclear" li2016b C31, C42, C24, C49; surfactant–polymer complexation "can also enhance" polymer solubility li2016b C44.

Findings

F15, F19.

Related concepts

related to polymer-surfactant interaction, micellar solubilization and drug leaching.

Formulas

None.

How it is measured or obtained

Not detected directly; inferred from dissolved polymer in suspension liquids chen2015a P12, R18.

Values in the library
materialvalue or classconditionspaper ids
HPMCAS-LF from celecoxib particles, 0.25% SDS≈73 µg/mL at 0.5 h, ≈420 at 4 h, ≈860 at 24 hpH 3, 25 °Cchen2015a R18
same, 0.75% STC; no surfactant≈43 and ≈3.5 µg/mL at 24 hpH 3chen2015a R18
HPMCAS-HF from lopinavir dispersions, SDS at pH 3 / pH 5≈19–24 / ≈105–134 µg/mL25 °Cli2016b R8, R13
lopinavir with HF, PVPVA and SDScrystalline solubility 11.4 against 3.3 µg/mL with HF and SDSpH 3li2016b R5
Pitfalls and disagreements

No complex was detected in this system; the mechanism is by analogy with HPMC–SDS chen2015a C32. Polymer was not measured in the polysorbate 80 and Poloxamer 188 media chen2015a X9. Neither complex was characterized li2016b C31, C44.

← Concepts and formulas

concept · as used in Dissolution

polymer-surfactant interaction

The association of a polymer with a surfactant in solution, which changes the properties of both and, for a hydrophobic polymer, can reduce the polymer's adsorption on the crystal and so its crystallization inhibition ilevbare2012a C53, C54. Pharmaceutical examples named are PEG with polysorbate 80, HPMC with poloxamer and polysorbate 80, and PVP with SLS ilevbare2012a C3. For felodipine, 100 µg/mL SDS cancelled most of the effect of 5 µg/mL HPMCAS on growth (2.7 → 1.07) although HPMCAS still adsorbed schram2016 R16, R17. New aspect (Release mechanism and LoC): for TPGS with dissolved PVPVA, the CMC and the critical aggregation concentration differ minimally and insignificantly relative to the TPGS levels used, which "suggests" little-to-no TPGS–PVPVA interaction affecting the CMC saboo2021 C7, R1. The authors conclude that the surfactant should be incorporated into the dispersion rather than added as an external excipient, since TPGS pre-dissolved in the medium did not help saboo2021 C35, R15. For ritonavir–PVPVA Indulkar and co-workers (2022) suggest that SDS forms micellar aggregates on the PVPVA chain and that this complex "may" dissolve faster than the polymer alone, about doubling early polymer release, and that a surfactant interacting strongly with the polymer "can" make a crystallization-inhibiting polymer ineffective indulkar2022 C33, R20, C42; complexation was not measured there indulkar2022 C33.

Findings

Crystallization from solution: F18, F24, F38. Release mechanism and LoC: F13, F15, F21.

Related concepts

related to competitive adsorption and interfacial tension. Measured through the critical micelle concentration.

Formulas

none.

How it is measured or obtained

Not measured in the binary-additive paper: the effect is read from the growth-rate ratio of surfactant–polymer pairs against the components ilevbare2012a R17, X15. In the ASD dissolution chapter, the CMC of TPGS with and without PVPVA gave about 50 µg/mL against 40 µg/mL (a critical aggregation concentration) saboo2021 R1. In the release-mechanism papers: CMC by drug solubility against surfactant level and by the pyrene I1/I3 ratio, without and with 900 µg/mL PVPVA saboo2021 P1, P2, R1.

Values in the library
materialvalue or classconditionspaper ids
Tween 80 with CAP Adp 0.33; 0.85growth ratio 0.70; 0.83 against 1.64; 2.97 for the esters alone5 µg/mL each, ritonavir, S 7.6ilevbare2012a R17
TPGS with and without 900 µg/mL PVPVACMC about 50 µg/mL; about 40 µg/mL with PVPVA, "little-to-no" interactionpH 6.8, 37 °Csaboo2021 R1, C7
surfactants with a crystallization-inhibiting polymerthe polymer can be rendered fully or partly ineffective, particularly when surfactant and polymer interact extensivelyritonavir–PVPVA ASD (argued)indulkar2022 C42
felodipine, HPMCAS + SDSgrowth ratio 1.07 against 2.7 (HPMCAS)S 4, 25 °Cschram2016 R16
SDS with PVPVA, HPMC-606, HPMCAS-MFCAC 0.1, 0.2, 0.2 mg/mL; with 0.1 mg/mL SDS atazanavir induction time 350, >1000, >1000 min1 mg/mL polymer, pH 6.8indulkar2019b R8, R4
ritonavir–PVPVA 30:70:5 with SDS against binary 25:75PVPVA ≈35.4 against ≈14.0 units at 10 min (unnormalized)compacts, pH 6.8indulkar2022 R20, X6
Pitfalls and disagreements

Polymer–surfactant aggregates, polymer adsorption and surfactant adsorption were not measured in the ritonavir study ilevbare2012a X15. Surfactants were only tested below their CMC and only Tween 80 with two related esters ilevbare2012a R17. The SDS–polymer correlation rests on two CAC values and one SDS level equal to the PVPVA CAC, with censored times indulkar2019b X8.

← Concepts and formulas

concept · as used in Dissolution

polymorphism

The ability of a molecule to crystallize in more than one crystal structure [towler2007 C2]; the metastable form often crystallizes first, and recrystallization from the undercooled melt "frequently" gives a metastable polymorph [baird2010 C16]. This draft is written from the crystallization-tendency chapter; the evidence table lists further papers that later chapters will add.

Findings

F4, F7, F8.

Related concepts

includes monotropy; tested by Burger-Ramberger rules; related to cold crystallization, conformational flexibility and prenucleation clusters.

Formulas

Burger-Ramberger heat-of-fusion rule, Hoffman equation.

How it is measured or obtained

By Raman (including in liquid N2), XRPD, FTIR, DSC melting and solid-state NMR [baird2010 P5; trasi2014b R15, R20, R25; lu2016 R18, R19]; the polymorph produced is mapped against temperature or supersaturation [lu2016 R10; towler2007 R1].

Values in the library
materialvalue or classconditionspaper ids
indomethacin α and γα above a supersaturation of 4, γ below about 3.5ethanol (cited)[towler2007 R1]
anthranilic acidform II from most solvents below 50 °C; form III from the melt or above 50 °Ccited[towler2007 R2]
vemurafenibat least four forms: α, β, γ, δsupercooled liquid[lu2016 C41]
nilutamidestable form, forms I and II, a suspected hydratemelt and humidity[trasi2014b R15, C25]
indomethacin δ, α, γdifferent maximum growth rates and nucleation temperaturespure melt[tian2017 R7, R1]
8 of 23 class I moleculesa different polymorph after liquid-N2 quenchRaman[baird2010 R3]
Pitfalls and disagreements

The polymorph obtained from solution is sometimes stated without an identification method [towler2007 X5]. Forms γ and δ of vemurafenib rest on Raman and morphology only [lu2016 X6]. Solution motifs do not reliably foretell the polymorph [towler2007 C33].

← Concepts and formulas

concept · as used in Dissolution

prenucleation clusters

Aggregates of solute molecules in solution before a stable nucleus forms; clustering is taken as a prime requirement for crystallization, and if their structure could be tied to the final solid the polymorph "might" be controlled [towler2007 C1, C2]. Competing views hold them solvent-rich and disordered, polymorph-like, or a dense liquid that need not resemble the crystal [towler2007 C4].

Findings

F8.

Related concepts

precedes nucleation; related to polymorphism and classical nucleation theory.

Formulas

none.

How it is measured or obtained

Inferred from concentration-dependent IR and Raman bands of the solution [towler2007 P4, P5, R13]; not measured directly.

Values in the library
materialvalue or classconditionspaper ids
indomethacincarboxylic acid dimer bands grow with concentration, even below saturationethanol, nitromethane[towler2007 R13, R15, R17]
indomethacin in ethanol1660 to 1680 cm⁻¹ shift read as solute-rich clusters excluding solventIR[towler2007 C21]
anthranilic acid in tolueneNH2 bands like form III, read as clusters unlike the crystallizing form IIIR[towler2007 C17, R9]
Pitfalls and disagreements

Cluster size and composition were not measured; a constant band position fits single solvated molecules as well as clusters [towler2007 X9]; a bulk spectrum cannot exclude a minority population [towler2007 X10].

← Concepts and formulas

concept · as used in Dissolution

quenched-in nuclei

Nuclei formed while a melt is cooled faster than the rate that avoids detectable crystallization but slower than the rate that avoids nucleation; they cannot grow before vitrification and remain in the glass [baird2010 C50; baird2013 C27].

Findings

F3, F16.

Related concepts

part of nucleation; defined through critical cooling rate; lowers glass stability; detected through critical heating rate.

Formulas

critical cooling rate to avoid nucleation.

How it is measured or obtained

Not observed directly in the library; inferred from crystallization on reheating and from the effect of the prior cooling rate on the critical heating rate [baird2013 C28, C30, X7], or proposed from the class behaviour [baird2010 C55; trasi2012a C40].

Values in the library
materialvalue or classconditionspaper ids
dibucaineRcrit,heat above 1000 °C/min after 20 °C/min cooling, 300 after 800 °C/minrapid heat–cool DSC[baird2013 R9.j, R11]
clofoctolmelting endotherm after 20 °C/min cooling, none after 860 °C/min, at 200 °C/min reheatingrapid heat–cool DSC[baird2013 R12]
class II and quench-glassy class I"most likely" explanation of recrystallization on reheatingDSC classes[baird2010 C55]
acetaminophensuggested; nuclei from cooling not separated from those formed on reheatingDSC and hot stage[trasi2012a C40, X9]
Pitfalls and disagreements

The nuclei were never seen or counted; the clofoctol test assumes equal nucleation during constant cooling [baird2013 X7, C29]. Their role in storage below Tg is proposed, not tested [baird2010 C57; baird2013 X15].

← Concepts and formulas

concept · as used in Dissolution

reduced glass transition temperature

T_{rg} = \frac{T_g}{T_m} with both temperatures in kelvin [baird2010 E4]. Assuming equal viscosity at Tg, a higher Trg means a more viscous liquid between Tg and Tm and so, it was expected, a better glass former; a typical value of 0.66 had been proposed [baird2010 C1, R29].

Findings

F5, F12.

Related concepts

depends on glass transition temperature; related to Tm − Tg temperature gap; proposed predictor of glass-forming ability; contrasts with melt viscosity as a predictor.

Formulas

reduced glass transition temperature.

How it is measured or obtained

From DSC Tg (midpoint) and melting peak [baird2010 P1]; where Tg cannot be measured, Tg is estimated from a Trg–molecular-weight fit or a fixed Tg/Tm ratio [baird2010 E27; vaneerdenbrugh2010a E7].

Values in the library
materialvalue or classconditionspaper ids
class I (23 molecules)0.69 ± 0.02DSC[baird2010 R14]
class III (17 molecules)0.73 ± 0.04, not significantly different from class IDSC[baird2010 R14]
classes II and III0.65–0.76 and 0.65–0.81DSC[baird2010 F5]
ritonavir0.81DSC[baird2010 R18.ab]
class II compounds0.65–0.76, not the constant 2/3DSC[baird2012 R14]
pretomanid; delamanid0.67; 0.64, both class IDSC[nguyen2023a C59]
35 compoundsT_{rg} = 0.00021\,\mathrm{MW} + 0.64433,\quad R^2 = 0.44regression[baird2010 E27, R19]
Pitfalls and disagreements

Trg did not separate the classes, nor class I-A from I-B [baird2010 C23, C37], and compounds with similar Tm − Tg had very different tendencies [baird2012 C36]. Trg of the 16 class I molecules without measured Tg is a function of molecular weight alone [baird2010 X17]. A small Tm − Tg (high Trg) did go with slow growth [trasi2014a R8.h].

← Concepts and formulas

concept · as used in Dissolution

residual crystallinity

Small amounts of crystalline drug that remain in, or appear soon in, a nominally amorphous sample after preparation. In the solid-state methods papers: submicrometre crystals in a melt-quenched film that looked amorphous by polarized-light microscopy [wanapun2010 R4, C8]; crystals in a freshly rotary-evaporated naproxen–HPMCAS dispersion that PXRD and Raman called amorphous [kestur2012 R1, R2, R3, C7]; and the posaconazole extrudate crystals below the pXRD limit (F10) shah2024 R9, R10. New aspect (ASD process): drug crystals that remain in a nominally amorphous dispersion after processing lose the amorphous solubility advantage, may accelerate crystallization on storage and can consume supersaturation in solution, so a fully amorphous product is desired [moseson2018 C4]. How much, how large and of what kind is acceptable "remains open" [moseson2018a C33]. In the dissolution papers of 2020 and 2021 it is also the share of the drug that cannot dissolve and can seed growth: indomethacin–PVPVA extrudates with 0–25% crystals lost up to about a third of the reachable concentration, and for bicalutamide–PVPVA the authors judge residual crystallinity, "even trace levels", "of high risk" moseson2020a R6; moseson2021 C79. For posaconazole–HPMCAS extruded for 2 min at 125 °C the crystals measured by SHG were 0.3, 3.2 and 19.3 wt% at 10, 25 and 50% loading, and none at 175 °C shah2024 R10. For bicalutamide lots extruded at Tc it is the share left after a given residence time, and it depends on the input crystals' size distribution, agglomeration and defects as well as on the median size [moseson2022c R10, C44, C46]. New aspect (Bioperformance): the question is what crystals in a nominally amorphous product do to dissolved drug and exposure, rather than whether they can be detected. Generic tacrolimus capsules were crystallized in storage to known levels (10 to 100%) and tested for release, supersaturation, absorption and exposure; the amorphous fraction dissolves to a supersaturated solution in which the crystalline fraction cannot dissolve, and the crystals may also grow on that supersaturation hate2019 C36, C37; purohit2019 C32, C54. New aspect (Crystallization from solution): seed crystals that survive or form in an amorphous drug product act as growth sites when the product dissolves into a supersaturated solution; Alonzo and co-workers conclude it "would be extremely important" to minimise residual crystallinity in an amorphous felodipine formulation, because residual seeds "could have a large impact" on the supersaturation maintained even with HPMC alonzo2012 C45. Ilevbare and co-workers add that seeds left from manufacturing "can thus potentially" shorten supersaturation unless a growth inhibitor is present ilevbare2012b C4. Seeds that crystallized out of a felodipine–HPMCAS melt grew far more slowly (ratio 12 with HPMCAS in solution) than buffer-grown seeds (2.7), and monomeric STCDC kept telaprevir seeds from growing for 15 h schram2016 R2; lu2017a R10, R12. New aspect (Supersaturation from ASD dissolution): crystals present in or added to a dispersion before it dissolves act through the growth area they offer and their origin, not through their mass; at an equal 18 wt% the paclitaxel seed types left between ≈7.9 and ≈25.3 µg/mL of a 31.6 µg/mL amorphous solubility after 16 h, and percent crystallinity "per se is not a predictive indicator" que2018 R14, C5, C54. Crystals can also form during preparation of a fast crystallizer: delamanid dispersions made by rotary evaporation showed drug peaks, and release was incomplete "once any level of residual crystallinity could be detected" duong2022a R8, C56.

Findings

Solid-state methods: F5, F7, F10. ASD process: F9, F10, F12, F26, F27, F28, F29, F36, F37, F41. Bioperformance: F16, F17, F28, F29, F30, F31. Crystallization from solution: F9, F20, F24, F33. Supersaturation from ASD dissolution: F22, F23.

Related concepts

detected by second harmonic generation; limited by limit of detection; part of solid-state crystallization of amorphous drugs; related to degree of crystallinity. Detected within the limit of detection for crystallinity; arises in the HME operating design space; related to crystal dissolution into a polymer melt; the crystals act as crystal seeding and cost the amorphous solubility advantage; in some systems they start matrix crystallization; set by the input-crystal attributes described under particle breakage and crystal defects; its effect in solution is read as desupersaturation. The form formed in the product is endogenous crystallization; tested with an absorptive sink; judged by virtual bioequivalence; related to heterogeneous nucleation, secondary nucleation and crystal growth inhibition; acts through seeded crystal growth; depends on crystal habit and crystallization tendency; countered by in situ salt formation.

Formulas

Sink index, power-law crystal growth rate, supersaturation ratio, Cabrera-Vermilyea step pinning.

How it is measured or obtained

SHG imaging for SHG-active forms; polarized-light microscopy, TEM with electron diffraction, XRPD and DSC for extrudates, with a clear order of sensitivity (F7) [moseson2021 R6; moseson2018 C27, C31]. In the extrusion papers: XRPD (Bragg-Brentano, Cu Kα; limits of detection and quantification about 0.4% and 1% against a calibration of crystalline IDM in a solvent-evaporated ASD), polarised light microscopy of powder in mineral oil, DSC (dissolution endotherm above about 1.5 J/g), bright-field TEM with Fourier analysis and SEM [moseson2018 P7, P8, P9, R12; moseson2018a P3, P7, P9]. The method sets where "amorphous" begins [moseson2018 C63]. For bicalutamide–PVPVA only TEM found the crystals of an extrudate below the XRPD limit of detection (about 1%, quantification about 3%), and DSC saw only the 30% extrudate through a broad dissolution endotherm over 120–170 °C moseson2021 P2, R6, R7. SHG was compared with pXRD for posaconazole–HPMCAS (pXRD limit of detection 0.3 and of quantification 1.2 wt%; SHG calibrated on spiked dispersions, see Solid-state methods F10) shah2024 R9, R10. PXRD of bicalutamide in PVPVA used the 17.2° peak against a 0–65% calibration (R² = 0.9952), limit of detection about 1% and of quantification about 3% [moseson2022c P15, P16]. SEM was the primary detector of surface crystals in stored coated powders, where XRPD missed several arms [moseson2022a C22, X14]. In the tacrolimus capsules PXRD with a standard curve (R² 0.9808, limit of detection about 1%, limit of quantification about 5%) was used in one study and a limit of detection of 10% in another; tacrolimus is only about 3.7 wt% of the capsule contents, which makes quantification hard hate2019 R2; purohit2018 R2; purohit2019 C12. The level is brought about by storage at 40 °C/75% RH or by blending hate2019 R2; purohit2019 R1, A1. In the crystallization-from-solution papers it is not measured; the seeded experiments model it with a fixed mass of seeds (about 2.5 mg in 18 mL for felodipine; 0.010 g in 50 mL for ritonavir) alonzo2012 P4; ilevbare2013b P10. In the ASD dissolution papers: seeds grown in buffer at a chosen supersaturation for 5.5 h, half of each batch probe-sonicated, sized by SEM over 100 crystals and converted to an end area per gram on a cuboid assumption; as-received drug slurried for the same time as a bulk-API seed que2018 P6, P10, C18. PXRD of dispersions after preparation, with DSC and water sorption duong2022a P9, P10, P12. A spray-dried free-base dispersion was checked against a rotary-evaporated one by PXRD and release nguyen2023c R5, R6.

Values in the library
materialvalue or classconditionspaper ids
griseofulvin film (b)several submicrometre SHG crystals at 0 min; dense field by 12 min120 °C[wanapun2010 R4]
naproxen–HPMCAS 75/25, freshSONICC about 24% of the drug, about 6 wt% of the powder; PXRD halorotary-evaporated, cryomilled[kestur2012 R16, X9]
IDM–PVPVA extrudatediscrete crystals below 100 nm and 5–10 nm domains; XRPD halo; Tg 73.8 ± 2.6 °C, trace birefringence; TEM crystals <100 nm and 5.8 ± 1.2 nm domainsHME at 131 °C, 20 min (1:1, at Tc)[moseson2018a R5, R9, C10, P1, R6, R7, R11]
BCL–PVPVA extrudatesbelow 1%: TEM only; 3.5%: PLM and TEM; 30%: DSC, SEM tooXRPD LOD about 1%moseson2021 R6
posaconazole HME ASD, 125 °C0.3, 3.2, 19.3 wt% of the ASD by SHG at 10, 25, 50 wt% DL; pXRD no peaks / 2.4 / 23.1%; none at 175 °CHME below the dissolution temperature, 2 minshah2024 R10, R9
50% IDM–PVPVA extrudates≈26.1, 16.0, 7.2% (117, 121, 126 °C, 2 min); ≈1.5–1.8% at 10–20 min below Tc; ≈0 at 131 °C 10 minXRPD[moseson2018 R10]
IDM crystals in copovidonelast XRD peak gone by about 135 min; crystals by PLM at 120 min and TEM at 3 h130 °C, still[moseson2019 R4, R5.h, R15]
paclitaxel–HPMCAS with seedsseed mass is not the relevant parameter; growth area and interface structure aredissolutionque2018 C5, C54, C58
tacrolimusPXRD limit of detection about 1%, of quantification about 5%—hate2019 R2
delamanid free-base ASDsresidual crystallinity above 10–15% DL went with incomplete release; drug PXRD peaks from 15% (HPMCAS) and 20% drug (HPMCP)rotary evaporation, after preparationduong2022a R8, C56
50% IDM–PVPVA extrudates, dissolution (0, 1.8, 3, 7, 16, 25% crystallinity)C720 about 43.1, 43.6, 39.4, 34.5, 32.6, 28.8 µg/mL; slight fall after the peak above 3%50 µg/mL total dose, pH 4.5, 12 hmoseson2020a R6
30:70 BCL–PVPVA extrudatesS/180 none by any method; S/155 below the XRPD limit, crystals by TEM only (140 ± 10 nm); M/155 3.5%; L/155 30%5 methodsmoseson2021 R6, R11
same, 4 h concentration at 150 µg/mLabout 35, 24.5, 16.3 and 10.5 µg/mL for none, below 1%, 3.5% and 30% (12.3 with 10% added seeds)pH 6.8, 37 °Cmoseson2021 R17
fresh generic tacrolimus capsulesno detectable crystallinity but seeds below 5% of the drugnon-sink, 100 mLpurohit2018 C44, C46
30% BCL–PVPVA at Tc = 145 °C, lots of D50 3.51 / 37.0 / 38.0 µmbelow the limit of detection at 2 / 5 / 6 minPXRD, triplicate[moseson2022c R10, R1]
same, lots of D50 42.2 µm (D90/D50 4.14) and 92.7 µmabout 2.5% and 15.0% at 20 minPXRD[moseson2022c R10, R1]
PCZ–HPMCAS MF 10 / 25 / 50% DL, after 60 min at pH 1.6SHG 0.3 → 0.4, 3 → 4, 19 → 26%37 °Cshah2024 R21
PCZ–HPMCAS 10% DL, 0.3% crystals against noneabout 14.5 against 125 µg/mL at 300 min after the pH shifttwo-stage testshah2024 R12, R14
tacrolimus generic capsule, 0 / 20 / 50 / 100% crystallinedonor maximum about 40 / 38 / 15 / 5 µg/mL and receiver AUC0–120 about 682 / 583 / 272 / 117 µg/mL·minhollow-fibre absorptive test, 100 mLhate2019 R9, R12
same capsuleAUC0–24 in dogs 42.1 (fresh), 22.9 (50%), 21.6 (100%) ng·h/mL1 mg, n = 6purohit2019 R9
same capsulerelease in 900 mL falls from about 93% (10%) to about 58% (100%); in 100 mL the peak falls from about 76.5% to about 10%compendial and low-volume testspurohit2018 R5, R7
same capsulevirtual bioequivalence lost at 20% with 100 mL input and at 40% with 900 mL inputGastroPlus, 24 subjectspurohit2018 R17
felodipine, seeded against unseeded with 1 µg/mL HPMC5.1 → 2.17 µg/mL in 58 min against 5.4 → 5.03 over 198 minS 10, 25 °Calonzo2012 R18
ritonavir, best single polymergrowth only 1.56-fold slower at S 15.337 °Cilevbare2012b R5
paclitaxel–HPMCAS dispersions with 18 wt% seeds (ASD dissolution chapter)desupersaturation by growth to about 8–25 µg/mL depending on the seed type (≈25.3 bulk API, ≈19.2 S 16, ≈10.4 S 80, ≈9.0 and ≈7.9 µg/mL sonicated, against ≈31.6 µg/mL unseeded); HPMCAS does not completely block itpH 6.8, 37 °C, 16 h, HPLCque2018 R14, C30
indomethacin, PVPVA (ASD process chapter)growth ratio 18 and 56 at the highest seed levelS 6, pH 4.5moseson2020a R5
felodipine seeds from the HPMCAS meltgrowth ratio 8.4 (no polymer in solution) and 12.0 (with)S 4, pH 6.8schram2016 R2
paclitaxel seeds: long needles grown at S 16 and S 80end area ≈0.00024 and ≈0.00023 m²/g, mean aspect ratio ≈23.6 and ≈20.1SEM, 100 crystalsque2018 R6, R9
the same, sonicated 10 min≈0.0021 and ≈0.0017 m²/g, aspect ratio ≈7.3 and ≈4.7SEMque2018 R6, R9
the same, release at 10 / 20 / 25% drug≈92 / ≈6 / ≈2 µg/mL (HPMCAS) and ≈98–100 / ≈53 / ≈20 µg/mL (HPMCP) of 100PBS pH 6.5, 37 °Cduong2022a R14
delamanid free base 25% with HPMCP-50, spray-dried against rotary-evaporatedamorphous and more than 80% released against 20%pH 6.5nguyen2023c R5, R6
Pitfalls and disagreements

The mass of crystal is not the only parameter that matters: seeds of different growth area and interface structure changed paclitaxel ASD dissolution at equal weight, so wt% crystallinity limits "often dictated by the detection limit" are arbitrary que2018 C5, C54. Trace crystals detectable only by TEM changed crystallization kinetics, supersaturation and polymorphic form of a BCL–PVPVA extrudate moseson2021 C38, C79, and residual crystals below the pXRD limit reduced the extent or duration of supersaturation of posaconazole ASDs shah2024 C56. In tacrolimus capsules 50% and 100% crystalline contents gave lower exposure than the amorphous product purohit2019 C54; hate2019 C36. A fragmented residual crystal may hinder XRD detection by peak broadening [moseson2019 C54]. In the extrusion papers, "clear" and "X-ray amorphous" extrudates carried crystals; the text and Fig. 8 disagree on the PLM status of two runs; no crystalline fraction was measured for the TEM crystals [moseson2018 R10, X4; moseson2018a X4]. The crystallinities of the IDM extrudates are cited from the 2018 paper and may be underestimated for nanometre defective crystals; "0%" and "<1%" of the bicalutamide extrudates are classifications, not measured values, and the basis of "% crystallinity" is not stated moseson2020a X8, C44; moseson2021 X6, X7. Zeros in the bicalutamide extrusions are below a PXRD limit of detection of about 1%, so crystals of nanometre size were not sought [moseson2022c X8]. In the posaconazole extrudates pXRD saw no peaks at 0.3%, which is its detection limit, while SHG did shah2024 R9, R10, X4. SEM scored crystals in uncoated extruded lumefantrine powders at 1 week where XRPD saw none through 48 weeks [moseson2022a R11, R13, X14]. In the tacrolimus capsules the level at which exposure is lost depends on the test: 20% crystallinity failed the check at 40 mL in the absorptive test and at 100 mL in simulation, while the dog exposure of the fully crystalline capsule fell by only about half (F31) hate2019 R13; purohit2018 R17; purohit2019 R9. The levels are nominal and the 100% sample dissolved above the crystalline solubility, so it may not be fully crystalline hate2019 X13; purohit2019 X11, C38. Crystals formed inside the product were about four times more bioavailable than purchased reference crystals (F30) purohit2019 C56, C57; (synthesis: a limit set with spiked reference crystals would overstate the loss). What seeds do depends on the volume: at 240 and 100 mL absorption kept growth small, at 40 mL growth was large (F29) hate2019 C46, C49. In the seeded felodipine study the amount of residual crystallinity that would defeat HPMC was not studied, and the µg/mL polymer levels are far below those released from a dispersion alonzo2012 C45; no seeded run without HPMC beyond 5 min is shown alonzo2012 X9. The seeds from the felodipine–HPMCAS dispersion were made by a route that differed in pH, time and solid composition schram2016 X4. The paclitaxel seeds were suspended in the medium, not formed inside the dispersion, at a load (18 wt%) far above any crystallinity limit, and equant crystals were not tested que2018 P9, C56. UV read the seeded runs ≈2–10 µg/mL above HPLC at 16 h and ranked the two least harmful seeds the other way round que2018 X4. For delamanid, crystallinity was not quantified and crystal growth during release was not measured duong2022a X10, C56.

← Concepts and formulas

concept · as used in Dissolution

second harmonic generation

Conversion of laser light into light of twice the frequency (800 → 400 nm; 1064 nm light gives 532 nm shah2024 P7) by material that lacks inversion symmetry. Crystals of many drugs emit it; liquids, glasses and amorphous polymers do not, so the image of a mixed sample shows only the crystals (SONICC, second-order nonlinear optical imaging of chiral crystals) [wanapun2010 C4; kestur2012 C4; correasoto2017 C7]. SHG reports the presence of certain crystal structures, not molecular information [correasoto2017 C7; kestur2012 C37].

Findings

F5, F6, F7, F8, F9, F10, F11.

Related concepts

requires a non-centrosymmetric crystal structure; scales as in coherent and incoherent SHG scaling; limited by SHG coherence length and preferred orientation; detects residual crystallinity.

Formulas

SHG relative crystallinity.

How it is measured or obtained

Beam-scanning microscopes with a femtosecond laser, forward (transmission) and backward (epi) detection by photon counting; powders between cover glasses; images thresholded at signal-to-background 3 or averaged for relative crystallinity (F8).

Values in the library
materialvalue or classconditionspaper ids
griseofulvin and chlorpropamide films800 nm, 100 fs, 80 MHz, 40 mW (about 0.5 nJ per pulse); 10× objective, N.A. 0.3; field 600 × 600 µm; frames 45 s and 25 sforward and backward[wanapun2010 P4, P5]
naproxen–HPMCAS powderssame laser at 20 mW; 4 × 4 × 20 µm³ resolution; frame 25 s; 3D image 3 minepi[kestur2012 P6, P12]
flutamide and ezetimibe spray-dried dispersions1064 nm, 51 MHz, 166 fs; 50 mW (flutamide) and 250 mW (ezetimibe); fields 1925 × 1925 µm; about 1.5 min per sampleepi[correasoto2017 P3]
posaconazole HME ASDs1064 nm, 200 mW, 447 ms; standard curve linear, R² 0.999 at 0–25%epishah2024 P7
Pitfalls and disagreements

Only non-centrosymmetric forms are seen; SHG-inactive polymorphs, crystals below about 100 nm and crystals of other orientation distributions give less or no signal (F11, F9). The detector can saturate (flutamide at 82% RH after 58 days) [correasoto2017 R11]. No chemical or structural information beyond percent crystallinity is given [kestur2012 C37].

← Concepts and formulas

concept · as used in Dissolution

secondary nucleation

The formation of new crystals in the presence of existing ones, from their surface or from fragments of them, with a lower energy barrier than primary nucleation purohit2019 C3; duong2022b C35. In the dissolution papers it enters in two ways: as the reason why seeds in an ASD speed crystallization and desupersaturation beyond their own growth purohit2019 C3, C32, and as a process assumed to be small, so that the fall of the donor concentration reflects growth of the seeds alone hate2019 C42. New aspect (Crystallization from solution): it adds to the loss of dissolved drug in a seeded run and would confound a growth measurement ilevbare2012a C14, C15; ilevbare2013b C12; in seeded runs the authors judged it absent for celecoxib and ritonavir and present for efavirenz above 10 µg/mL ilevbare2013b R5, C13. Turbidity at 370 nm marks it in the telaprevir seeded runs (it rose at δ 7.9 and 12.5, not at 2.4), and STC and STCDC are said to inhibit it because no rise was seen (traces not shown); in acetaminophen PVPVA "does not appear" to stop it lu2017a R4, R5, C22; trasi2015 C22.

Findings

Bioperformance: F29, F30. Crystallization from solution: F3, F5, F20, F27, F33, F42.

Related concepts

follows from crystal seeding; competes with crystal growth; part of desupersaturation; lowered by an absorptive sink; part of nucleation; a confounder of crystal growth rate; related to heterogeneous nucleation and residual crystallinity.

Formulas

power-law crystal growth rate (the fitted order assumes minimal secondary nucleation).

How it is measured or obtained

Not separated from growth in the Bioperformance papers. Elsewhere: turbidity in seeded runs, the size distribution of the seeds before and after growth, a mass balance of seed volume against solute removed, SEM of small crystals on larger ones, and the rise of a fine-particle count after a pH shift ilevbare2012a R7, R8; ilevbare2013b R5, R6; que2018 R9, R10; shah2024 R14, C28. In the seeded growth papers the turbidity is read at 280 or 350 nm, with an unseeded control at the same supersaturation and a volume balance on the seeds ilevbare2013b P11, R5; ilevbare2012a R7, R8, R9.

Values in the library
materialvalue or classconditionspaper ids
tacrolimus seeded solutionsassumed minimal, so the desupersaturation rate gives the growth order (1.677)hollow-fibre module, S 8–20hate2019 C42, R18
ritonavir, celecoxib; efavirenzno significant secondary nucleation in seeded runs and no turbidity rise between 5 and 22 µg/mL (ritonavir also judged by size distribution and mass balance); efavirenz turbidity rose at every concentration above 10 µg/mL (S 1.2) once macroscopic crystals formedseeded, 37 °C; turbidity, size distributionilevbare2013b R5, R6, C12, C13
telaprevirsecondary nucleation with growth at δ 7.9 and 12.5, none at 2.4; inhibited by 1.86 mM STC or STCDC; extinction without bile salt 0 (δ 2.4), about 0.047 (δ 7.9), about 0.061 (δ 12.5)370 nm extinction, pH 6.5, 37 °Clu2017a R4, R5, C11, C22
paclitaxel seedssmall needles on larger crystals in SEM; lower aspect ratio after growthno polymerque2018 R9, R10, C43
posaconazole 10 wt% ASDfine-particle count rose after 15 min following the pH shiftFBRM and SHGshah2024 R14, C28, C47
ritonavir seeds after growthmonomodal size distribution; unseeded 10 µg/mL no loss in 8 hS 7.6ilevbare2012a R7, R9
telaprevir seeds, δ 7.9possible; bulk growth assumed dominant50 mM phosphate pH 6.5, 37 °Clu2018 C8
atazanavir needles from buffersecondary growth and small needles on larger ones; none in human fluidSEM, 300 minelkhabaz2021 R17
posaconazole with 0.4–20 µg/mL nanocrystal seedsinduction period removed; immediate desupersaturation at 2 and 20 µg/mLPBS pH 6.5, S 33.6duong2022b R13, C35
Pitfalls and disagreements

Secondary nucleation was assumed small in the tacrolimus growth fit and not tested hate2019 C42. The primary and secondary routes are not separated by induction times or particle counts trasi2015 X7. Breakage of seeds gives fine needles that look like secondary nuclei que2018 C45. In vivo, absorption lowers the supersaturation that drives secondary nucleation, and its role in the dog study is only argued purohit2019 C41. At concentrations near the amorphous solubility the 2-min slope of a seeded run may include secondary nucleation or a drug-rich phase, and no measurement separates them ilevbare2012b X18. The volume balance on the ritonavir seeds differs by a factor of 2.3 ilevbare2012a X10. For telaprevir secondary nucleation was inferred from turbidity, not measured on its own lu2017a X10.

← Concepts and formulas

concept · as used in Dissolution

seeded crystal growth

Evidence table: seeded crystal growth. Content from the ASD dissolution chapter (paclitaxel, 2018) and the crystallization-from-solution chapter.

Growth of drug on crystals already present in a supersaturated solution, so that no nucleation step is needed. In a dissolving dispersion it competes with release: the dispersion first raises the concentration and the seeds then lower it, the loss depending on the growth area the seeds offer and on how well the polymer poisons their surfaces que2018 C30, C48. Seeds made in different environments grow at different rates, so seed origin belongs to the description of the system schram2016 C39.

Findings

F22, F23, F24, F26.

Related concepts

needs residual crystallinity or crystal seeding; limited by crystal growth inhibition and step pinning; measured as desupersaturation.

Formulas

Cabrera-Vermilyea step pinning, supersaturation ratio.

How it is measured or obtained

A seeded desupersaturation test: seeds at a fixed weight fraction of the drug added, supersaturation set by a solvent shift, concentration followed in situ and the initial slope taken as the growth rate, with the unseeded run as the reference que2018 P7, P10. In a dispersion, the seed suspension replaces the medium and the residual concentration is read by HPLC after filtration que2018 P8, P9. The ratio of the rates without and with polymer is the effectiveness ratio of the inhibitor schram2016 R2.

Values in the library
materialvalue or classconditionspaper ids
paclitaxel, 18 wt% seeds, no polymer31.6 → ≈12–13 µg/mL in 2 min (sonicated) against ≈21.6 (S 16) and ≈26.1 µg/mL (S 80); ≈3.3 and ≈11.5 µg/mL at 10 minpH 6.8, 37 °Cque2018 R7
paclitaxel–HPMCAS dispersion, 18 wt% seeds≈7.9–25.3 µg/mL left at 16 h against ≈31.6 µg/mL unseededpH 6.8, 37 °Cque2018 R14
paclitaxel seeds grown with HPMCASdendritic fingers ≈10.5–16.8 nm wide at the needle endsTEM, 20 measurements per sampleque2018 R12
felodipine seeds made four ways, 5 µg/mL HPMCAS (Crystallization from solution)growth slowed ≈2.7-fold to ≈12-fold depending on seed origininitial S 4, pH 6.8schram2016 R2
posaconazole with 5 or 10 µg/mL seeds (ASD process)≈46.5 and ≈25% of the starting concentration left at 30 min without polymer; ≈96 and ≈74.5% with 180 µg/mL HPMCASFaSSIF V2, 20 µg/mL drugshah2024 R22
tacrolimus seeds from a crystallized generic (Bioperformance)initial rate ≈0.39 against ≈0.075 on an axis of µg s⁻¹ mL⁻¹ from 50 and 20 µg/mLabsorptive dissolutionhate2019 R17
Pitfalls and disagreements

Seeds added to the medium are not equivalent to crystals formed inside a dispersion: extrudate crystals of indomethacin grew better with polymer than bulk seeds, so bulk seeds are "not an equivalent surrogate" moseson2020a C41, while felodipine seeds crystallized from a dispersion with HPMCAS were slowed more than buffer-grown ones schram2016 R2. Growth on seeds continues where nucleation is fully blocked, so an unseeded induction time overstates how well a polymer protects supersaturation que2018 R3, C30. No seeded-growth curve with polymer alone was shown for paclitaxel, so growth and dissolution are not separated in the polymer case que2018 X15.

← Concepts and formulas

concept · as used in Dissolution

sink conditions

Two senses occur

In membrane cells the receiver stays far below saturation so that it does not slow transport; in dissolution the medium can dissolve the whole dose (sink index above 1) [raina2014a C20; purohit2018 E1]. A receiver can be made a sink for a lipophilic weak base by solubilizing it, with 2% SDS or at pH 3, which raised PAMPA mass flow by partitioning rather than by micelles as such [hate2022 C30, C52]. In diffusion cells it is the condition under which the flux depends only on the donor activity; in the danazol cell the receiver stayed below 0.3 µg/mL jackson2016 P9, C9. New aspect (Mesoporous silica): in the silica papers "sink" also means a total dose diluted to about the crystalline solubility, a test of whether drug held by the silica comes out when nothing in solution holds it back; release still stopped at 60–65% [dening2018 P7, R18, C27, X7]. In desorption tests, adsorbed drug was diluted to "33% of the crystalline saturated solubility" [mccarthy2020 P8]. In the diffusion cell, sink means receiver concentrations below the crystalline solubility [dening2018 C12, R11].

Findings

Bioperformance: F2, F5, F13, F16, F21, F22. Crystallization from solution: F22, F31. Mesoporous silica: F8, F9, F14.

Related concepts

contrasts with non-sink dissolution; quantified by sink index; condition for membrane flux, absorptive sink (a membrane sink during dissolution), membrane asymmetry (a solubilizing receiver); reveals the partly irreversible part of the dynamic adsorption-desorption equilibrium; provided during release by absorptive dissolution testing.

Formulas

sink index, membrane flux from concentration difference, membrane flux in terms of solute activity.

How it is measured or obtained

Receiver concentration kept under one third of the crystalline solubility [raina2014a P8; raina2015c P7]; fresh receiver buffer flow [indulkar2016 P5; hate2017 P4]; sink index from solubility, volume and dose purohit2018 R4. Receiver with SDS at, below and above its CMC, or at pH 3 [hate2022 R7, R13, R15]; the sink effect is said to be available at 0.15% SDS, above the CMC of 0.05% [hate2022 R13, X6]. Receiver concentration followed with a UV dip probe and checked to stay far below the donor jackson2016 P9. Sequential dilution with fresh buffer every 30 min until the theoretical supersaturation reaches 1 [dening2018 P7]; dilution of an equilibrated suspension for 24 h [mccarthy2020 P8]; an absorptive receiver after a pH shift [hate2020b P8].

Values in the library
materialvalue or classconditionspaper ids
felodipine, 25 °Creceiver about 0.024–0.155 µg/mL at 60 minunder one third of crystalline solubility[raina2014a R10, C20]
tacrolimus, 900 / 450 / 100 / 40 mLSI amorphous 9 / 4.5 / 1 / 0.4USP medium Ipurohit2018 R4
tacrolimus40 mL non-sink relative to the amorphous solubility; 100 mL needed for exact sink5 mg dosetrasi2016 C29
telaprevir, bile saltsreceiver always under one half of crystalline solubilitydiffusion runslu2017b R25, C11
atazanavir, PAMPAreceiver with 2% SDS or pH 3 raised mass flow from about 0.65 to about 2 µg/min at 20 µg/mL and from about 3.2 to 8.6–9.0 at 1000 µg/mLlipid-impregnated hydrophobic PVDF[hate2022 R15, C30]
tacrolimus 5 mg in 240 / 100 / 40 mLsink index against the amorphous solubility 2.4 / 1 / 0.4dose-to-volumehate2019 R7
danazol diffusion cellreceiver maximum below 0.3 µg/mLregenerated cellulose 6–8 kDa, 25 °Cjackson2016 P9
four drugs in three mediareceiver sink assumed so that flux tracks donor activityside-by-side cell, 37 °Cindulkar2018 C9, E2
ritonavir–SBA-15, diluted to S about 1release about 40 → 60–66%; 2.1 µg/mL against 3.6 µg/mL crystalline solubility50 mL, 180 min[dening2018 R18]
indomethacin; methyl ester on SBA-15, diluted to sink73%; 57% desorbed; 0.98; 4.16 mg/g left24 h, pH 2.2[mccarthy2020 R13]
ritonavir diffusion cellreceiver linear (R² > 0.99) and below the crystalline solubility30–120 min[dening2018 R11]
ketoconazole–SBA-15 with absorptive sinkabout 54–60.5% → 69.5% over 4 hpH 1 → 6.8[hate2020b R17]
Pitfalls and disagreements

"Sink" is relative to the crystalline or the amorphous solubility; a medium can be a sink for one and not the other purohit2018 C20. About 20% of the dose stayed in the hollow-fibre module [hate2017 X12]. A solubilizing receiver also changes membrane partitioning, so the same donor gives a different mass flow with and without it (F22) [hate2022 C52, C53]. The flux estimate also assumes a constant donor concentration jackson2016 C9. Mesoporous silica: "drug release was always incomplete, even under sink conditions" refers to a total dose equal to the crystalline solubility, not to excess dissolution capacity [dening2018 C2, X7], which differs from the dissolution sense above (a medium that can dissolve the whole dose). The supersaturation assigned to the last dilution samples is uncertain [dening2018 X6].

← Concepts and formulas

concept · as used in Dissolution

solid-state crystallization of amorphous drugs

Crystallization of an amorphous drug or dispersion during storage or isothermal holding, without dissolution, followed as the rise of the crystalline fraction or as the number and growth of crystals. The papers of this chapter add the method side: what is seen first depends on the sensitivity of the method (F10). New aspect (Physical stability): from felodipine dispersions stored for up to about two years, crystallization proceeded quickly to a plateau at 75–93% RH with PVP, slowly and with a lag with HPMCAS, and hardly at all at 0–52% RH [rumondor2009b C7, C10, C11, C15].

Findings

Solid-state methods: F5, F6, F10, F17. Physical stability: F11, F15, F16, F20, F21, F25, F26.

Related concepts

observed through residual crystallinity and degree of crystallinity; limited by limit of detection; related to physical stability and crystallization; includes moisture-induced crystallization; slowed by crystallization inhibition by polymers.

Formulas

Avrami equation. The F-test with RMSEP as error term of the felodipine storage study is listed on the physical stability chapter page as a table entry only.

How it is measured or obtained

SHG imaging with PXRD and Raman in parallel on stored powders [kestur2012 P3, P9, P11; correasoto2017 P2, P3, P4]; SHG, forward/backward ratio and optical microscopy in melt-quenched films above Tg [wanapun2010 P3, P4, P6]; probe fluorescence, polarized-light microscopy, DSC and XRD in humid films [purohit2015b P5, P8, P11, P12]. Kinetics from the SHG stack: crystal counts, growth maps and a JMA fit (F6) [wanapun2010 P7, P8, P9]. PXRD of stored powders quantified with one PLS model per composition, RMSEP 3.7–5.3% [rumondor2009b P5, R4].

Values in the library
materialvalue or classconditionspaper ids
griseofulvin filmfirst crystal 7.5 min by SHG, after 39 min optically120 °C[wanapun2010 R2]
chlorpropamide film125 s by SHG, 500 s optically30 °C[wanapun2010 R5]
griseofulvin filmgrowth 1.16–1.54 µm/min; nucleation 2.85 mm⁻³ min⁻¹; JMA k 3.35 × 10⁻³ min⁻¹; ΔE 140 ± 20 kJ/mol125 °C; five temperatures for ΔE[wanapun2010 R16, R17, R18, R19]
naproxen–HPMCAS 75/25SONICC about 24% of the drug at 0 h; about 48% at 48 h60 °C[kestur2012 R16]
flutamide–HPMCAS 15%SHG at 11 d (75% RH), 8 d (82%); XRPD at 53 d and 29 d40 °C[correasoto2017 R1]
ezetimibe–HPMCAS 30%SHG at 15 d; XRPD none in 60 d (75% RH), 48 d (82%)40 °C[correasoto2017 R1]
probucol–PVP 50:50crystals by polarized light at 21 h; XRD peaks at 30 h97% RH[purohit2015b R5, R21]
felodipine–PVP dispersionsfast and extensive at 66–93% RH, extremely low at 0–52% RHroom temperature[rumondor2009b C7]
tacrolimus capsule contentsfully crystallized in 5 weeks after an apparent lag; XRPD LOD 10% crystallinity40 °C, 75% RH, open dishpurohit2018 C14, R2
70% drug-loaded spray-dried ASDscrystallization in the fresh samples induced by DSC heating, consistent with fully amorphous starting materialDSC at 5 °C/min[duong2022c C21]
felodipine with 25% PVP1.2–2.8% (0–52% RH); 68.6–82.1% (75–93% RH) after ≈494 days22–25 °C[rumondor2009b R9]
felodipine with 50% HPMCASlag of 35–120 days at 52–93% RH, then 9.2–16.6%same[rumondor2009b R17, R9]
felodipine with 10% HPMCAStwo crystal forms, one Form II93% RH, 491 days[rumondor2009b R13]
felodipine powders, two sieve fractionscomplete in 72–120 h alone; plateaus ≈45% and ≈17% with 3% PVP30 °C, dry[kestur2013b R5, R8]
felodipine–3% PVP powdersbiphasic, early slope 13–14 times the late onePXRD[kestur2013b R14]
Pitfalls and disagreements

An onset time is the first positive sampled point of a method with a given limit, so it is an upper bound on the true onset; the abstract and text of one paper give 26 and 29 days, and 48 and 60 days, for two XRPD detections [correasoto2017 X1, X2, X8]. Crystallization during a DSC scan can be mistaken for crystallization on storage: the 165 °C endotherm of spray-dried itraconazole–HPMC appeared only at 2 °C/min and the powder showed ITZ peaks after that heating [purohit2017a R2, R4, R5, C5]. In the felodipine storage study, values below about 10% lie within two RMSEP of zero [rumondor2009b X4]; the statement that RH did not affect HPMCAS dispersions holds for 50% HPMCAS only [rumondor2009b X3]. The humid range of fast crystallization of the felodipine–PVP dispersions is given as 66–93% RH by the solid-state methods chapter and as 75–93% RH by the physical stability chapter, both from the same paper [rumondor2009b C7, R9].

← Concepts and formulas

concept · as used in Dissolution

solubility parameter

The square root of the cohesive energy density, \delta = \sqrt{\sum_i \Delta e_i / \sum_i \Delta v_i} = \sqrt{\Delta E_v / V} in MPa^1/2, estimated by the Fedors group-contribution method from the structural formula alone; a lower value means a more hydrophobic compound, and water is 49.01 MPa^1/2 ilevbare2012c E1; ilevbare2013c E5, P1. In these papers it is the scale on which a polymer's hydrophobicity is compared with the drug's ilevbare2013c C37, C3. Fedors SP of the telaprevir polymers: effective acids 22.46–23.18 MPa^1/2, CAP-Seb-024 23.04 (fails), A5a 25.54 (works), A5b 24.29 (fails); no correlation across the chemically diverse set mosqueragiraldo2016 M12–M14, M24, M25, C25.

Findings

F8, F13, F17, F25, F36.

Related concepts

measures polymer hydrophobicity; related to lipophilicity and degree of substitution.

Formulas

Fedors group-contribution solubility parameter.

How it is measured or obtained

Calculated, not measured: group contributions at 25 °C (Fedors 1974, outside the library) are summed over the repeat unit; for glassy polymers (Tg above 25 °C) an extra molar volume of 4n (n < 3) or 2n (n ≥ 3) is added, n being the number of main-chain atoms in the repeat unit ilevbare2012c E2, E3, P11. No uncertainty is stated.

Values in the library
materialvalue or classconditionspaper ids
ritonavir; efavirenz; celecoxib20.03; 21.89; 23.38 MPa^1/2 (Log P 5.6, 4.7, 3.5)Fedorsilevbare2013c M1–M3; ilevbare2013b M1–M3
14 new cellulose esters19.62 (CAB Seb) to 23.28 (CP Adp)Fedors with correctionilevbare2012c R10, M23–M36
CAB Adp 0.25; CAP Adp 0.33; CAB Adp 0.81; CAP Adp 0.8520.05; 20.56; 20.86; 21.27Fedorsilevbare2013c R10
CA 320S Seb; HPMCAS; CAPh; CA 320S Sub; HPMC; CA 320S Adp; CMCAB; CP Adp22.36; 22.44; 22.48; 22.62; 22.68; 22.95; 23.18; 23.28Fedorsilevbare2013c R10
Pn-IPAAmd; PAlAmn22.64; 20.70Fedorsilevbare2013c R10
PVPVA; PAA; HPC; PVP; PVPdn-O25.77; 25.92; 25.98; 28.39; 32.24Fedorsilevbare2013c R10
effective polymers, mean SP20.87 (ritonavir); 21.73 (efavirenz); 24.28 (celecoxib)induction timeilevbare2013c R13
CAP-Adp-085, CA-Sub-090, CAP-Seb-02422.46, 23.18, 23.04Fedors, no ionizationmosqueragiraldo2016 M12–M14
A5a, A5b, ECA, ECB, ECC, ECD25.5, 24.3, 19.9, 22.2, 22.0, 21.4 MPa^1/2 (neutral structures)Fedors methodmosqueragiraldo2018a R6, P12
Pitfalls and disagreements

The SP values of the commercial and synthetic polymers are not printed in the 2012 paper, so the 20.56–25.98 range and the "similar hydrophobicity" of synthetic polymers cannot be checked there ilevbare2012c X11. The mean SP of the effective polymers in Table 6 is over every polymer in each SP window including those coded ineffective ilevbare2013c X3. The 2013 growth paper prints the failing range as SP "greater than 20.56", the reverse of its own convention ilevbare2013b X2. SP did not predict PVPVA and PVP on ritonavir, PAA, or Pn-IPAAmd ilevbare2013c X11. The A5a/A5b difference of 1.25 exceeds the 0.72 spread of the effective acids mosqueragiraldo2016 X8.

← Concepts and formulas

concept · as used in Dissolution

solubility-permeability interplay

The loss of membrane transport that accompanies a rise of apparent solubility when the rise comes from a solubilizer that lowers the free drug and its activity, in contrast to supersaturation from an amorphous formulation, which raises apparent solubility without lowering permeability indulkar2017a C1, C2; lu2017b C4. The same total concentration therefore gives a lower flux in micellar solution than in buffer (F16).

Findings

F16, F17.

Related concepts

consequence of micellar solubilization; read on the activity scale as thermodynamic activity and activity-based supersaturation; measured by membrane flux.

Formulas

membrane flux in terms of solute activity.

How it is measured or obtained

Flux across a 6–8 kDa membrane against donor concentration in buffer and in the surfactant or bile-salt medium, and apparent permeability with the donor concentration taken as activity or as total concentration indulkar2017a P7, P15; lu2017b P4.

Values in the library
materialvalue or classconditionspaper ids
atazanavir in 3.6 mg/mL SDSapparent permeability equal to buffer on an activity basis, 20-fold lower on a total basis (1/0.047 = 21, synthesis)pH 6.8, 37 °Cindulkar2017a R27, E12
telaprevir with 12 mM STDC, SGDCflux about half at a given concentration (0.43 against 0.83 µg/min at 90 µg/mL for STDC)50 mM pH 6.5, 37 °Clu2017b R12, R6
progesterone with cyclodextrins, surfactants, cosolvents (cited)apparent permeability fell with higher apparent solubility; an ASD did notcited workindulkar2017a R30
Pitfalls and disagreements

Permeability calculated from total concentration is "implausible" because it is a property of the molecule for a given membrane, and permeability models that assume a constant micelle–drug association (the reciprocal permeability approach) "must be used with caution" if Km/w depends on concentration indulkar2017a C58, C59. The authors argue, without in vivo or permeation data for such formulations, that surfactant-containing ASDs ranked by dissolution may mislead indulkar2017a C57.

← Concepts and formulas

concept · as used in Dissolution

solution crystallization

Nucleation and growth of crystals from the supersaturated solution, as against crystallization inside the undissolved ASD (matrix crystallization) [elkhabaz2017 C38; mosqueragiraldo2018b C52]. Crystallization from solution decided the enzalutamide-PVPVA dispersions (fall after the maximum) and the pretomanid case, in which droplets present above the amorphous solubility defeated HPMCAS-HF within minutes [wilson2018 C18, C42; nguyen2023a C13]. New aspect (Supersaturation from ASD dissolution): crystals nucleate and grow in the supersaturated liquid after the amorphous solid has dissolved, the second route by which an amorphous solid loses its advantage alonzo2010 C47. Polymer in a dispersion can move crystallization from the matrix to this route (nifedipine) raina2014b C21. When dispersions release completely, the authors of a celecoxib study take matrix crystallization as suppressed and attribute the differences between polymers to crystallization from solution, which the induction time measures xie2015 C39, C40.

Findings

Bioperformance: F9, F10, F11, F12, F14, F23, F27. Supersaturation from ASD dissolution: F1, F3, F4, F6, F14, F21, F24.

Related concepts

part of desupersaturation; contrasts with matrix crystallization; related to crystal growth and crystallization tendency; part of crystallization during dissolution; measured by nucleation induction time.

Formulas

supersaturation ratio, classical nucleation theory.

How it is measured or obtained

Fall of concentration with SHG, PLM or PXRD for the crystals; induction time by UV extinction [elkhabaz2017 P5, P8, P9, P10; hate2017 P2]. In the ASD dissolution papers: by a fall of the solution concentration together with crystals seen in the liquid rather than in the solid: needles between amorphous particles under polarized light alonzo2010 R19, fine plate-shaped crystals in the solution around dissolving dispersion particles raina2014b R13, free-floating needles in suspensions chen2015a R15, or a rise of a pyrene ratio as crystals expel the probe jackson2015 C14.

Values in the library
materialvalue or classconditionspaper ids
ezetimibe, buffer 21 µg/mLinduction about 1 min; PVP 100 µg/mL about 71 min; HPMC-AS about 50 min37 °C[elkhabaz2017 R6]
ezetimibe, FeSSIF 123 µg/mLHPMC-AS 50 µg/mL more than 360 min; PVP about 10 min37 °C[elkhabaz2017 R7]
nevirapine 500 µg/mLabout 5 min; PVPVA about 60 min; HPMC-AS over 4 hpH 6.5[hate2017 R2]
telaprevir 90% PVPVA ASDbelow 90 µg/mL from about 43 min; about 20 µg/mL at 100 min[mosqueragiraldo2018b R5]
atazanavir 50:50 PVPVA ASDcrystals from about 80 minhollow fibre[hate2018 R14]
indomethacin–Eudragit EPO ASDcrystallization after 15–20 min; small α crystals within about 20 minacid stage, pH 2.2, 37 °Cxie2017 R11, R23
celecoxib, no polymer or PAAwithin 5 min at 22 µg/mL; ≈3.6 µg/mL at 1 hpH 6.8, 37 °Cxie2016a R2, R3
enzalutamide 70 µg/mLcrystallized in about 15 min without polymer; held more than 16 h by four of 24 polymers added at 50 µg/mLpH 6.5[wilson2020 R1, C32]
pretomanid 80 µg/mL1.6–3.1 min with most enteric polymers, 22–24 min with HPMCAS-MF or HPMC, over 1000 min with HPMCAS-HF100 µg/mL polymer, pH 6.5[nguyen2023a R5]
amorphous indomethacinneedles in the liquid within 60 min, solid amorphous ≥4 h; ≈14.9 → ≈2.7 µg/mLpH 2, 25 °Calonzo2010 R19, R11, R7
nifedipine 50:50 dispersionscrystals below 2 µm in solution against 1–300 µm by the matrix routepH 6.8raina2014b R13, R2
danazol dispersions PVP / HPMC / HPMCASinduction ≈56–70 / ≈188–200 / ≈284–319 minpH 6.8, 25 °Cjackson2015 R5
celecoxib–HPMCAS suspension with SDS; polysorbate 80free needles at 0.5 h; 1 hpH 3, 25 °Cchen2015a R14, R15
celecoxib–PVP-K12 50% dispersiondesupersaturation about 2 h after complete releasepH 6.8, 37 °Cxie2015 C20
tacrolimus 50 µg/mLonset within 3 h; 6–8 h with HPMCpH 4.5, 37 °Ctrasi2016 R9
delamanid salt dispersions in acidconcentration did not generally fall during the acid stage, and 1 mg/mL predissolved PVPVA left release after a pH 3.0 stage unchangedpH 1.6–5.0, 37 °Cnguyen2023c R23, R22
Pitfalls and disagreements

In the telaprevir and nevirapine solutions crystallization is inferred from concentration, without solid-state analysis [mosqueragiraldo2018b X13; hate2017 C42]. Crystallization of the enzalutamide-PVPVA solutions is inferred from concentration, without a solid-state analysis [wilson2018 X12]. For felodipine with dissolved polymers this route was named dominant without monitoring the solid in the vessel alonzo2010 X7. In the felodipine solvent-shift tests of 2008 no precipitate was examined konno2008a X4. The danazol crystallization is inferred from UV and pyrene, without solid-state identification jackson2015 C14. Complete release was taken to exclude matrix crystallization although the HPMC-containing celecoxib dispersions neither released fully nor were checked xie2015 X3. Where the medium is subsaturated, as in the gastric stage of an enteric dispersion, the solution route is excluded and crystals must have formed in the wetted solid elkhabaz2019a C34; nguyen2023c C39.

← Concepts and formulas

concept · as used in Dissolution

speciation

The split of total drug into free, micellar, complexed, droplet and crystalline species; only free unionized drug is thought to cross a membrane [hate2018 C48; raina2015c C49]. In enzalutamide dispersions the free drug at the amorphous solubility, amorphous aggregates and filtered-out drug were counted separately after 1 h of dissolution [wilson2018 R10, R12].

Findings

F3, F15, F23, F25.

Related concepts

related to free drug concentration.

Formulas

none.

How it is measured or obtained

Mostly inferred from flux, ultracentrifugation and fluorescence [hate2018 P6; raina2015c R13]. In enzalutamide dispersions it was counted: the molecularly dissolved drug in the supernatant, the amorphous aggregates from Nile Red fluorescence calibrated against pellet mass, and the rest removed by filtration [wilson2018 R8, R10, R12].

Values in the library
materialvalue or classconditionspaper ids
atazanavirtotal concentration not equal to drug available for permeation[hate2018 C48]
felodipine with BSAflux-based supersaturation 7.3 and 4.2 against 1.3 and 1.1 by total[raina2015c R13]
enzalutamide 10:90 with copovidone42 µg/mL molecularly dissolved, 50 µg/mL amorphous aggregates, 8 µg/mL removed by filtration (of 100)pH 6.5, 22 °C[wilson2018 R10]
enzalutamide 50:50 with copovidoneabout 3 µg/mL as aggregatespH 6.5, 22 °C[wilson2018 R10]
Pitfalls and disagreements

Species were not separated in the hollow-fibre donor [hate2018 X11]. The aggregate count assumes that the free drug sits at the amorphous solubility, and the rat advantage of the aggregate-rich ASD (about 30% more exposure) was not tested statistically (F23) [wilson2018 R12, C46, X6].

← Concepts and formulas

concept · as used in Dissolution

spinodal decomposition

Spontaneous demixing of a solution beyond the spinodal curve, with no nucleation barrier; between the binodal and the spinodal a new liquid phase must nucleate, and the "metastable zone for LLPS" is the distance between them ilevbare2013a C32, C34; jackson2016 C33. The papers of 2017–2022 add that continual addition of the drug stock with extinction detection "might approach one of the spinodal decomposition points" for telaprevir lu2017b C15. New aspect (ASD process): in solvent-cast films it is described as spontaneous separation of a mixture without a nucleation barrier, giving an interconnected, network-like structure instead of discrete droplets [mugheirbi2017 C48]; network-like or worm-like textures are read as spinodal-like, discrete round domains as nucleation and growth [mugheirbi2018 C9, C45; purohit2017a C34]. New aspect (Release mechanism and LoC): in a hydrating dispersion water penetrates fast, so phase separation is "assumed" to occur mainly by spinodal decomposition where the hydration path crosses the spinodal; the authors state that the same conclusions hold for nucleation and growth from the metastable region deac2023b C33. In 2024 MePHPH–PVPVA films became co-continuous at every loading within 8–15 min at 100% RH and broke into droplets at 14–31 min, read as the signature of spinodal decomposition; the hydration path is taken to reach the spinodal deac2024b R18, C23, C48, E19.

Findings

Amorphous solubility and LLPS: F3, F4. ASD process: F5, F7. Release mechanism and LoC: F27, F30.

Related concepts

inside the binodal; mechanism of liquid-liquid phase separation. In films it contrasts with discrete-domain separation by nucleation and growth at the binodal; a mode of amorphous-amorphous phase separation. Along the hydration path on the ternary phase diagram; read with the lever rule and local equilibrium.

Formulas

binodal condition.

How it is measured or obtained

The spinodal temperature at each concentration is where the linear extrapolation of the reciprocal 90° scattering intensity against temperature reaches zero ilevbare2013a E13, P12. In the film papers (2017, 2018) it is not measured as a mechanism; it is inferred from FLOM and TEM morphology of the continuous phase [mugheirbi2017 R7, R8; mugheirbi2018 R1, R2].

Values in the library
materialvalue or classconditionspaper ids
ritonavirTsp about 17.6, 23.4, 25.2, 29.2 °C at about 58, 50, 46.5, 42.7 µg/mL; 4.5–7.7 K above TL-L (synthesis)scattering, 0.5 °C/minilevbare2013a R11
ITZ–HPMC E3 film, 40% RHinterconnected network of drug-rich and polymer-rich regions in the continuous phase; light HAADF regions about 2.9% N against 2.3%HAADF, EDX[mugheirbi2017 R7, R8, C48]
ITZ–HPMC from IPA–DCM above 30 °Cinhomogeneous fluorescence with spinodal-like microstructureFLOM[mugheirbi2018 R1, C9]
ritonavir–PVPVA filmsbinary and Span films may separate by spinodal decomposition, Tween 80 and SDS films by nucleation and growthcited from outside[yang2022b C55]
phenolphthalein analogue–PVPVA–waterseparation assumed spinodal along the hydration pathargument onlydeac2023b C33
Pitfalls and disagreements

Binodal and spinodal exist for four concentrations between about 11 and 29 °C only; the authors read the small gap as a low energy barrier to LLPS ilevbare2013a X17, C31. In the film papers the time-resolved evolution of the structure was not followed ("may have occurred") [mugheirbi2017 C48]; network-like textures with PrOH and BuOH are read as solvent incompatibility with HPMC instead [mugheirbi2018 C45]. In the 2023 phenolphthalein-analogue paper the mode of separation was not observed; the conclusions are stated not to depend on it deac2023b C33.

← Concepts and formulas

concept · as used in Dissolution

step pinning

The mechanism (Cabrera and Vermilyea, outside the library) by which adsorbed impurity molecules hold back an advancing growth step: the step must bulge between adsorbed molecules, its radius of curvature is limited by their spacing, closer spacing means slower growth, and growth stops when the spacing equals twice the critical radius \rho_c of a two-dimensional nucleus; because \rho_c falls as supersaturation rises, the maximum effect of a fixed impurity spacing falls with S alonzo2012 C9, E8. Ilevbare and co-workers chose it among four mechanisms for adsorbed impurities (surfactant action, incorporation, kink blocking, step pinning) by argument, because large polymers adsorb irreversibly ilevbare2012b C12. AFM of felodipine seeds shows steps held at several points by dissolved HPMCAS (spacing 68.5 ± 9.4 nm on buffer-grown seeds, 15.8 ± 7.4 nm on dispersion-grown seeds, step height 0.8 nm) schram2016 R5, R12.

Findings

F9, F10, F23, F24, F12, F42.

Related concepts

part of polymer adsorption on crystal surfaces; depends on critical radius of a two-dimensional nucleus; related to impurity effectiveness factor, Kubota-Mullin model and kinetic roughening.

Formulas

Cabrera-Vermilyea step pinning, Kubota-Mullin model, Kubota-Mullin impurity effectiveness factor.

How it is measured or obtained

Not observed directly in these papers. It is tested through the fall of the growth-rate ratio with coverage, the factor α of the Kubota–Mullin model and the rise of the growth order from about 1.5 to about 2 alonzo2012 R9, R13; ilevbare2012b R16. In the ASD dissolution chapter, SEM finger width of paclitaxel dendrites with HPMCAS gives the spacing of adsorption sites (about 10–16.8 nm), and the distance between step pinnings on indomethacin crystals with PVPVA was 270 ± 100 nm que2018 R12; moseson2020a R13.

Values in the library
materialvalue or classconditionspaper ids
felodipine with HPMCα 0.7, 0.5, 0.4, 0.6, 0.2; growth order 1.50 → 1.97 ± 0.12S 3–12, 25 °Calonzo2012 R9, R13
ritonavir with CAP Adp 0.85α 4.35 (pH 6.8), 1.25 (pH 3.8); growth stopped at coverage 0.23σ 0.99ilevbare2012b R16
paclitaxel with HPMCAScritical radius 5–7 nm at S 88, smaller than the site spacing of 10–20 nm, so seed growth is not preventedseeded ASD dissolutionque2018 C38
HPMCAS on felodipinel 68.5 and 15.8 nm; ρc 3.98 nmS 4schram2016 R12, R14
posaconazole plates in aspirated human fluidfinger-like ends; step pinning "may be occurring"SEM, 37 °Celkhabaz2021 R23, C39
telaprevir crystals with HPMCAS-MFrough surfaces, related to HPMCAS step pinning on felodipine (cited)SEMlu2018 R10, C48
Pitfalls and disagreements

The spacing of adsorbed HPMC on felodipine, the central quantity, was not measured (for HPMCAS on felodipine it was imaged by AFM schram2016 R12); the statement that molecules sit "relatively far apart" is an inference from α alonzo2012 C28. The other mechanisms were excluded by argument ilevbare2012b C12. Step pinning applies only below the kinetic roughening transition and was not tested above it ilevbare2012b X11.

← Concepts and formulas

concept · as used in Dissolution

sub-Tg nucleation

Nucleation of an amorphous solid in its glassy state, well below Tg, where mobility is low [trasi2014b C10]. It runs against the rule that storage about 50 °C below Tg prevents crystallization [trasi2014b C4].

Findings

F4.

Related concepts

part of nucleation; located by nucleation temperature zone; related to glass transition temperature and polymorphism.

Formulas

none.

How it is measured or obtained

By cooling the melt to low end points and reheating in DSC, by surface nuclei counts after holds below Tg, and by long DSC holds with Raman identification of the product [trasi2014b P1, P7, P8].

Values in the library
materialvalue or classconditionspaper ids
nilutamidecrystallization on reheating only after cooling to −30 °C, about 60 °C below TgDSC[trasi2014b R5]
nilutamide88% form I after 30 min at −30 °Cabout 50 DSC holds[trasi2014b R16]
indomethacin (cited)melting endotherm after storage 55 °C below Tgliterature[trasi2014b R34]
ibuprofen (cited)metastable form nucleates about 60 °C below Tgliterature[trasi2014b R33]
Pitfalls and disagreements

The counts are per sample after 30 min, not rates; longer room-temperature storage nucleated too [trasi2014b X7, X16]. Mechanical stress or beta relaxation have been proposed as causes elsewhere and were not tested [trasi2014b C43, C45].

← Concepts and formulas

concept · as used in Dissolution

supercooled liquid

The amorphous state between Tg and Tm: mobile, but below the melting point; below Tg the same material is a glass [lu2016 C2]. "Undercooled melt" is used as a synonym [baird2012 A1]. A glass of a drug–polymer mixture can be regarded as a non-equilibrium supercooled liquid of high viscosity [taylor1997 C6]. New aspect (C. Amorphous solubility and LLPS): the amorphous reference state of the solubility calculation is the water-saturated supercooled liquid ilevbare2013a C58; almeidaesousa2015 C39, and the drug-rich phase counts as one when its water-plasticized Tg lies below the experimental temperature ilevbare2013a C22; indulkar2015 C38. Ibuprofen, whose Tg of −45 °C makes its drug-rich phase a supercooled liquid at 37 °C, can be treated as an emulsion and seen by solution NMR ueda2020b C38, M1, C7. New aspects (Miscibility and drug-polymer interactions): The growth studies measure crystal growth into the supercooled liquid of drug or drug–polymer mixtures, 27–67 °C above the Tg of felodipine (70–110 °C against 43.3 °C), 3–85 °C above that of bifonazole (18–100 °C against 15.2 °C) and up to 61 °C above that of nimesulide (18–80 °C against 19.5 °C) (synthesis: temperature minus Tg) [kestur2010a P4, M1; kestur2011 P3, M1, M2]. Its lowest point, 18 °C, is at or just below the nimesulide onset Tg [kestur2011 X13]. Below Tg a binary drug–polymer glass can be regarded as a non-equilibrium, highly viscous supercooled liquid of "solvent" and "solute" molecules with homo- and hetero-associations, which makes the "solution" picture of the indomethacin–PVP dispersion reasonable "at least in terms of molecular interactions if not kinetics" [taylor1997 C6, C41, C42]. New aspect (Physical stability): in the physical-stability growth studies the supercooled liquid is the melt film, quenched and held between Tg and Tm, from which seeded crystals grow; the polymer effect on growth is placed in this liquid rather than at the crystal faces [kestur2013a C1, C6]. New aspect (Release mechanism and LoC): whether the drug-rich phase is a supercooled liquid or a glass at the release temperature is offered as a drug property that could matter for the limit of congruency. Que and co-workers (2019) name it "One interesting difference" between ritonavir (supercooled liquid under release conditions, LoC 25%) and ledipasvir (a glass, LoC 5%), and state that further investigation is "clearly" needed que2019 C49, R28. For ritonavir Indulkar and co-workers (2019) add that drug-rich nanodomains "can" coalesce into contiguous regions because the drug is a supercooled liquid at 37 °C indulkar2019a C40. Saboo and co-workers (2020) place the water-saturated indomethacin-rich phase in the supercooled-liquid state at 25–57 °C and in the glassy state at 10 °C, and find most PVPVA drugs studied "most likely" supercooled liquids at 37 °C in water (all but ledipasvir) saboo2020 C32, C58; at 5 °C loratadine behaves as a high-Tg compound yang2021 C16.

Findings

Crystallization tendency: F1, F7. C. Amorphous solubility and LLPS: F2, F7, F15, F22. Miscibility and drug-polymer interactions: F1, F10, F13. Physical stability: F3, F18, F19, F27, F28. Release mechanism and LoC: F7, F9, F18.

Related concepts

bounded by glass transition temperature; property melt viscosity; process cold crystallization and crystallization from the supercooled melt; related to crystal growth rate, structural relaxation and plasticization by water; medium for crystal growth inhibition by polymers; related to amorphous solid dispersion; site of glass-crystal growth mode near Tg; related to kinetic versus thermodynamic control of crystal growth. Set by plasticization by water and the glass transition temperature; allows a contiguous drug-rich surface layer to form.

Formulas

Vogel-Tammann-Fulcher equation, Jackson interface-kinetics growth rate, amorphous-crystalline free energy difference from heat capacity; viscosity-limited normal growth law.

How it is measured or obtained

Made by melting and cooling (quench or controlled), then studied isothermally above Tg on a hot stage or in a rheometer [lu2016 P1, P2; baird2012 P1]. In solution work, a drug-rich phase is a supercooled liquid when its water-plasticized Tg lies below the experimental temperature ilevbare2013a C22; indulkar2015 C38. The drug-rich phase is examined by DSC of the isolated phase, and the free energy of conversion from the crystal to the supercooled liquid is obtained by the Hoffman or heat-capacity cycle ilevbare2013a P9; almeidaesousa2015 E9, E10, E11. In the kestur2010a and kestur2011 growth studies, films of 30–50 µm were made by melting 3–5 mg between cover glasses and cooling rapidly to about 50 K below Tg, with the absence of birefringence checked under crossed polarizers, then nucleated at 40 °C or at ambient temperature and grown on a hot stage [kestur2010a P2, P3, P4; kestur2011 P2, R1]. Melt-quenched films between cover slips, held on a hot stage, in the physical-stability growth papers [trasi2012a P2; trasi2012b P2; mosqueragiraldo2014 P3; kestur2013a P1]. In the release-mechanism papers: from the dry or wet Tg against the test temperature, cited or measured que2019 R28, M1.

Values in the library
materialvalue or classconditionspaper ids
vemurafenibsupercooled liquid between Tg 108 °C and Tm 271 °Cmelt-quenched glass[lu2016 M1, R19.a]
34 drugsviscosities at Tm from 2.86 × 10⁻³ to 1.99 Pa·srheometry[baird2012 R1]
felodipine with 3% polymersgrowth from the supercooled liquid substantially reducedhot stage[kestur2010a C28]
bifonazole, nimesulidegrowth strongly temperature dependentsupercooled liquid[kestur2011 C6]
ritonavir drug-rich phaseTg 0.4 °C, so a supercooled liquid at 37 °Caqueous LLPSilevbare2013a C22
clotrimazole; atazanavir precipitatesTg ~14 °C (supercooled liquid at 37 °C); ~51 °C (glass)water at 37 °Cindulkar2015 R22, C38
nicardipine drug-rich phasesupercooled liquid at 37 °C (dry Tg 15 °C); more viscous after 4 h at 2 °Cwaterindulkar2015 M3, R23
griseofulvin; sorafenib new phaseonset matches the supercooled-liquid estimate although the dry drugs are glasses at 25 °C25 °Calmeidaesousa2015 R11, C36
telaprevircrystal-to-supercooled-liquid Cp estimate 97 ± 8 µg/mL against 90–92 µg/mL onset37 °Cmosqueragiraldo2015 R13
felodipinegrowth into the supercooled liquid peaks near 105 °C; 70–110 °C studiedform II, hot stage[kestur2010a R5, C10]
bifonazolegrowth falls by about 6.4 orders from 100 to 18 °C (plot)melt-quenched films[kestur2011 R7, X6]
nimesulidegrowth falls by about 5.4 orders from 80 to 18 °C (plot)melt-quenched films[kestur2011 R9, X6]
indomethacin–PVP glassnon-equilibrium supercooled liquid; single Tg citedsolvent-evaporated[taylor1997 C6, R17]
acetaminophenTg 21.2 °C, Tm 169 °CDSC, 10 °C/min[trasi2012a R9.a]
flutamideTg −3.1 °C; Tm 108–110 °C with 10 mol% additivesDSC[trasi2012b R7]
celecoxibTg 55.34 °C, Tm 163.46 °CDSC[mosqueragiraldo2014 R5.a]
ATP enantiomers (Tg 16–17 °C)growth from the supercooled liquid at 40–90 °Cmelt films[sato2015 R1, R5]
six compounds (Tg −1 to 90 °C) with PHBgrowth from the supercooled liquid at 30–150 °Cmelt films[sato2016 A4, M1, M2, M3, M4, M5, M6]
ritonavirwet Tg around 0 °C; supercooled liquid at 37 °Crelease conditionsque2019 R28; indulkar2019a M1
ledipasvirglass under release conditions37 °Cque2019 C49, M1
indomethacin-rich phase (70% dispersion)supercooled liquid at 25–57 °C, slightly below its onset at 17 °C, glass at 10 °Cwet Tg onset 18 °Csaboo2020 C32, R30
loratadinesupercooled liquid at 37 °C, glass at 5 °Cwet Tg 13.8 °Cyang2021 C16, M1
Pitfalls and disagreements

Near Tg diffusion decouples from viscosity, so viscosity-based growth laws fail there [trasi2014a C21]. Polymer effects on growth from the supercooled liquid act on the liquid phase rather than at the crystal surface for felodipine [kestur2013a C6]. In the amorphous solubility papers a glass formed in water may behave as a supercooled liquid, which is inferred and not measured almeidaesousa2015 C37, C38. The text orders of magnitude (5.5 and 6 for bifonazole) are smaller than the plot readings (6.4 and 6.9) [kestur2011 X6]. Whether dilute dispersions made by cryomilling are molecularly mixed in the melt is assumed [kestur2010a C5]. In the acetaminophen and flutamide growth papers, interactions in the liquid were judged from spin-coated films at other compositions, not from the growth samples [trasi2012b X9; trasi2012a X15]. Two drugs only; the idea was not tested que2019 C49.

← Concepts and formulas

concept · as used in Dissolution

supersaturation ratio

The LLPS (or onset) concentration divided by the equilibrium solubility of the crystalline drug in the same medium almeidaesousa2015 E15. For the weak bases it is the amorphous solubility divided by the crystalline solubility, and the authors state that it is "not affected by degree of ionization" indulkar2015 C46. It is a concentration-based ratio; it can differ from the activity-based ratio when a second solute is present (F12) [raina2015c C29]. The papers of 2017–2022 add that the concentration-based ratio can differ from the activity-based ratio in micellar media (F16) and depends on temperature and pH: ibuprofen's fell from about 5.8 to 2.5 between 25 and 60 °C, and pazopanib's from 500–600 at pH 6.4–8.4 to about 103 at pH 5.0 ueda2022 R16; sugihara2018 R4.

Findings

F6, F10, F12, F16, F17.

Related concepts

same quantity as the amorphous solubility advantage when measured at the ceiling without an additive, or with an additive that only mixes into the drug-rich phase (Case II of Ueda 2024); with an additive that complexes the drug in water (Case I) the maximum supersaturation ratio generally exceeds S_a/S_c, and with both (Case III) S_a/S_c does not give it; part of supersaturation; depends on the additive cases for amorphous solubility; based on crystalline solubility.

Formulas

supersaturation ratio.

How it is measured or obtained

From the printed onsets and crystalline solubilities; the six-drug paper tabulates it by fluorescence and by extinction almeidaesousa2015 R5.

Values in the library
materialvalue or classconditionspaper ids
ibuprofen; tolnaftate; sorafenib4.3; 20.0; 54.0 (fluorescence)25 °Calmeidaesousa2015 R5
clotrimazole; atazanavirabout 13; about 6337 °Cindulkar2015 R10
telaprevirabout 18 stated; 19.6 from 90 ÷ 4.6 (synthesis)37 °Cmosqueragiraldo2015 R14, R13
CRH1about 10pH 6.8 and pH 4.6almeidaesousa2016 R24
pazopanibabout 603 (pH 6.5); 500–530 (pH 6.4, 7.0, 8.4); about 103 (pH 5.0)37 °C, 0.1 M buffers + 5 µg/mL HPMCsugihara2018 R4
atazanavir63.6 (synthesis: 70 ÷ 1.1); predicted 62; flux-derived 65pH 6.8, 37 °Cindulkar2017a R4, R5, R6, R13
telaprevir28.5 (synthesis: 148 ÷ 5.2)50 mM pH 6.5, 37 °Clu2017b R2, R1
ibuprofen5.94 (2020 paper); 3.57 (2021 paper, synthesis: 154 ÷ 43.1); 5.8 → 2.5 (25 → 60 °C)pH 2.0 (D2O)ueda2020b R1; ueda2021 R5, R2; ueda2022 R16
Pitfalls and disagreements

The printed diclofenac extinction ratio (51.6) recomputes to 54.3 almeidaesousa2015 X1. The clotrimazole ratio is about 8 at pH 4–4.5, not about 13 throughout indulkar2015 X5. The range is now about 2 to about 600 sugihara2018 R4. Pazopanib's value carries a high experimental uncertainty because its crystalline solubility is so low sugihara2018 C16.

← Concepts and formulas

concept · as used in Dissolution

supersaturation

A solution concentration above the crystalline solubility of the drug almeidaesousa2016 C2; ilevbare2013a C21. In this chapter the highest supersaturation a solution can hold without crystals is set by the amorphous solubility: above it the excess forms a drug-rich phase, and the concentration and activity of the continuous phase stay at that ceiling mosqueragiraldo2015 C34, C35. Taylor and Zhang 2016 (p. 10) add that the strict upper limit is the spinodal point: a one-phase solution can persist for a time between the binodal and the spinodal, and after phase separation the level is the binodal, which is the amorphous solubility (synthesis). Supersaturation can be generated by solvent shift, pH shift, or dissolution of a high-energy solid form (amorphous drug, dispersion, salt, co-crystal) almeidaesousa2015 C4, C5; almeidaesousa2016 C2. The papers of 2017–2022 add that in a micellar medium the supersaturation that matters is the activity ratio a/a^{*} and not the concentration ratio, the two differing about twofold for atazanavir in SDS at the amorphous solubility (65–70 against 33–38) indulkar2017a R13, C21, and that after a pH shift of a weak-base salt the apparent concentration is held near the amorphous solubility if the dose exceeds it sugihara2018 R8, R12. New aspect (Bioperformance): a dissolved drug concentration above the crystalline solubility, with a solute activity above that of a solution saturated with the crystal; the supersaturation ratio is activity over crystal activity, and equals the concentration ratio c/c^* only if the activity coefficients are equal [raina2015c C7, E5, E6, C32]. The highest supersaturation a solution can hold as one phase is set by the amorphous solubility; above it LLPS or crystallization takes over [raina2014a C27, C30]. Its highest concentration-based value is the ratio of amorphous to crystalline solubility, and that ratio falls when a polymer, a second drug or micelles enter the drug-rich phase or the medium (F18, F19, F20) [ueda2020a E1, C17; alkalla2026 C1, C37; elkhabaz2019b C21, C25]. New aspect (Crystallization from solution): in the crystallization papers supersaturation is the ratio S = C/C_{eq} of the concentration to the crystalline solubility (concentration used in place of activity because the solutions are very dilute), with \sigma = \ln S for growth analyses; the amorphous solubility of ritonavir is S 15.3–15.4 and σ 2.7 ilevbare2013b E4, C14; ilevbare2012b E1, E2, R3. The reference solubility is that of the stable crystal, measured without methanol and, to be consistent, with the polymer present (F19) hsieh2012 P4; ilevbare2013c P9, X16; hsieh2014 C18. Other scales in these papers: C/Ceq in the medium of interest (1.5–15), S' = C/Cs with the solubility with additive, the activity ratio δ from membrane flux (2.4–28.8), S 1.5 for acetaminophen, and a nominal 10 mg/mL solvent shift chen2015 E2; li2016a E1; lu2017 E1; trasi2015 P2; raina2015b P1.

Findings

Amorphous solubility and LLPS: F1, F5, F6, F8, F13, F14, F9, F10, F15, F16, F17, F19, F23. Bioperformance: F3, F10, F13, F14, F18, F19, F20, F28, F29. Crystallization from solution: F1, F2, F9, F14, F19, F21, F22, F27, F31, F34.

Related concepts

capped by amorphous solubility; measured against crystalline solubility; expressed as supersaturation ratio or via thermodynamic activity; relieved by crystallization. Papers of 2017–2022: activity-based supersaturation, maximum achievable supersaturation. Lost by desupersaturation; contrasts with solubilization; summarized by supersaturation factor.

Formulas

supersaturation ratio. Activity-based supersaturation ratio, supersaturation from membrane flux ratio, supersaturation factor, power-law crystal growth rate.

How it is measured or obtained

As concentration divided by the crystalline solubility in the same medium (the supersaturation ratio), or in terms of activity from the flux ratio; the concentration-based ratio at the ceiling is the amorphous-to-crystalline ratio (F6) almeidaesousa2015 E15; mosqueragiraldo2015 R12. In the Bioperformance papers: concentration ratio by UV or HPLC; activity-based ratio from membrane flux relative to the flux at the crystalline solubility [raina2015c E9, R13]; receiver-derived "effective" supersaturation from a Cmax calibration [hate2017 C49, R18]; generated by solvent shift, pH shift or ASD dissolution [raina2014a P7; hate2017 P7; hate2018 P9]. The activity-based maximum is the ratio of the flux from a solution at the amorphous solubility to the flux from a crystalline suspension in the same medium, J_{amph}/J_{eq} elkhabaz2019b E2, R8, R9. A dose is described by its ratio to the crystalline solubility: 5 mg of tacrolimus in 100 mL gives S = 20 and in 240 mL S = 8 hate2019 R7, R14, E2; pretomanid nucleation is compared at S = 5 [nguyen2023a E1, R5]. In the crystallization-from-solution papers: concentration by fibre-optic UV on second-derivative spectra or by HPLC; S from the crystalline solubility measured in the same buffer (48–72 h at 37 or 25 °C); the supersaturation factor integrates S over time ilevbare2012a E2; ilevbare2013c E8.

Values in the library
materialvalue or classconditionspaper ids
ibuprofen to sorafenibmaximum ratio 4.3 to 54.025 °C, fluorescence onsetalmeidaesousa2015 R5
telaprevirmaximum ratio about 18 (stated); flux gain about 18pH 6.8, 37 °Cmosqueragiraldo2015 R14, R15
clotrimazole; atazanavirabout 13; about 6337 °Cindulkar2015 R10
CRH1about 10pH 6.8 and pH 4.6almeidaesousa2016 R24
atazanavir in 0–3.6 mg/mL SDSconcentration-based 64.8 → 33.0; activity-based 66.0 → 65.0 at the amorphous solubility37 °Cindulkar2017a R13
telaprevir in bile saltsconcentration-based value 3.9–6.7 at an activity-based 5.050 mM pH 6.5, 37 °Clu2017b R17
felodipine, 25 °C2.7–6.8 at 2–5 µg/mL; about 8 at the amorphous solubilitybuffer[raina2014a R17]
felodipine with BSAS 1.3 and 1.1 by concentration ratio; 7.3 and 4.2 from flux50 µg/mL[raina2015c R13]
nevirapinenominal S 3.9; receiver-derived 2.8 (powder), 4.10 (powder + HPMC-AS)pH shift, 128 µg/mL crystalline[hate2017 R18]
ritonavir (mesoporous-silica study)S 7.8; 3.93.6 µg/mL crystalline[dening2018 E6]
atazanavir, six mediaactivity-based maximum about 50–56; concentration-based 56 in buffer to 14 in pooled human intestinal fluid37 °C, side-by-side cellelkhabaz2019b R8
posaconazole, six mediaactivity-based maximum about 29–37; concentration-based about 35–37 in buffer to 5 in human fluid37 °Celkhabaz2019b R9
tacrolimusS 20 (5 mg in 100 mL) and S 8 (240 mL); maximum ratio about 33solvent-shift solutions, hollow-fibre modulehate2019 R7, R14; purohit2019 C30
tacrolimus, fully crystalline capsule contentsconcentration 2.5 times the crystalline solubility during 2 h5 mg in 100 mL, pH 4.5purohit2019 R5
atazanavir with darunaviratazanavir in the drug-lean phase about 61–63 instead of 91–96 µg/mL150 µg/mL atazanavir, about 196 µg/mL darunavir added[alkalla2026 R11, C1]
felodipineS 3–12; amorphous benchmark about 10solubility about 0.5 µg/mL, 25 °Calonzo2012 E1, C42
ritonavirS 3.8, 7.6 (7.7), 15.3 (15.4) at 5, 10, 20 µg/mL; 4.3 in 50 mM buffersolubility 1.3 µg/mL (100 mM), 2.3 µg/mL (50 mM), 37 °Cilevbare2012a R3; ilevbare2012b R3
celecoxib; efavirenzS 6.6, 14.7 at 10 and 22 µg/mL; 1.2 at 10 µg/mLsolubility 1.5 and 8.2 µg/mLilevbare2013b R7
type 1 weak basespeak 1.4–26.7 times the titration solubility, lasting 3.1–14.7 minpH shift, 37 °Chsieh2012 R5
type 2 weak bases7.2–20.7 times the crystalline solubilitypH shifthsieh2012 R10
telaprevir with six bile saltsδ 11.5 and 28.8 need 60 and 150 µg/mL in buffer, 140 and 300–330 with 12 mM STDC/SGDCpH 6.5, 37 °Clu2017 R1
atazanavir, ritonavir in buffer, FaSSIF-V1, Composite-SIFflux-based supersaturation at the amorphous solubility 63–65 and 9.2–10pH 6.5, 37 °Cindulkar2018 R12
posaconazoleamorphous/crystalline about 34 from pH 2 to 7phosphate buffers, 37 °Cduong2022b R1, C19
Pitfalls and disagreements

The ratio depends on the crystal form (a hydrate for paclitaxel) and the medium trasi2015a X12. A solubilizer raises total concentration without raising supersaturation in activity terms, and the concentration-based ratio can fall [ilevbare2013a C54; raina2015c C29]. Total UV concentration is not free drug once a drug-rich phase exists (F4) almeidaesousa2016 R12. Concentration ratios understate supersaturation where micelles solubilize the drug, and flux-based values assume that micelles do not cross the membrane indulkar2017a C42, X9; lu2017b X8. In the Bioperformance papers, with solubilizers the concentration ratio under-reads the activity-based supersaturation (F3) [raina2015c C38]. Concentration ratios are not valid above the amorphous solubility, where two phases coexist [dening2018 E6]. UV readings above the amorphous solubility include scattered light [hate2018 X15]. In six media of rising solubilizing capacity the concentration ratio fell several-fold while the flux ratio stayed about the same (F18) elkhabaz2019b R8, R9, C21. Which dose-to-volume ratio a test imposes decides whether absorption or growth on seeds dominates: S of 8 and S of 20 gave different results in the same module (F28, F29) hate2019 R14, R17. Polymer in the drug-rich phase lowers the achievable supersaturation although it inhibits crystallization (F19) [ueda2020a C37]. S for 10 µg/mL ritonavir is printed as 7.6 and 7.7, and for 20 µg/mL as 15.3 and 15.4, depending on rounding (10/1.3 = 7.69; 20/1.3 = 15.38) ilevbare2012a X1. The efavirenz induction-time runs state S 2.4, the ratio of the calculated amorphous solubility to the crystalline solubility, while the concentration used gives 2.3 ilevbare2013c X4. A polymer that raises the solubility lowers S for the same concentration (F19) ilevbare2013c X7. C/Cs understates the supersaturation of celecoxib in media where the mass flow does not change li2016a X18.

← Concepts and formulas

concept · as used in Dissolution

surface crystallization

Nucleation and growth of crystals at a free surface of an amorphous solid, reported to be faster than in the bulk by orders of magnitude because surface molecules are more mobile [duong2022c C2; trasi2014a C4]. It is a failure mechanism of amorphous solid dispersions in storage and during dissolution [duong2022c C2; saboo2020 C36]. New aspect (ASD process): in the coating papers the surface route is the target of the treatment, since crystal growth at the free surface of an amorphous solid is orders of magnitude faster than in the bulk, so a thin shell is expected to act where crystals start [duong2022c C2, C3; moseson2022a C6]. Uncoated powders stored open at 40 °C showed crystals by SEM within 1–2 weeks (ezetimibe–HPMCAS 12–19 days), coated ones later or not at all [moseson2022a R11; duong2022c R16, R17]. In a coated particle that did crystallize, crystals lay above an intact coating, "as is common for amorphous materials" [moseson2022a C26, R15]. In dissolution, a hydrated, drug-rich surface layer of bicalutamide–PVPVA crystallizes on the compact surface within 30–60 min (see drug-rich surface layer) [moseson2022b R14, R15]. New aspect (Supersaturation from ASD dissolution): a proposal for wetted amorphous particles: crystallization "probably" starts at the particle surface, is made worse by water plasticization, and dissolved polymer delays it by interacting with that surface, as a thin polymer film does for amorphous indomethacin (cited) ("reasonable to speculate") alonzo2010 C36, R22, R23. New aspect (Release mechanism and LoC): for indomethacin methyl ester–PVPVA, congruency was lost at a later time point above 5% loading: drug release ceased and polymer release slowed, which the authors attribute to drug crystallization at the compact surface, supported by XRD and PLM saboo2020 C17, R8, R9. A congruency read-out over the first minutes therefore misses this failure. A surfactant built into the dispersion can bring the same failure to a drug that does not crystallize on the binary tablet: ritonavir–PVPVA at 30% with SDS released fast and congruently, then stopped near 80% when needle crystals covered the tablet surface by 15 min, which "likely served as a barrier" indulkar2022 R5, R15, R16, C38. With 10 parts of SDS in ritonavir–PVPVA, needle crystals covered the 30% compact surface at 30 min, to which the authors attribute the release plateau ("can be attributed"); SDS covered about 98 wt% of the dissolved surface, which "conceivably" promotes crystallization through higher surface mobility yang2023 R16, C24, R17, C50.

Findings

Crystallization tendency: F4, F21. ASD process: F43, F44, F38, F40. Supersaturation from ASD dissolution: F1, F2, F14, F24, F27. Release mechanism and LoC: F19, F31.

Related concepts

part of physical stability; related to crystal growth rate and nucleation; contrasts with bulk crystallization in crystallization from the supercooled melt. Targeted by the atomic layer coating through surface molecular mobility; sped up by plasticization by water; in dissolution follows the drug-rich surface layer and leads to matrix crystallization; related to crystallization inhibition by polymers. Ends congruent release after a delay; a form of crystallization during dissolution.

Formulas

none.

How it is measured or obtained

Growth on films with the top coverslip removed [trasi2014a P2]; nuclei counted on an exposed glass surface [trasi2014b P7]; SEM, SHG or PLM of particle and tablet surfaces in storage or dissolution [duong2022c R16; correasoto2017 R16; saboo2020 R9]. SEM was the primary detector of surface crystals on stored coated powder, with XRPD, DSC and SEM agreeing for ezetimibe and XRPD missing several arms of the four-system study [moseson2022a C22, X14; duong2022c R16, R18, R20]; SEM and SEM-EDX of exposed compacts [moseson2022b P14, P15]. In the ASD dissolution papers: by polarized light of suspended particles over days chen2015a P10, R20 and indirectly by the lag in slurry crystallinity with polymer in the medium alonzo2010 R6. In the release-mechanism papers: SEM of the tablet surface at 5, 10 and 20 min, besides XRD, PLM and the 1607 cm⁻¹ IR band of crystalline ester saboo2020 R22, R18, C23. SEM of dried tablets and ATR-IR of blotted wet tablets against the crystalline drug indulkar2022 P9, P11.

Values in the library
materialvalue or classconditionspaper ids
felodipine form Iabout 6 times faster at the surface than in the bulk; about 23 times with 3% PVP30 °C, 0% RH[kestur2013b R12]
felodipine≈0.06–0.42 µm/s at the surfaceT/Tg ≈1.04–1.11[trasi2014a R4.g]
loratadine≈0.00005 µm/s at the surface, slowest of 14near Tg[trasi2014a R4.n]
nilutamidemuch higher nucleation at the surface than in the bulkmelt-cooled films[trasi2014b R1]
ezetimibe spray-dried dispersionscrystals after 19 days (50% DL) and 12 days (70% DL) uncoated40 °C/75% RH[duong2022c C33]
uncoated amorphous powders (erlotinib, naproxen and lumefantrine ASDs)crystallization onset within 1–2 weeks40 °C, open dish; 31–75% RH[moseson2022a R11]
flutamide spray-dried dispersionneedle crystals growing from particle surfaces40 °C/75% RH[correasoto2017 C26]
indomethacin methyl ester compactssurface crystals within 10 min of dissolutionPVPVA, 25% DLsaboo2020 R9
ritonavir–PVPVA–SDS compactsneedle-shaped surface crystals during dissolution30% DLindulkar2022 R15; yang2023 R16
delamanid dispersion filmsrapid surface crystallization at pH 3.01 hnguyen2023b R3, C37
ezetimibe–HPMCAS 50% DL, uncoatedneedle-like crystals at 19 days; about 26% crystalline at 270 days40 °C/75% RH[duong2022c R16, R19]
ezetimibe–HPMCAS 70% DL, uncoatedplate-like crystals at 12 days; about 50% crystalline at 270 dayssame[duong2022c R16, R19]
ezetimibe–HPMCAS coated (50% thin and thick, 70% thick; about 12–40 nm)no crystals by SEM, PXRD or DSC for 24 monthssame[duong2022c R16, R17, R18, R20]
ezetimibe–HPMCAS 70% thin coating (11.7–15.0 nm)first crystals at 7 months; about 1.5% at 270 dayssame[duong2022c R17, R19]
erlotinib, naproxen and lumefantrine ASD powders, 13 coated arms3–24 weeks, or none within 48 weeks in 7 arms40 °C, 31–75% RH[moseson2022a R11]
extruded and milled 30% and 50% DL BCL–PVPVA compactsneedle-like crystals on the surface at 30 min; a 5–10 µm crystal crust on the 50% compact at 1 hpH 6.8, 37 °C[moseson2022b R14, R15]
amorphous felodipine, polymer in the mediumlag of about 13–20 min before 50% crystallinitypH 6.8, 37 °C slurryalonzo2010 R6
celecoxib–HPMCAS spray-dried particles, Triton X100birefringent regions on or in the particles after about 7 days, no free needlespH 3, 25 °Cchen2015a R20, C37
same, no surfactantcrystallization only after more than 7 days, apparently from matrix or surfacepH 3chen2015a C33
delamanid salt dispersions, five enteric gradescrystals on films and powders after 1 h in acid, more with HPMCAS and at higher pH; HPMCAS-HF also at pH 1.625% drug, 37 °Cnguyen2023c R19, R18
delamanid dispersions after the pH shiftundissolved particles covered with small crystals within 30 minpH 6.5nguyen2023c R21
indomethacin methyl ester–PVPVA 25%smooth at 5 min; scattered needle-like crystals at 10 min; surface extensively covered at 20 minSEM, pH 6.8saboo2020 R22, M6
indomethacin methyl ester–PVPVA 10–25%drug release levelled off after 7.5–20 min30 min runssaboo2020 R8
ritonavir–PVPVA 30:70:5 with SDSsmooth at 2 min; needle crystals and crystalline-ritonavir IR bands at 15 min; release flat near 80%SEM, ATR-IR, pH 6.8indulkar2022 R15, R16, R5
ritonavir–PVPVA–SDS 30–70–10birefringent needles at 30 minPLM, SEM of the compact surfaceyang2023 R16
Pitfalls and disagreements

Screens with films sandwiched between cover glasses assume surface crystallization is minimized, which was not tested [baird2010 C45]. Surface and bulk data are often taken at different temperatures [trasi2014a X16]. Where surface growth exceeds bulk growth, extrapolating bulk data may overpredict stability [kestur2013a C18]. The coating delays surface crystallization but does not stop it: coated arms failed at 3, 6 and 24 weeks and at 7 months, and the benefit depends on humidity through the wet glass transition, on the polymer and, for a fast crystallizer at high loading, on thickness (see F44) [moseson2022a R11, R12; duong2022c R17]. Neither surface mobility nor water uptake during storage was measured [moseson2022a C4; duong2022c X7]. XRPD shows no crystals through 48 weeks for uncoated extruded lumefantrine powders that SEM scored at 1 week [moseson2022a X14]. Where crystallization starts on the wetted felodipine particles and whether polymer adsorbs there were not measured alonzo2010 C36. The 7-day observations of the celecoxib suspensions appear only in the discussion and are imaged for Triton X100 only chen2015a X17. The authors read the crystals as forming mainly at the surface of the wetted matrix, where water lowers the Tg and raises mobility, and as acting as seeds once the polymer dissolves nguyen2023c C43, C44. The 5-min rates used to set the limit of congruency did not show the later stop of release saboo2020 X7. Crystals were imaged only at 30% and not identified yang2023 X12.

← Concepts and formulas

concept · as used in Dissolution

surface drug enrichment

A drug-rich layer at the surface of a dispersion or at the dissolving interface. In the lopinavir films, with 50–100% water in the casting solvent the continuous phase softened at 142 ± 11, 116 ± 16 and 124 ± 7 °C (37–92% LPV), which the authors read as drug enrichment at the surface ("suggesting"), lowering release [li2019 R15, R16, C30]. In spray-dried ritonavir–PVPVA powders XPS gave the outer 0–10 nm composition and the surface drug content rose with the water in the spray solvent; in granules of two drugs a lopinavir-rich surface is proposed to form in acid as ritonavir dissolves first li2020 R7, R24; trasi2019 C29, C47. Fluorine EDX (F/F0; fluorine occurs only in the drug) quantified it on bicalutamide–PVPVA compacts: the surface of a 30% compact reached F/F0 = 1.23 ± 0.07 after 30 min in buffer [moseson2022b R14, E1]. New aspect (Release mechanism and LoC): two kinds appear. During dissolution the surface of compacts above the limit of congruency turns drug-rich within minutes, read by IR, XPS and EDX, while congruent compacts keep their composition indulkar2019a R16, R15; que2019 R15; saboo2019 R18; saboo2020a R22. Before dissolution the surface of spray-dried particles can already differ from the bulk, set by the spray solvent bhardwaj2018 R20, C57. For indomethacin–PVPVA the dissolving surface was followed in time by three methods of different probe depth, whose agreement the authors call "compelling evidence" saboo2020 C44. In ritonavir–PVPVA at 40% the surface became enriched in drug during incongruent release by preferential polymer release, in agreement with the drug-rich layer seen in cross-section yang2022a C39, C40. Hiew and co-workers (2023) lowered the surface drug of high-loading co-precipitated particles on purpose, by depositing a water-soluble polymer from the anti-solvent; a surface drug of 50% or more appeared to make release drug-dominated hiew2023 C45, C53. In 2023–2025 surface composition was followed during dissolution: SDS kept the ritonavir surface of a 40% compact at its bulk composition (about 41 and 40% before and after 30 min) while covering it itself yang2023 R19, R17, C33, and a 40% bedaquiline–HPMCAS dispersion went from about 32 to 55 wt% surface drug after 1 h at pH 6.5, read as preferential loss of polymer and a second cause of poor release kaur2025 R20, C26, C43. For 75% grazoprevir particles, surface drug contents of 32–50% did not separate good from poor secondary excipients hiew2025 R14, C35.

Findings

ASD process: F15, F3, F21, F23, F27, F38. Release mechanism and LoC: F7, F14, F17, F28, F31, F32, F35.

Related concepts

promotes drug-controlled release; a drug-rich layer follows incongruent release; in dissolution becomes the drug-rich surface layer. Forms the drug-rich barrier layer.

Formulas

molar amount of halogen at the lower XPS binding energy, Gordon-Taylor equation.

How it is measured or obtained

Not measured in depth for the lopinavir films; inferred from nanoTA and a mass balance that is not shown [li2019 C30, X18]. For other dispersions the drug-rich surface was read from IR, SEM, EDX and XPS of tablet or particle surfaces indulkar2019a C18, C41; saboo2020a C22; bhardwaj2018 C40. In the release-mechanism papers: ATR-IR of blotted tablets against reference spectra indulkar2019a P7; XPS of the top ~10 nm with pure-component fits que2019 P7; saboo2019 P17; bhardwaj2018 P11; EDX of an element carried only by the drug (N/O ratio, chlorine) saboo2019 P16, E2; saboo2020a P9. SEM-EDX of the Cl/N ratio (one Cl and one N per indomethacin, one N per PVPVA unit) and AFM-nanoTA local Tg converted to composition by the Gordon–Taylor equation saboo2020 E2, E3, P14, P18.

Values in the library
materialvalue or classconditionspaper ids
LPV–HPMC E5 33% DL, 50 / 70 / 100% watercontinuous-phase local Tg 142 / 116 / 124 °CnanoTA[li2019 R15, R16]
ritonavir–PVPVA 50% DL tabletsurface enriched in drug after 5 minIR, SEM (outside)indulkar2019a C18, C41
felodipine ASDs 30% DLincongruent PVP, PVPVA and HPMC enrich the interface; congruent HPMCAS and EUDS do not: chlorine ≈3.0 → 6.7, 4.6 → 6.4, 2.6 → 7.3 (PVP, PVPVA, HPMC); ≈2.9 → 3.1 and ≈3.0 → 2.7 (HPMCAS, EUDS; ns)EDX, 10 min (outside)saboo2020a C22, C28, R22
spray-dried ITZ–PVPVA, 20%n-hexane batches drug-rich at the surface; water lowered surface drug: 4.2% (water in solvent), 28.1% (DCM–methanol), 31.8–35.7% (n-hexane), bulk 20%XPS N 1s, before dissolution (outside)bhardwaj2018 C40, C41, R20
ritonavir–PVPVA spray-dried, 25% DLsurface RTV by XPS (C 1s) about 21% (methanol), 43% (10:90), 70% (60:40); at 50% DL 85–91% from 60:40XPS, at least 4 spotsli2020 R7, R11
polymer-free 200:50 lopinavir:ritonavir melt after 1 h in 0.1 N HCl1630/1718 cm⁻¹ band ratio 7.7 → 11.2, read as ritonavir loss from the surfaceATR-FTIRtrasi2019 R16, C29
BCL–PVPVA 30:70PVPVA:BCL of the undissolved solid 7:3 → 1:1 within 5 min (computed); surfaces rough and pitted after 20 minSEC, SEMmoseson2021 R24, R26, C32
30% BCL–PVPVA compact surfaceF/F0 = 1.23 ± 0.07 (about 20% enrichment)30 min in buffer, SEM-EDX[moseson2022b R14]
same, cross-sectionboundary layer F/F0 = 1.41 ± 0.10 over a gel layer of 0.93 ± 0.061 h[moseson2022b R15]
ritonavir 50:50 PVP and PVPVA filmsporous or granular surface after 10 s in bufferSEMpurohit2017b R9
ledipasvir–PVPVA 20, 50%17 → 54 and 40 → 61 wt% drug in 10 minXPSque2019 R15
nilvadipine 15:85; cilnidipine 20:802 → 32% and 20 → 60% in 10 min; rim N/O ≈0.50 against ≈0.35 inside a pitXPS, EDXsaboo2019 R18, R16
indomethacin–PVPVA 25%25 → 41 → 55 → 72 wt% (EDX), 23 → 44 → 52 → 60 wt% (nanoTA), ≈40–50 → ≈60% (FTIR) over 0–20 mintablets and films, pH 2.1saboo2020 R21, R28, R17, M5
ritonavir–PVPVA 40% compactsurface ritonavir ≈35 → 72 wt% after 30 minXPS, pH 6.8yang2022a R14
grazoprevir–HPMCAS co-precipitates and one solvent-evaporated dispersion, eight materialssurface drug ≤34% with ≈47–72% release; ≥53% with ≈8–17%XPS; two-stage release at 90 minhiew2023 R14
ritonavir–PVPVA–SDS 40–60–10surface SDS ≈60 → 98 wt%; ritonavir ≈41 → 40% on a drug-plus-polymer basisXPS; ATR-FTIR, before and after 30 minyang2023 R17, R19
bedaquiline–HPMCAS-MF 40%surface drug 32 ± 2 → 55 ± 2 wt%XPS, 1 h in pH 6.5 bufferkaur2025 R20
grazoprevir–HPMCAS 75:25 particles with five excipients≈32–50% before SGF, ≈46–69% afterXPShiew2025 R14
Pitfalls and disagreements

Surface and bulk composition may differ, and surface enrichment retards release [li2019 C52]. XPS and pyrene fluorescence see only the near-surface region, and the ATR-FTIR evidence for the lopinavir-rich barrier comes from a drug-drug melt without polymer, not from the granules li2020 C34, R24; trasi2019 X7. The 15:85 nilvadipine surface started polymer-rich (2% drug against 15% nominal) saboo2019 X13. No XPS was done at the first failing ledipasvir loading (7.5%) que2019 X21. The PVPVA felodipine tablet started with more surface chlorine than the other four saboo2020a X16. For the spray-dried ITZ particles surface composition and morphology change together bhardwaj2018 X12. The indomethacin methods probe about 50 nm to 1 µm, on tablets and films, so the value at 20 min is best quoted as about 60–72 wt% saboo2020 X15; the EDX conversion factor is unstated saboo2020 X3. The drop in cinnarizine protonation after partial dissolution was linked to surface drug enrichment that the 2024 paper did not show bapat2024 X7. The bedaquiline enrichment comes from a 40% dispersion that was not release-tested kaur2025 X9, X10.

← Concepts and formulas

concept · as used in Dissolution

surface molecular mobility

The mobility of molecules at the free surface of an amorphous solid, which is taken to be much higher than in the bulk and to be the reason why crystals nucleate and grow faster at a surface (see surface crystallization) [duong2022c C2]. In the coating papers it is the mechanism proposed for the protection by an atomic layer coating: the shell lowers surface mobility, "attributed primarily" in the study of four systems and "perhaps more importantly" than a moisture barrier in the ezetimibe study [moseson2022a C4, C44; duong2022c C53, C54]. Water raises mobility and lowers the wet glass transition temperature, so a coating that acts on the surface cannot rescue a powder whose bulk is mobile [moseson2022a C41, C25].

Findings

F43, F44.

Related concepts

reduced by the atomic layer coating; raised by plasticization by water; drives surface crystallization; the alternative explanation is the moisture barrier effect.

Formulas

Tg − T.

How it is measured or obtained

Not measured in any ASD process paper [moseson2022a C4; duong2022c X7]. It is inferred from crystallization onset in coated and uncoated powders and from the wet Tg minus the storage temperature, computed with the onset Tg after 24 h at the storage humidity (see Tg − T) [moseson2022a P6, E2, R11, R12].

Values in the library
materialvalue or classconditionspaper ids
erlotinib–HPMCAS, 75% RHwet Tg − T about −8.8 °C; coated onset about 3 weeks (uncoated about 2)40 °C[moseson2022a R12, R11]
erlotinib–HPMCAS, 43% RH−2.3 ± 1.1 °C; coated none at 48 weeks40 °C[moseson2022a R12, R11]
erlotinib–PVPVA, 43% RH−0.5 ± 1.2 °C; coated onset about 6 weeks40 °C[moseson2022a R12, R11]
naproxen–HPMCAS 75% RH; lumefantrine–PVPVA 43% and 31% RHabout +11.3, +10.7 and +14.3 °C; coated 24 weeks, 24 weeks and none at 48 weeks40 °C[moseson2022a R12, R11]
uncoated powders of all four systemscrystals within about 1–2 weeks whatever Tg − T40 °C, 31–75% RH[moseson2022a R11, X15]
Pitfalls and disagreements

The authors write that "this confirms that the mobility of the sample was the primary mechanism" of the coated failures [moseson2022a C25]; uncoated powders failed in 1–2 weeks across the whole range of Tg − T, the stable erlotinib–HPMCAS arm at −2.3 °C lies outside the range of about 0–15 °C that the discussion gives, and whether the wet Tg was measured on coated or uncoated powder is not stated [moseson2022a X15, C45]. The ezetimibe study offers both mobility and a moisture barrier and could not separate them [duong2022c C53, C54, X7].

← Concepts and formulas

concept · as used in Dissolution

surfactant partitioning into the drug-rich phase

Evidence table: surfactant partitioning into the drug-rich phase. Content from the release-mechanism chapter (2022–2025), with rows from the Physical stability chapter.

The uptake of a surfactant into the drug-rich phase, nanodroplets in solution or drug-rich domains in a hydrated dispersion, read from its depletion from the aqueous phase or from its spectral bands in the drug-rich phase. TPGS was depleted from the aqueous phase by clopidogrel nanodroplets, and the droplets hold about 50:17 w/w drug:TPGS correasoto2022a C19, R12; non-ionic surfactants partition into the clopidogrel-rich phase while ionic ones act at the nanodroplet–water interface correasoto2022a C60. For atazanavir, PVPVA and VP did not partition into the nanodroplets within detection limits, TPGS solution concentration was only minimally affected, and Span 20, Span 80 and Span 85 "seemed to" partition into them correasoto2022b C26, R17. In ritonavir films (Physical stability chapter) the most hydrophilic surfactant, SDS, resides mainly in the polymer-rich phase and the more hydrophobic ones preferentially in drug-rich domains [yang2022b C61]. The 2023 surfactant study builds on the vapour-sorption finding that Span 20 and Span 85 partition into the ritonavir-rich phase: a continuous drug-rich layer containing Span 85 "is expected to be more liquid-like" and is removed by shear yang2023 R24, C18, C35.

Findings

Release mechanism and LoC: F16, F21, F31.

Related concepts

distinct from micellar solubilization; may slow drug-rich phase coarsening; changes the phase separation morphology of surfactant-containing dispersions; related to the hydrophilic-lipophilic balance of the surfactant.

Formulas

none.

How it is measured or obtained

Quantitative ¹H NMR of the surfactant left in solution with and without nanodroplets, with HPLC after pelleting the droplets correasoto2022a R12; correasoto2022b R17; NMR peak shifts of drug and surfactant at 50 °C correasoto2022a R13, C18; O-PTIR spectra of the separated phases of films (Physical stability chapter) [yang2022b C46].

Values in the library
materialvalue or classconditionspaper ids
70 µg/mL clopidogrel with 50 µg/mL TPGSaqueous TPGS 50 → 33 ± 5.4 µg/mL; droplets ≈50:17 w/w drug:TPGSqNMRcorreasoto2022a R12
200 µg/mL atazanavir with PVPVA, VP, SDS, TPGSadditive in solution reduced by 1, 0, 7, 13%¹H NMR, 37 °Ccorreasoto2022b R17
200 µg/mL atazanavir with 20 µg/mL Span 20, Span 85, Span 80reduced by 65, 25, 68%; droplets ≈29:3, 60:4, 62:5 drug:Span by weightsamecorreasoto2022b R17, R19
ritonavir–PVPVA films with SDS; Tween 80 and Spans (Physical stability chapter)SDS only in the polymer-rich phase; Tween 80 and the Spans in the ritonavir-rich phaseO-PTIR[yang2022b C46]
Pitfalls and disagreements

Partitioning did not predict release enhancement for atazanavir: SDS shows little affinity for the drug and Span 80 partitions into the droplets, and both enhance release correasoto2022b C45. With the Spans the amorphous solubility of atazanavir fell by about 28% (64 to 46 µg/mL) correasoto2022b R18. The temperature of the TPGS depletion measurement is not stated correasoto2022a R12.

← Concepts and formulas

concept · as used in Dissolution

ternary phase diagram

A phase diagram of three components

In the ASD process chapter the authors sketch drug–solvent–water for the preparation route and drug–water–polymer for storage, with the phase boundaries only (kinetics not considered) to show how trace water moves the system across the binodal [li2017 C38, C42]. New aspect (Release mechanism and LoC): Yang and co-workers (2021) use the drug–polymer–water diagram as "an alternative explanation" for the fall of the loratadine limit of congruency at 5 °C: because the diagram changes with temperature (cited), drug–polymer miscibility in the presence of water may fall at low temperature, giving a drug-rich phase at lower loading yang2021 C36. They expect drug Tg to act on kinetics and hydrogen-bonding ability on thermodynamics and the ternary diagram, and call for work to separate the two yang2021 C38. Deac and co-workers (2023) drew schematic hydration paths in the type I drug–PVPVA–water diagram: straight toward the water vertex for congruent dispersions, deviating within the two-phase region for incongruent ones, and the side of the plait point at which the path enters decides whether the hydrophobic phase is continuous deac2023a C66, C67, C68. Drug–PVPVA–water systems typically form type I diagrams with PVPVA acting as cosolvent, and real systems are likely to have sloped tie lines; associative separation gives positively sloped tie lines with the plait point on the low-drug side, segregative separation negatively sloped ones with the plait point on the high-drug side deac2023b C31, C48. The 2024 phase-diagram paper measured the drug–PVPVA–water diagrams of phenolphthalein (PHPH) and its methyl ether (MePHPH) at 37 °C from dispersion–buffer mixtures equilibrated for up to 147 days and computed all four analogue diagrams with PC-SAFT, each fitted to one dilute tie line; all share fully miscible polymer–water and drug–polymer binaries and a drug–water gap that closes as PVPVA increases deac2024b P4, P19, R22, R23, R24. The 2023 surfactant study argues on a schematic ritonavir–PVPVA–water diagram that SDS enlarges the miscible region yang2023 C42.

Findings

ASD process: F2, F6, F20. Release mechanism and LoC: F18, F27, F30, F31.

Related concepts

shows the binodal; used with moisture-induced phase separation. The thermodynamic alternative to the wet glass transition temperature as the cause of a lower limit of congruency at low temperature; shifted by drug-polymer hydrogen bonding.

Formulas

none.

How it is measured or obtained

Not measured in the ASD process papers; the schematic uses the Raoult's-law uptake of water by methanol and the observed thresholds [li2017 C39]. In the release-mechanism papers: not measured in the 2021 loratadine study, where it is argued from the temperature dependence of the limit yang2021 C36. In 2024: equilibrated mixtures separated by centrifugation and analysed by quantitative ¹H NMR and HPLC (binodes and tie lines), films at stepped RH for the onset at low water, and PC-SAFT computation of binodal, spinodal and critical point deac2024b P4, P7, P8, P19.

Values in the library
materialvalue or classconditionspaper ids
ECP–methanol–watertrace water moves the system from A to B (still miscible); spin coating carries it along B → D across the binodal at C; water spiking along A → B → E separates at Eschematic[li2017 C38]
ritonavir–PVPVA–waterhydration paths from different DLs enter the two-phase regionschematic from outside[yang2022b C50]
MePHPH–PVPVA–waterPC-SAFT binodal, spinodal and tie lines at 37 °Ccomputed and measureddeac2024b R22
drug–PVPVA–water systemstypically type I diagrams (drug–water immiscible, PVPVA a cosolvent)outsidedeac2023b C31
ritonavir–PVPVA–solvent (pseudo-ternary, solvent = methanol + water)at 11.5:88.5 the 25% DL path bypasses the two-phase region and the 50% DL path runs along its edge; at 15:85 and 30:70 both lie inside for most of their lengthcomputedli2020 R18, C55
loratadine–PVPVA; –HPMCASlimit 30 → 2%; 20 → 5% from 37 to 5 °Ccompactsyang2021 R22, C36
MePHPH–PVPVA–watersegregative; critical point ≈29 wt% drug, 59 wt% PVPVA, 12 wt% watermeasured and PC-SAFT, 37 °Cdeac2024b R22
PHPH–PVPVA–waterassociative; critical point ≈2.6 wt% drug, 59.5 wt% PVPVA, 38 wt% watersamedeac2024b R23
TIPP, MeTIPP–PVPVA–waterplait point ≈10 and ≈23 wt% drugPC-SAFT from one tie-line slopedeac2024b R25
Pitfalls and disagreements

The diagram is much more complex with polymer and with both volatile solvents (quaternary or higher) [li2017 C36]. The pseudo-ternary treats total solvent as one corner, so the water to methanol ratio is not shown on the axes li2020 P12. The kinetic reading (loratadine glassy below its wet Tg of 13.8 °C) and the thermodynamic reading (lower miscibility at 5 °C) were not separated yang2021 C16, M1, C36, C38. No ternary diagram was measured for the phenolphthalein analogues in 2023; the diagrams are schematic deac2023b X14. For PHPH the measured gap is smaller than computed, and the TIPP slope was measured at pH 2.5 deac2024b C34, X10.

← Concepts and formulas

concept · as used in Dissolution

Tg-scaled crystal growth rate

Crystal growth rate plotted against the distance from each system's own glass transition, T - T_g, so that the part of an additive's effect that comes from shifting Tg is removed and the remainder can be compared [mosqueragiraldo2014 P7, R12].

Findings

F5, F22, F28.

Related concepts

depends on glass transition temperature; used to test plasticization; contrasts with kinetic versus thermodynamic control of crystal growth; part of crystal growth rate.

Formulas

none.

How it is measured or obtained

Growth rates measured at fixed temperatures are shifted by the DSC Tg of each mixture [mosqueragiraldo2014 P7, R5, R12].

Values in the library
materialvalue or classconditionspaper ids
celecoxib alone and with 10% sucrose palmitate, SLS, TPGS≈0.020, ≈0.014, ≈0.039, ≈0.17 µm/s at T - T_g ≈25 °Cseeded melt growth[mosqueragiraldo2014 R12]
same≈12, ≈3.2, ≈13, ≈7.4 µm/s at T - T_g ≈65 °Csame[mosqueragiraldo2014 R12]
celecoxib with 10% PVP and with PVP plus TPGSTPGS–PVP about two orders of magnitude below PVP at T - T_g ≈26–28 °Csame[mosqueragiraldo2014 X4, R12]
DPB, griseofulvin, celecoxib with 5–10% PHBrates against T − Tg close to the pure compounds; 20% PHB and 5% PVAc belowmelt films[sato2016 R10, C21]
Pitfalls and disagreements

The authors call the corrected surfactant curves "fairly close", but they still span about 12-fold at 25 °C above Tg, against about 85-fold at equal temperature (70 °C), so the correction removes about half of the spread on a log scale (synthesis) [mosqueragiraldo2014 X4, C30, R1]. Tg differences below about 1 °C are unresolved [mosqueragiraldo2014 X7]. The scaling ignores the driving force, which falls with melting-point depression [mosqueragiraldo2014 C33].

← Concepts and formulas

concept · as used in Dissolution

thermodynamic activity

The activity of the drug in a phase, the product of its mole fraction and activity coefficient, a_i = x_i\gamma_i, or of concentration and activity coefficient, a = C\gamma; at phase equilibrium it is equal in all phases ilevbare2013a E6, E7; mosqueragiraldo2015 E5. In the LLPS picture the drug has the same activity in the water phase and in the drug-rich phase, which is why the water-phase concentration is capped and why added drug raises the amount of drug-rich phase and not the activity ilevbare2013a C36, C48; mosqueragiraldo2015 C35. Membrane flux is proportional to activity (F8) mosqueragiraldo2015 C10. The papers of 2017–2022 add that with micelles present the free drug sets the activity: in 3.6 mg/mL SDS the free atazanavir at the amorphous solubility was 65–70 µg/mL, the same as in buffer, although the total was about 1450 µg/mL (slope of free against total 0.047) indulkar2017a R11, and that bile salts change the telaprevir activity at a given concentration (flux about halved with 12 mM STDC) while the activity at the phase boundaries stays lu2017b R12, C49. New aspect (Bioperformance): membrane flux is proportional to the activity, a = \gamma C, so equal concentrations need not give equal flux when additives change the activity coefficient [raina2015c C14, E4]. Relative to the crystal, the activity in a one-phase supersaturated solution is C/C_S and is about 8 for felodipine at 25 °C at the amorphous solubility; above it the activity stays constant [raina2014a E10, R17, C35]. The enzalutamide, posaconazole, atazanavir and darunavir papers use the same relation to infer activity from flux: with area, diffusion coefficient, thickness and membrane activity coefficient fixed, J = D a/(h\gamma_m) [wilson2018 E4, E5, C12; elkhabaz2019b E3; alkalla2026 E2, C10].

Findings

Amorphous solubility and LLPS: F5, F8, F11, F12, F16, F17, F18. Bioperformance: F2, F3, F4, F6, F15, F18, F19, F20, F22, F25.

Related concepts

defined with the activity coefficient; related to chemical potential; read from membrane flux; capped by the amorphous solubility. Papers of 2017–2022: expressed as activity-based supersaturation; partition between phases in micelles: micelle/water partition coefficient. Related to free drug concentration.

Formulas

activity from concentration, membrane flux in terms of solute activity, activity-based supersaturation ratio.

How it is measured or obtained

Not measured directly in these papers: it is inferred from the flux across a membrane when diffusion coefficient, area, thickness and membrane activity coefficient are constant, or argued from the phase equilibrium mosqueragiraldo2015 C10; trasi2015a C14; ilevbare2013a X15. Flux across a 6–8 kDa regenerated cellulose membrane calibrated in buffer, up to the amorphous solubility, where the activity coefficient is taken as one; flux of a crystal-saturated solution F° gives δ = F/F° indulkar2017a P8, R10; lu2017b P6, E6. In the Bioperformance papers it is not measured directly: it is inferred from flux (plateau = constant activity) [raina2014a C36], from flux relative to a reference [raina2015c E9], or from free drug after ultracentrifugation [alhalaweh2016 P10]. The activity-based maximum supersaturation is the ratio of the flux from a solution at the amorphous solubility to the flux from a crystalline suspension, J_{amph}/J_{eq} elkhabaz2019b E4, R7; the mass flow of a dissolved formulation gives its donor activity [wilson2018 C12]. Free monomeric drug is taken as the permeating species [ueda2020a C24; hate2022 C41].

Values in the library

None printed in this chapter; the activity of the water-saturated amorphous drug appears as the factor exp[−I(a2)] (0.22 for atazanavir to 0.999 for ibuprofen) indulkar2015 M2; almeidaesousa2015 M1. The papers of 2017–2022 add activity read from flux: free atazanavir 65–70 µg/mL at about 1450 µg/mL total in 3.6 mg/mL SDS (slopes of free against total 0.998, 0.181, 0.086 and 0.047 at 0, 1, 2 and 3.6 mg/mL SDS) at 37 °C indulkar2017a R11, and telaprevir with δ = C/C° in buffer (slope 1.011) and bile-salt media off the 1:1 line in 50 mM pH 6.5 buffer at 37 °C lu2017b R16, R17.

In the Bioperformance papers:

materialvalue or classconditionspaper ids
felodipineactivity relative to crystal about 8 (5.99/0.74 = 8.09)25 °C[raina2014a E10, R17]
felodipine suspensionssame low flux at about 1 and 40 µg/mL dissolvedcrystal fixes activity[raina2015c R4, C20]
atazanavir + SDSfree drug about 1 to about 65 µg/mL with and without SDS37 °Cindulkar2017a C19, R11
telaprevir, bile saltsdeviation from the buffer slope gives the activity coefficient changefluxlu2017b C41
atazanavir, posaconazole, six mediaJ_{amph}/J_{eq} about 50–56 and 29–37 while the concentration ratio fell to 14 and 537 °C, side-by-side cellelkhabaz2019b R7, R8, R9
enzalutamidemass flow rises up to about the amorphous solubility (42 µg/mL), then is roughly constant5 µg/mL HPMCAS, side-by-side cell[wilson2018 R13, C25]
atazanavir, nifedipine and three other drugs, PAMPAbreak from a linear rise at about the amorphous solubilitylipid-impregnated PVDF[hate2022 R1, C11, X13]
Pitfalls and disagreements

Total concentration with micelles or with a second drug present is not activity; the maximum extent of supersaturation in activity terms is not raised by a solubilizer, whereas the concentration ratio can fall [ilevbare2013a C54; raina2015c C29]. The activity coefficient in the dilute solution is assumed constant between the crystalline and the amorphous concentration ilevbare2013a C55. The free-drug and δ read-outs assume that only dissolved drug crosses the membrane and that the additive does not change it indulkar2017a X9; lu2017b X8. Constant activity above the amorphous solubility is an inference from flux [raina2014a X12]; it fails in the hollow-fibre module, where transfer keeps rising (F15) [hate2018 C25]. With a sink receiver the PAMPA mass flow of atazanavir kept rising above the amorphous solubility, so a plateau is not guaranteed (F22) [hate2022 R19, X8]. A crystalline co-drug or a polymer mixed into the drug-rich phase lowers the activity of the drug in it, and with it flux (F19, F20) [alkalla2026 C37; ueda2020a C24].

← Concepts and formulas

concept · as used in Dissolution

thermodynamic driving force for crystallization

The free-energy difference between the supercooled liquid (amorphous form) and the crystal, written ΔGv per unit volume or ΔG per mole or gram; it is zero at Tm and grows on cooling [baird2012 C32; vaneerdenbrugh2010a E2]. A larger driving force lowers the classical nucleation barrier [vaneerdenbrugh2010a E3, C39]. This draft comes from the crystallization-tendency chapter; for drugs in polymers the same quantity is lowered by mixing [konno2006 C34]. New aspect (PEG dispersions): in a dispersion in a crystalline polymer the driving force of the drug is lowered by melting point depression, because the supercooling at the storage temperature falls. Zhu and co-workers attribute the delayed crystallization of benzocaine in PEG to entropic mixing and favourable benzocaine–PEG interactions that depress its melting point (around 48 °C at the eutectic against around 89 °C for the neat drug), so that supercooling and driving force at 25 °C are much smaller; with a Tg of −31 °C they consider a thermodynamic rather than a kinetic cause "reasonable" [zhu2012 C32, C33]. New aspects (Miscibility and drug-polymer interactions): In a miscible dispersion the chemical potential of the drug, and so the driving force for crystallization, must be lower than for the pure amorphous drug, through the entropy of mixing and, if adhesive interactions exceed cohesive ones, the enthalpy; melting point depression is its visible sign [marsac2006b C38, C39]. In the PVP dispersions the predicted reduction is small: the Hoffman estimate "does not forecast a large reduction", especially at lower temperature, and is "most likely underestimated" because equilibrium depression is hard to reach at high polymer content [marsac2006b C41, C40]. At low polymer levels, where the melting point and Tg of the drug are unchanged, there "does not appear" to be a macroscopic effect on ΔG, so polymer effects on growth are not read as thermodynamic [kestur2010a C36, C41]. New aspect (Physical stability): for dispersions holding water, the driving force is framed as the degree of supersaturation of the drug in the polymer–water co-solvent, \sigma = (\mu^{1} - \mu^{0})/RT, which water raises as an anti-solvent; it was reasoned, not computed [marsac2008a E1, C26, C49, X4].

Findings

Crystallization tendency: F2, F6, F7, F13. PEG dispersions: F8, F9. Miscibility and drug-polymer interactions: F9, F10, F11. Physical stability: F2, F4, F18, F22, F28, F29.

Related concepts

measured by Hoffman equation; depends on enthalpy of fusion, entropy of fusion and degree of supercooling, which is reduced in a dispersion via melting point depression; part of classical nucleation theory; related to nucleation, crystal growth rate and heterogeneous nucleation; lowered by entropy of mixing; contrasts with kinetic stabilization; related to crystal growth inhibition by polymers, supersaturation, cosolvency and kinetic barrier to nucleation; balanced against mobility in kinetic versus thermodynamic control of crystal growth.

Formulas

Hoffman equation, classical nucleation barrier, entropy of fusion, solid-liquid equilibrium solubility equation, Flory-Huggins activity equation.

How it is measured or obtained

Mostly estimated with the Hoffman equation from Tm and ΔHfus [vaneerdenbrugh2010a E2; baird2010 E25; lu2016 E1]; from MDSC heat capacities, which agreed with the Hoffman estimate for felodipine and nifedipine [marsac2006a R11, C14]; as \Delta G \approx \Delta S_m\,\Delta T for growth analysis [trasi2014a E3]; for dispersions, from melting-point depression and Flory–Huggins mixing [marsac2006b C41; marsac2009 C34]. In the PEG dispersions it was not measured: the melting points are cited and the driving force is inferred from the phase diagram [zhu2012 C32, M3]. For the PVP dispersions, estimated with the Hoffman equation, for pure nifedipine from 0 to 180 °C and, with the depressed melting temperature, for 30 and 40% PVP [marsac2006b P8, E4, R12]; for the dispersions the melting temperature of the 40% PVP curve is not shown in the paper's own melting data [marsac2006b X5]. The unchanged offset melting point of physical mixtures with 3% polymer is taken as an unchanged driving force at a given temperature [kestur2010a R1, C36]. In the moisture papers: Hoffman estimates from Tm and heat of fusion for six drugs at 25 °C [rumondor2009c E3, M1]; crystal solubility in NMP and NMP–water as stand-ins for PVP and PVP–water [marsac2008a P8].

Values in the library
materialvalue or classconditionspaper ids
nifedipineΔG ≈−30, ≈−24, ≈−16 J/g at 0, 50, 100 °CMDSC and Hoffman[marsac2006a R11]
felodipineΔG ≈−18, ≈−13, ≈−7 J/g at 0, 50, 100 °CMDSC and Hoffman[marsac2006a R11]
34 drugsΔGv from −8.6 (lidocaine) to −54.7 J/cm³ (acetaminophen)Hoffman, 298 K[baird2012 M5, M12]
class I against class IIIΔGv ≈−0.40 against ≈+0.57 SD from the meanper volume, 293.15 K[baird2010 R22.g]
spin-coat classes I, II, III≈−0.29, ≈+0.29, ≈+0.13 SDper volume[vaneerdenbrugh2010a R20.e]
vemurafenib α; β≈−11.0; ≈−6.3 kJ/mol at about 115 °CHoffman, plotted as crystal minus liquid[lu2016 R22, X17]
nifedipine with 40% PVPreduction smaller than the nifedipine–felodipine differencemelting-point depression[marsac2006b C41]
drugs in PVPdriving force remains at most practical polymer contentsinteraction parameters[marsac2009 C34]
benzocaine in PEG 3350melting point depression from around 89 to around 48 °C at the eutecticcited[zhu2012 C32, M3]
ibuprofen; fenofibrate in PEG 3350melting point depression of about 30 °C; about 20 °C (text), about 24 °C (plot)eutectic[zhu2012 C34, X11]
nifedipine, pure; 30% PVP; 40% PVP−9.0, −8.4, −7.95 kJ/mol at 20 °C (zero at ≈171, ≈148, ≈128 °C)Hoffman, plot readings[marsac2006b R12]
nifedipine, pure; 30% PVP; 40% PVP−5.45, −4.1, −2.7 kJ/mol at 100 °Cas above[marsac2006b R12]
felodipine with 3% PVP, PVP/VA, HPMCAS, PVAcmelting point of physical mixtures unchanged (140.7–142.9 °C against 141.5 °C)offset, 1 °C/min[kestur2010a R1]
bifonazole, nimesulide with 5% polymersTg rise 0.4–2.2 °CDSC onset[kestur2011 R6, C12]
nifedipine, felodipine, droperidol, pimozide, indomethacin, ketoprofenHoffman ΔGc 8.2, 6.1, 9.2, 11.0, 8.1, 4.1 kJ/mol25 °C[rumondor2009c M1, M6, M3, M2, M4, M5]
nifedipine vs felodipine crystalsmole-fraction solubility 0.05 vs 0.10 in NMP: larger lattice term for nifedipine25 °C[marsac2008a R10, C35]
nifedipine and felodipine in PVPFlory–Huggins activity ≈0.84 and ≈0.83 at Φ 0.2χ −3.8, −4.2[marsac2006a R19]
acetaminophen and flutamide with 10% polymerTm barely changed, so the driving force is similar for all polymersDSC[trasi2012a R9, C19; trasi2012b R7, C33]
celecoxib with TPGS and PVPTm 12 °C lower; a smaller driving force "could contribute" to slower growth near TmDSC, melt growth[mosqueragiraldo2014 R5.f, C33]
six compounds with PHBdriving force inferred unchanged from Tm and IR ("can be inferred")DSC; IR[sato2016 C18, X11]
indomethacin polymorphsdifferences in growth persist after a driving-force normalizationmelt growth[tian2017 R11, C24]
Pitfalls and disagreements

The class trend is not monotonic: class II, not class III, had the least negative ΔGv in the solvent screen [vaneerdenbrugh2010a X10]. Pair comparisons of viscosity can be confounded by driving force [baird2012 X9]. Indomethacin has a larger driving force than felodipine yet crystallizes more slowly during dissolution alonzo2010 C42, and metastable vemurafenib β outgrows α despite α's larger driving force [lu2016 C52]. Low polymer levels barely change it, so polymer effects on growth are read as kinetic [kestur2010b C28]; thermodynamically stable dispersions are hard to achieve [marsac2009 C34]. For ibuprofen and fenofibrate in PEG the depression should lower the driving force, yet the onset in the dispersion is earlier than for the neat drug; the authors explain it by nucleation on crystalline PEG, not by the driving force [zhu2012 C34, C41]. The estimated solubilities of benzocaine (28%) and ibuprofen (25%) exceed the 20% loading, which the card's extractor notes as not discussed [zhu2012 X13, M3, M4]. The 40% PVP curve rests on a melting temperature not shown among the measured data [marsac2006b X5]. The unchanged-driving-force conclusion for 3% polymer uses the melting point of form I in physical mixtures while form II grows [kestur2010a X7]. The size of the lowering differs between the polymers (synthesis: contrast between papers): in PEG 3350 the melting point depression (benzocaine from around 89 to around 48 °C at the eutectic) is taken to make supercooling and driving force much smaller [zhu2012 C32, C33], whereas for PVP the predicted reduction is small [marsac2006b C41]. The driving force did not sort drugs by moisture-induced phase separation [rumondor2009c C32]. The supersaturation explanation of the nifedipine–felodipine ranking with water rests on NMP data and printed cosolvency fits that do not reproduce their points [marsac2008a X2, X4]. The celecoxib driving force was argued from Tm and not calculated [mosqueragiraldo2014 C33].

← Concepts and formulas

concept · as used in Dissolution

tie line

Evidence table: tie line. Content from the release-mechanism chapter (2023–2025).

The line on a ternary phase diagram joining the compositions of two phases in equilibrium; every overall composition on it separates into the same two phases. Real drug–PVPVA–water systems are "likely" to have sloped tie lines deac2023b C31; associative separation gives positively sloped tie lines and segregative separation negatively sloped ones deac2023b C48. Hydrating a dispersion to the binodal gives a hydrophobic phase that is not in equilibrium with a dilute aqueous phase, and PVPVA diffuses out of it until the polymer/drug ratio reaches that of the dilute-solution binode on the tie line deac2023b C53. Measured in 2024 for MePHPH–PVPVA (sloping down) and PHPH–PVPVA (sloping up) from equilibrated mixtures; each drug's PC-SAFT binary parameter was fitted to its most dilute tie line deac2024b R22, R23, P19.

Findings

Release mechanism and LoC: F27, F30.

Related concepts

joins two points of the binodal and ends at the critical point of the ternary phase diagram; used by the lever rule; its slope distinguishes associative phase separation from segregative phase separation.

Formulas

lever rule.

How it is measured or obtained

Not measured in the 2023 paper, where the slopes are drawn on schematic diagrams deac2023b X14; measured from equilibrated mixtures in 2024 deac2024b R22, R23. The binode compositions in dilute water are estimated from the polymer content of nanoparticles and of particles held in buffer deac2023b C52, R4, R5.

Values in the library
materialvalue or classconditionspaper ids
PHPH–PVPVA; MePHPH–PVPVA particlespolymer diffused out until about 72% and below 5% PVPVA, the hydrophobic binodal compositions48 h in buffer with PVPVAdeac2023b C52, R4, R5
MePHPH–PVPVA–waternegatively slopedmeasured and PC-SAFTdeac2024b R22
PHPH–PVPVA–waterpositively slopedsamedeac2024b R23
Pitfalls and disagreements

One schematic diagram of the 2023 paper uses horizontal tie lines although the text expects sloped ones deac2023b X14, C31. The binode drug loads stated in the text do not exactly match the nanoparticle data (PHPH "roughly 30" against about 22–30%) deac2023b X18. The tie line of the driest MePHPH mixture misses its total composition deac2024b C31, X3.

← Concepts and formulas

concept · as used in Dissolution

Tm − Tg temperature gap

The span between the melting point and the glass transition, the range a melt must cross to become a glass [trasi2014a C27]. If viscosity at Tg is similar for all compounds, a small Tm − Tg with a high viscosity at Tm means a high viscosity at the temperature of fastest growth and so a low maximum growth rate [trasi2014a C27].

Findings

F5, F12.

Related concepts

related to reduced glass transition temperature; related to melt viscosity and crystal growth rate.

Formulas

linear fit of melt viscosity on Tm − Tg.

How it is measured or obtained

From DSC Tm and Tg [trasi2014a M1; baird2012 M1].

Values in the library
materialvalue or classconditionspaper ids
ritonavir; tolazamide77; 154 °CDSC[baird2012 M34, M18]
chlorpropamide; celecoxib; ketoconazole108; 105; 105 °C, in classes I-B, II, IIIDSC[baird2012 M9, M14, M26]
slow and fast growth groups85–117 and 121–146 for drugs with viscosity dataDSC[trasi2014a R9]
class means I-A, I-B, II, III123 ± 11, 119 ± 11, 126 ± 20, 108 ± 16 °C, not significantly differentDSC[baird2012 R10]
Pitfalls and disagreements

The celecoxib Tm − Tg of 125 in one table conflicts with its own Tm and Tg (108) [trasi2014a X1], and the dibucaine row of another table repeats lidocaine [baird2012 X1]. The gap tracked growth groups but not the DSC classes (synthesis: compare R9 of trasi2014a with R10 of baird2012).

← Concepts and formulas

concept · as used in Dissolution

virtual bioequivalence

A simulated crossover study in a population of virtual subjects; a level passes when the 90% confidence interval of the test-to-reference ratio of Cmax, AUCt and AUC lies within 80.00–125.00% purohit2018 E10, P12. An absorptive dissolution test gives a second route: the test-to-reference ratio of receiver AUC with the 80–125% limits, at three volumes hate2019 R13, E6, C25.

Findings

F17, F28, F31.

Related concepts

assesses oral bioavailability; input from non-sink dissolution, residual crystallinity and absorptive sink.

Formulas

none.

How it is measured or obtained

24 virtual healthy fasted subjects, 5 mg, 50% CV on CYP3A parameters, Phoenix average bioequivalence purohit2018 P12.

Values in the library
materialvalue or classconditionspaper ids
generic vs Prograf, 100 mL inputfails from 20% crystallinity (AUC ratio about 70%)purohit2018 R13, R17
generic vs fresh generic, 100 mL inputfails from 10% (about 79.5%)purohit2018 R14, R17
generic vs both, 900 mL inputfails from 40% (about 69% and 74.5%)purohit2018 R15, R16, R17
tacrolimus (generic with residual crystallinity against Prograf), absorptive test20% crystallinity bioequivalent at 100 mL, not at 40 mL; 50% and 100% not at any volume; fresh generic above the limit at 240 mLhollow-fibre module, 240, 100, 40 mLhate2019 R13, C25
Pitfalls and disagreements

Two-way crossover with fixed limits, not the replicated reference-scaled design now required for narrow-therapeutic-index drugs purohit2018 C13, X14. Only the mean ratio was evaluated in the absorptive test, and the outcome depends on the volume, so a pass at one volume is not a pass at all (F28) hate2019 R13, C41.

← Concepts and formulas

concept · as used in Dissolution

water sorption correction of amorphous solubility

The factor e^{-I(a_2)} in Eq. 1, the activity of the amorphous drug once it has absorbed water to saturation; it is below 1 because water dilutes the amorphous drug, and lowers the predicted amorphous solubility ilevbare2013a C59, E1. The water-saturated supercooled liquid and the drug-rich phase made by LLPS have the same activity ilevbare2013a C61. The papers of 2017–2022 add that the water content of the ibuprofen-rich phase without polymer is negligible and has little impact on its amorphous solubility, and that the ibuprofen inputs of Eq. 1 come from H2O work while the measurements were in D2O ueda2021 R20; ueda2022 X6.

Findings

F5, F6.

Related concepts

computed with the Gibbs-Duhem equation from water sorption; enters the amorphous solubility; related to plasticization by water.

Formulas

amorphous solubility advantage with water-sorption correction, Gibbs-Duhem equation.

How it is measured or obtained

From a gravimetric water sorption isotherm of the amorphous drug (0–95% RH at the test temperature) by integrating the Gibbs–Duhem equation (the Murdande method) ilevbare2013a P2, P15; almeidaesousa2015 P7; indulkar2015 P7; mosqueragiraldo2015 P5; almeidaesousa2016 P8; hsieh2012 E5.

Values in the library
materialvalue or classconditionspaper ids
ritonavir; efavirenz; loratadine0.27; 0.44; 0.6037 °Cilevbare2013a M1, M2, M3
ketoconazole; indomethacin; felodipine0.28; 0.73; 0.8537 °Cilevbare2013a M8, M7, M9
ibuprofen to griseofulvin0.999, 0.997, 0.985, 0.932, 0.750, 0.69925 °Calmeidaesousa2015 M1, M2, M3, M4, M5, M6
clotrimazole; atazanavir0.82; 0.2237 °Cindulkar2015 M1, M2
telaprevir; CRH10.30; 0.75537 °C; 25 °Cmosqueragiraldo2015 M1; almeidaesousa2016 M1
atazanavirexp[−I(a)] 0.22; 5.2% moisture37 °Cindulkar2017a M2
Pitfalls and disagreements

The sorption isotherms and the integration are not shown, so the factor cannot be reproduced from the papers; only the ritonavir isotherm of the 2013 paper is shown ilevbare2013a M1, R7; mosqueragiraldo2015 X3. The griseofulvin and sorafenib water contents at water activity 1 are estimates with an unstated basis almeidaesousa2015 R8. For ibuprofen the predicted S0a/S0c lies below the measured one at every temperature, with D2O named as one possible reason ueda2022 R16, C37.

← Concepts and formulas

concept · as used in Dissolution

water sorption

The uptake of water vapor by an amorphous drug as a function of relative humidity; amorphous solids sorb more than their crystals, and the uptake sets both the activity of the water-saturated amorphous drug and the wet Tg ilevbare2013a C23, C59. The papers of 2017–2022 add dynamic vapor sorption of melt-made ibuprofen/PVP-VA and ibuprofen/HPMC 603 ASDs at 99% RH, used to test whether extra water explains the stronger effect of PVP-VA ueda2021 P6, R17. New aspect (ASD process): in the evacetrapib papers of 2017, low-DL dispersions are held to absorb more water because they contain more polymer, which is why they separate on storage while high-DL films stay miscible [li2017 C42, C52]. In the coating papers it is the uptake of coated and uncoated ASD powders in dynamic vapour sorption, as isotherms at 40 or 37 °C and as kinetics at 90% RH over 2–3 h (see moisture barrier effect) [moseson2022a R8, R9; duong2022c R9; moseson2023 R7, R8; benson2025 R3]. PVPVA ASDs sorb over three times as much water as HPMCAS ASDs benson2025 C42, R23. New aspect (Physical stability): one-phase drug–polymer blends sorb less water than the weighted sum of their components, while blends that have separated sorb close to additively [rumondor2010a C10; rumondor2009c C24]. New aspect (Release mechanism and LoC): in the release papers of 2021–2022 water sorption of the dispersion is read as a proxy for the water that enters the hydrating compact. Neat PVPVA sorbs much water at high water activity, its Tg falls below room temperature and it gels and dissolves rapidly (cited) que2021 C42; a drug–polymer interaction that persists in water is proposed to lower the water uptake and so the polymer dissolution rate que2021 C44. Surfactants slightly raised the water uptake of atazanavir–PVPVA correasoto2022b C25, and salt formation changed the uptake of amorphous lumefantrine by counterion hiew2022b C10. For HPMCAS-MF dispersions the drug was proposed to lower polymer release at higher buffer capacity by reducing the amount and rate of water the polymer absorbs, leaving a more viscous gel bapat2023 C46. Plasticizers changed the rate and extent of water vapour uptake of atazanavir–PVPVA dispersions only slightly, against suggestions that additives act through solvent ingress correasoto2023 C34, C35.

Findings

Amorphous solubility and LLPS: F2, F5, F20. ASD process: F6, F4, F43, F45, F47. Physical stability: F6, F7, F23. Release mechanism and LoC: F15, F22, F24, F26.

Related concepts

input to the Gibbs-Duhem equation and to plasticization by water; determines the water sorption correction of amorphous solubility. Governed by hygroscopicity; drives moisture-induced phase separation. Measured by water sorption isotherm; marker of amorphous-amorphous phase separation. Sets plasticization by water and so the wet glass transition temperature; needed for polymer chain disentanglement.

Formulas

Gibbs-Duhem equation, water plasticization rule of thumb, additive moisture sorption, Flory-Huggins water sorption isotherm.

How it is measured or obtained

Gravimetric vapor sorption (SGA-100) at the test temperature, 0–95% RH, equilibrium criterion about 0.01% weight change; the isotherm of ritonavir was extrapolated linearly from the high-water region to 100% RH ilevbare2013a P15, E14; almeidaesousa2015 P7; mosqueragiraldo2015 P5. In the ASD process papers: water absorbed by ASD powder in DSC pans after 24 h over saturated K2SO4 (procedure not printed), % w/w dry basis [li2017 P14]; equilibrium sorption of polymer powders by dynamic gravimetric sorption (see hygroscopicity) [mugheirbi2017 P14]. In the moisture-induced separation papers: plateau uptake at fixed RH (about 600 min for amorphous drugs, about 1000 min for dispersions) or isotherms at 25 °C [marsac2008a R3; rumondor2010a P2; rumondor2009c P11]. In the release-mechanism papers: dynamic vapour sorption at 37 °C up to 95% RH correasoto2022b R16 and at 5–95% RH for the neat amorphous salts hiew2022b R4.

Values in the library
materialvalue or classconditionspaper ids
ritonavirabout 4.98% at 95% RH; 5.21% extrapolated to 100% RH (slope 0.075, intercept −2.290)37 °C, melt-quenchedilevbare2013a R7, E14
telaprevir4.31% at 95% RH; about 4.6% estimated at 100% RHmelt-quenched glassmosqueragiraldo2015 M1
clotrimazole; atazanavir1.4%; 5.2%amorphous, 37 °Cindulkar2015 M1, M2
griseofulvin; sorafenib2.7%; 1.8% at water activity 1 (estimated, basis not stated)25 °Calmeidaesousa2015 R8
atazanavir5.2% moisture, exp[−I(a)] 0.22amorphous, 37 °Cindulkar2017a M2
ibuprofen/HPMC 603 and ibuprofen/PVP-VA ASDs13.9 and 13.0% (1/1); 6.5 and 4.2% (4/1) after 200 min99% RH, 37 °Cueda2021 R17
ECP–PVPVA powdersabout 61% (PVPVA), 35% (10% DL), 4–7% (20–50% DL), 0.5–3.6% (60–100% DL)24 h, 97–98% RH[li2017 R25, X3]
felodipine, indomethacin, PVP, HPMC, HPMCASFlory–Huggins water parameters from isotherms25 °C[rumondor2010a R11]
clofoctol–PVP with 70% API or more; probucol–PVPresistance to moisture-induced separation attributed to too little moisture sorbed by the hydrophobic systems; no water content or sorption was reported for those filmsoutside[rumondor2011 C36, X6]
70 wt% PVP felodipine dispersionwater vapour sorption isotherm at 25 °Coutside[marsac2010 R9, R10]
erlotinib–HPMCAS 60% DL, uncoated against 5–25 nm coatedabout 5.7 against 5.4%DVS 40 °C, 75% RH[moseson2022a R8, R9]
ezetimibe–HPMCAS 50% DL, uncoated / thin / thickabout 5.65 / 5.83 / 3.17%DVS 37 °C, 95% RH[duong2022c R9]
PCZ–HPMCAS 25% DL, uncoated and coated 11 / 23 / 39 nmabout 4.7 / 4.3 / 3.7 / 1.2% at 30 minDVS 37 °C, 90% RH[moseson2023 R7]
PCZ–HPMCAS 50% DL, slow-deposited 26 nmabout 0.33% at 2 h against about 4.2–4.5%same[moseson2023 R8]
RTV–PVPVA 20% DL powdersabout 18.8–20.8% at 3 h; slow-coated 20.5 nm about 15.1%90% RHbenson2025 R3
nifedipine; felodipine; with 25% PVP≈1.8; 1.1; 5.5; 4.6 g/100 g75% RH, 25 °C[marsac2008a R2]
felodipine–PVP 25%43–64% below additivity15–85% RH[rumondor2010a R7.b]
nifedipine-, pimozide-, droperidol–PVP5.9, 7.4, 0.2% from additivity (phase separated)95% RH[rumondor2009c R22]
indomethacin–PVP 75:254.9 vs 21.7 g/100 g predicted95% RH[rumondor2009c R22.g]
40% resveratrol–PVP dispersion≈1.8, ≈5.9, ≈8.7, ≈12.8% at 20, 60, 80, 95% RH, below its physical mixture at every step25 °C[wegiel2013b R19]
atazanavir–PVPVA 10%; with SDS or Span 8044%; 49% waterDVS, 37 °C, up to 95% RHcorreasoto2022b R16
amorphous lumefantrine salts≈6.6 (PEG 250 diacid 1:1), 3.3 (sulfate), below 2% (benzoate, besylate, tosylate, camsylate, HCl) at 95% RHDVShiew2022b R4
lumefantrine salt–PVPVA dispersions35–55% water, higher at lower loading95% RH, 40 °Chiew2022b R5
HP-50-Na; amine salts of HP-50; HP-50≈42.4; ≈24.6–30.1; ≈9.7% water at 96 hpowders, 100% RH, 37 °Cqi2022 R11
neat HPMCAS-MF; indomethacin and its methyl ester dispersionshighest extent and rate for the neat polymer; lower with indomethacin, lowest with the esterpowders, 95% RH, 37 °C, 12 hbapat2023 R20, C31
PVPVA; with 10% TBC; with 10% GTB≈41.8; ≈34.4; ≈32.0% water at 300 min95% RH, 37 °Ccorreasoto2023 R22
Pitfalls and disagreements

The relative humidity to which the % moisture of the weak-base table refers is not stated indulkar2015 M1, M2. Linear extrapolation to 100% RH is an approximation ilevbare2013a E14. In the film papers, uptake was measured on bulk powders, not on the films imaged by TEM, and the values at 20–50% and 60–80% DL differ by only a few per cent although separation was seen to 80% DL [li2017 X8, R19]. The same explanation (too little moisture sorbed at high loading) is given for other hydrophobic drug–PVP systems without sorption data [rumondor2011 C36, X6]. The thin 50% ezetimibe coating protected for two years without lowering uptake [duong2022c X7]. The slow-sorbing posaconazole samples had not levelled off within 2 h [moseson2023 X17]. The two moisture papers normalise the deviation from additivity differently (against the prediction, against the measured value) [rumondor2010a E6; rumondor2009c E6]. No sorption was measured on the films in which nucleation and growth were counted [marsac2008a X12]. The lower uptake of the resveratrol dispersion is read as hydrogen bonds suppressing sorption, but bonding in the wet dispersion was not measured [wegiel2013b C37, X18]. The dispersion sorption curves of both papers are in SI not supplied correasoto2022b R16; hiew2022b R5. The excess-acid PEG 250 diacid (1:1) salt liquified at 95% RH hiew2022b C10. Among the HP-50 salts the sodium salt took up the most water without dissolving faster, which weakens hydration as the explanation of the salt effect qi2022 X17, C35.

← Concepts and formulas

formula · as used in Dissolution

activity-based supersaturation ratio

Expression

SR = \frac{a}{a^{*}} = \frac{\gamma\,c}{\gamma^{*}\,c^{*}} indulkar2017a E9;

\ln\delta = \frac{\mu - \mu^{\circ}}{RT} = \ln\frac{a}{a^{\circ}} lu2017b E3;

from flux,

\frac{F}{F^{\circ}} = \frac{a}{a^{\circ}} = \delta lu2017b E6;

the ratio of flux slopes below the plateau gives the activity-coefficient ratio,

\frac{dF/dC}{\left(dF/dC\right)_{\mathrm{buffer}}} = \frac{\gamma}{\gamma_{\mathrm{buffer}}} lu2017b E7;

and the maximum value in a simple dilute solution,

\ln\delta_{\mathrm{Max}} = \ln\frac{C_{\mathrm{amorphous}}}{C_{\mathrm{crystalline}}} lu2017b E5.

In the Bioperformance papers the ratio is printed as

\ln S = \frac{\mu - \mu^{*}}{RT} = \ln\frac{a}{a^{*}} = \ln\frac{\gamma c}{\gamma^{*} c^{*}} [raina2015c E5];

below the amorphous solubility, with a constant activity coefficient, it reduces to \alpha = C_i/C_S [raina2014a E10].

In the bile-salt papers of 2016–2017 it is printed as

S = \frac{a}{a_{s^*}} = \frac{C\,\gamma}{C_{s^*}\,\gamma_{s^*}} li2016a E3

and again as \ln\delta = (\mu - \mu^{\circ})/RT = \ln(a/a^{\circ}) lu2017 E1.

In the Mesoporous silica papers it is printed as

\ln S = \frac{\mu - \mu^{*}}{RT} = \ln\frac{a}{a^{*}} = \ln\frac{\gamma C}{\gamma^{*} C^{*}} [dening2018 E5],

and in the same form [dening2019 E5].

In the ASD dissolution papers the activity is printed as the free drug concentration over the crystalline solubility,

a = \frac{C_i}{C_S} = S_i jackson2015 E2,

and the ratio as \ln S = \frac{\mu - \mu^{*}}{RT} xie2015 E4.

Variables and units

symbolmeaningunits
a, a^{*} (or a^{\circ})activity of the drug in the solution and in a solution saturated with the crystaldimensionless [indulkar2017a E9; lu2017b E3; dening2019 E5]
\gamma, \gamma^{*}activity coefficients at the two statesdimensionless [indulkar2017a E9; dening2019 E5]
c, c^{*} (or C, C^{*})concentrations at the two statesµg/mL [indulkar2017a E9; dening2019 E5]
F, F^{\circ}mass flow rate of the solution and of the crystal-saturated solutionµg/min lu2017b E6
\deltafundamental (activity-based) supersaturationdimensionless lu2017b E3
\mu, \mu^*chemical potential in the solution and at saturation with the crystalJ/mol [raina2015c E5; dening2018 E5]
C_i, C_Sconcentration and crystalline solubilityµg/mL [raina2014a E10]
S; a_{s^*}, C_{s^*}, \gamma_{s^*}supersaturation as an activity ratio; activity, concentration and activity coefficient at crystalline saturation (2016 notation)dimensionless; µg mL⁻¹ for C_{s^*} li2016a E3
C_i (danazol notation), S_ifree drug concentration (from flux); supersaturation, equal to aµg/mL; dimensionless jackson2015 E2
R, Tgas constant, temperatureJ/(mol K), K xie2015 E4

Assumptions and valid domain

The concentration ratio equals SR only if γ/γ* = 1; flux is proportional to activity with D, S, h and γm constant and sink conditions; F° is the same with and without the additive; the buffer series (γ = 1 up to the amorphous solubility) calibrates media with unknown activity coefficient indulkar2017a C20, C37; lu2017b C11, C36, C37. Tested for atazanavir in SDS at 37 °C and for telaprevir with six bile salts at 37 °C indulkar2017a A1; lu2017b A1. The activity coefficient is constant between the crystalline and the amorphous solubility ("a reasonable assumption for these highly dilute solutions") [raina2014a C34]. Reduces to C/C_s only when the activity coefficients of the supersaturated and the saturated solution are equal, which surfactants can upset; the activity is taken from the membrane flux li2016a E3, R39; lu2017 E1, E2. In the Mesoporous silica papers the relation is used as an argument about adsorption rather than to compute a number. Because the chemical potential of dissolved drug equals that of drug in any phase in equilibrium with it, adsorption to silica is taken to lower the achievable chemical potential, so the driving force for desorption falls as S rises ("it appears", "it is clear") [dening2018 C56]. Conversely a higher S raises the drug's activity and the driving force for adsorption onto the high-energy silica surface ("can be proposed") [dening2019 C39]. In the ASD dissolution papers the activity is estimated as free concentration over crystalline solubility (cited) jackson2015 E2; the ratio is printed together with S = c/c^{*} for dilute solutions, without a stated assumption xie2015 E4, E5.

Use in the library

paperused forvalues or fitted parametersstatus / recomputed
indulkar2017aSRactivity and SRconc of atazanavir in 0–3.6 mg/mL SDSSRactivity about 65–70 at the amorphous solubility; SRconc 33–38 in SDSreproduces (1450 ÷ 45.6 = 31.8 against about 31.0 and 33.0 in Figs. 7a, 7b) indulkar2017a E9, R12, R13
lu2017bδ of telaprevir from fluxbuffer slope 1.011, R² 0.9928; δ about 28 at the boundary (22 with STCDC, SGCDC)reproduces (F° = 0.009 × 5.2 = 0.0468 µg/min; F ≈ 1.24 µg/min at 140 µg/mL gives δ ≈ 26.5; 148 ÷ 5.2 = 28.5) lu2017b E5, E6, R16, R18
lu2017bactivity-coefficient ratio from flux slopesslopes not printedinputs not printed lu2017b E7
other chaptersthe same relation printed as an activity ratio or a chemical-potential differencenoneprinted; not recomputed here [raina2014a E10; raina2015c E5; jackson2015 E2; lu2017 E1; wilson2018 E7; elkhabaz2019b E2; indulkar2019b E1]
raina2014aactivity of felodipine5.99/0.74 = 8.09 (text about 8); 2/0.74 = 2.70reproduces [raina2014a E10]
raina2015cdefining Snonenot applicable [raina2015c E5]
jackson2015danazol activity8.1/0.9 = 9.0 against about 8.9reproduces jackson2015 E2
wilson2018enzalutamideS printed "approximately 13" from the Table 2 ratiomismatch: 42/2.9 = 14.5; 13 matches the theoretical 39/2.9 [wilson2018 E7, X2]
elkhabaz2019batazanavir and posaconazole in six mediaread as J_{amph}/J_{eq}; \gamma not determinedinputs not printed elkhabaz2019b E2, C28
li2016aapparent S' = C/C_s with γ ratio set to 1, tested against mass flownevirapine S' 7.1–8.7; celecoxib printed 13.6 against 16.7 recomputedinputs not printed for γ; mismatch for celecoxib li2016a E1, X1, X18
lu2017δ 11.5 and 28.8 for telaprevir with six bile saltssee the flux-ratio formulacalibrated from flux lu2017 E1, R1
indulkar2018supersaturation in lecithin and SIF mediaSR = a/a^{*}, crystalline standard stateinputs not printed indulkar2018 E1
indulkar2019batazanavir in SDSas abovestated about 65, flux not shown indulkar2019b E1, X6
elkhabaz2021cited for atazanavir and posaconazole in six medianamed only54; 36 and 30 elkhabaz2021 E8, R4
duong2022bposaconazole in micellar mediaestimated from the concentration ratio with Km/w falling linearlyinputs not printed duong2022b E11
dening2018falling released fraction with dose from silicanoneinputs not printed [dening2018 E5]
dening2019adsorption onto silica rising with supersaturationnoneinputs not printed [dening2019 E5]
jackson2015maximum supersaturation of danazol dispersionseight bars equal free drug over 0.9 µg/mL; 90:10 HPMCAS and 50:50 HPMC do notreproduces in part jackson2015 R10, X3
xie2015definition of the driving force for celecoxib nucleationnonenot applicable xie2015 E4, C43

Where it fails or is disputed

F° is not shown and for SGCDC cannot be the same at 1.86 and 12 mM, so part of the offset between δ and C/C° reflects the solubility–flux mismatch lu2017b X7. The conversion needs a membrane that passes only dissolved drug indulkar2017a X9; lu2017b X8. Free-drug and SRactivity values at intermediate totals differ by up to about 40% between the two figures of the atazanavir paper indulkar2017a X12. Activity coefficients are not printed in the Bioperformance papers; with micelles or complexes \gamma/\gamma^* \ne 1 [raina2015c C36]. In the media study the gap between this ratio (read from flux) and the concentration ratio is the only access to \gamma/\gamma_{eq} (F18) elkhabaz2019b C21, C28. The concentration ratio fails for celecoxib with bile salts and HPMCAS, where the solubility rises but the mass flow does not; the activity coefficients are not printed li2016a X18, E3. The formula is also printed by ten papers outside the crystallization-from-solution chapter (see the evidence table). In the silica papers the chemical potential or activity of adsorbed drug and of drug in the adsorption samples was not measured, so both uses are arguments [dening2018 C56; dening2019 C39]. For the danazol dispersions the result depends on the crystalline solubility used, 0.9 or 1.0 µg/mL (about 10%) jackson2015 X15.

Concepts

activity-based supersaturation, supersaturation, maximum achievable supersaturation, chemical potential, thermodynamic activity, drug adsorption onto silica, free drug concentration. Findings. Amorphous solubility and LLPS: F16, F17. Bioperformance: F2, F3, F18. Crystallization from solution: F31, F32, F34, F40, F43. Mesoporous silica: F4, F8. Supersaturation from ASD dissolution: F4, F7.

← Concepts and formulas

formula · as used in Dissolution

activity from concentration

Expression

a_{i1} = x_i\,\gamma_{i1} ilevbare2013a E7;

a = C\,\gamma mosqueragiraldo2015 E5.

The papers of 2017–2022 print the same relation as

a = \gamma\,c indulkar2017a E8

and as

a = C\,\gamma lu2017b E2.

In the Bioperformance papers of 2014–2016 it is printed as

a = \gamma\,C [raina2014a E7; raina2015c E4; alhalaweh2016 E2].

Variables and units

symbolmeaningunits
athermodynamic activity of the drugdimensionless mosqueragiraldo2015 E5
x_imole fraction of the componentdimensionless ilevbare2013a E7
Cconcentration of the drug in the donor solutionµg/mL mosqueragiraldo2015 E5
\gammaactivity coefficient in the bulk (donor) solutiondimensionless mosqueragiraldo2015 E5

Assumptions and valid domain

None stated for the definition; the amorphous solubility treatment assumes a constant activity coefficient in the dilute solution between the crystalline and the amorphous concentration ilevbare2013a C55; mosqueragiraldo2015 C10. In the Bioperformance papers γ equals 1 in a dilute solution without solubilizers; with micelles or protein it does not [raina2015c C32, C36].

Use in the library

paperused forvalues or fitted parametersstatus / recomputed
ilevbare2013aactivity of a species equal in all phases at equilibriumnonenot applicable (no numerical output) ilevbare2013a E6, E7
mosqueragiraldo2015donor activity in the flux equationnone printedinputs not printed (γ) mosqueragiraldo2015 E5
indulkar2017afree atazanavir in SDS from the slope γ of free against total drugγ 0.998, 0.181, 0.086, 0.047 at 0, 1, 2, 3.6 mg/mL SDSreproduces (0.047 × 1450 µg/mL = 68 against about 70 plotted free) indulkar2017a E8, R11
lu2017bactivity of telaprevir in bile-salt medianone printedinputs not printed (γ) lu2017b E2
raina2014aflux proportional to activityγ not printednot applicable [raina2014a E7]
raina2015cwhy equal concentrations give different fluxγ not printednot applicable [raina2015c E4]
alhalaweh2016Caco-2 flux of ritonavir–atazanavir mixturesγ not printedinputs not printed [alhalaweh2016 E2]

Where it fails or is disputed

γ was not measured in either paper, so activity is only inferred, from the flux plateau mosqueragiraldo2015 C10; ilevbare2013a X15. γ in the micellar solutions is estimated with the ideal dilute solution as standard state and from a buffer calibration, not measured independently indulkar2017a R11, C18. In the Bioperformance papers γ was never measured directly. In the media study the activity-based and concentration-based supersaturation ratios agreed in buffers and diverged in micellar media, so γ/γ_eq departs from 1 there (F18) elkhabaz2019b C28, C42.

Concepts

thermodynamic activity, activity coefficient, membrane flux, micellar solubilization. Findings. Amorphous solubility and LLPS: F8, F12, F16. Bioperformance: F3, F18.

← Concepts and formulas

formula · as used in Dissolution

amorphous-crystalline free energy difference from heat capacity

Expression

With linear reversing heat capacities C_p^{sl} = aT + b and C_p^{c} = cT + d almeidaesousa2015 E6, E7, the crystal-to-supercooled-liquid change at T is

\Delta H_{c\to sl} = \Delta_{fus}H + \frac{aT^2 + 2bT}{2} - \frac{aT_m^2 + 2bT_m}{2} + \frac{cT_m^2 + 2dT_m}{2} - \frac{cT^2 + 2dT}{2} almeidaesousa2015 E9,

\Delta S_{c\to sl} = \frac{\Delta_{fus}H}{T_m} + (T_m - T)(c - a) + \ln\left(\frac{T_m}{T}\right)(d - b) almeidaesousa2015 E10,

\Delta G_{c\to sl} = \Delta H_{c\to sl} - T\,\Delta S_{c\to sl} almeidaesousa2015 E11.

A glass version uses C_p^{g} = eT + f below Tg almeidaesousa2015 E8, E12, E13, E14. The integral form printed for telaprevir is

\frac{\Delta G_{a\to c}}{RT} = \frac{\Delta H_f}{RT}\left(1 - \frac{T}{T_m}\right) + \frac{1}{RT}\int_{T_m}^{T}\Delta C_p\,dT - \frac{1}{R}\int_{T_m}^{T}\frac{\Delta C_p}{T}\,dT mosqueragiraldo2015 E3.

Variables and units

symbolmeaningunits
a, b; c, d; e, flinear fit parameters of the reversing Cp of supercooled liquid, crystal, glassJ mol⁻¹ K⁻¹ and J mol⁻¹ K⁻² almeidaesousa2015 E6, E7, E8
\Delta_{fus}H, T_menthalpy of fusion, melting temperaturekJ/mol, K almeidaesousa2015 E9
\Delta H, \Delta S, \Delta Gconversion enthalpy, entropy, free energy at TkJ/mol, J mol⁻¹ K⁻¹, kJ/mol almeidaesousa2015 R12

Assumptions and valid domain

Cp linear in temperature over the range of interest (shown for tolnaftate only); un-ionized, non-solvated crystal that melts without degradation; only the reversing Cp is used because the entropy change is the reversibly exchanged heat divided by T almeidaesousa2015 C10, C11, E17. For much larger undercooling the form with a 1/T^2 term is better almeidaesousa2015 E5, C10.

Use in the library

paperused forvalues or fitted parametersstatus / recomputed
almeidaesousa2015six drugs at 25 °C; sorafenib and griseofulvin also to the glassΔG 3.56–10.34 kJ/mol (to supercooled liquid); 11.37 and 10.38 kJ/mol (to glass)ΔG = ΔH − TΔS reproduces from Table 7 (9.39 kJ/mol for griseofulvin); parameters a–f not printed almeidaesousa2015 E11, R11, R12
mosqueragiraldo2015telaprevir at 37 °C97 ± 8 and 189 ± 16 µg/mL through Eq. 1ΔCp values not printed mosqueragiraldo2015 E3, R13
almeidaesousa2016CRH15.85 and 5.95 kJ/molmethod named only, parameters not printed almeidaesousa2016 E5, M1

Where it fails or is disputed

The method's superiority is concluded on the hypothesis that the onset is governed by the supercooled liquid, and neither ΔG nor the amorphous solubility was determined independently almeidaesousa2015 X4. Eq. 4 is printed with a symbol clash with Eqs. 5–7 and is not used almeidaesousa2015 X13.

Concepts

amorphous-crystalline free energy difference, supercooled liquid, structural relaxation. Findings. F7.

← Concepts and formulas

formula · as used in Dissolution

amorphous solubility advantage from free energy difference

Expression

\ln x_{SL,L_1} = \ln x_{C,L_1} + \frac{\Delta G_{a\to c}}{RT} ilevbare2013a E5;

\frac{\mu_1^{\circ} - \mu_{1c}^{\circ}}{RT} = \ln\frac{S_a}{S_c} trasi2015a E1;

\frac{S_{amorphous}}{S_{crystalline}} \approx \frac{a_{amorphous}}{a_{crystalline}} = \exp\left[\frac{\Delta G_c}{RT}\right] hsieh2012 E4; hsieh2014 E3.

The ASD dissolution papers print it as

\Delta G_c = RT\ln\frac{a_{\mathrm{amorphous}}}{a_{\mathrm{crystalline}}} \approx RT\ln\frac{S_{\mathrm{amorphous}}}{S_{\mathrm{crystalline}}} konno2008a E1;

\frac{\sigma^{\mathrm{amorph}}}{\sigma^{\mathrm{crystal}}} = e^{\Delta G/RT} alonzo2011 E2;

\frac{S_A}{S_C} = \exp\left(\frac{\mu_A - \mu_C}{RT}\right) li2018 E2;

\Delta G = -RT\ln\left(\frac{C_a}{C_s}\right) duong2022a E1.

Variables and units

symbolmeaningunits
x_{SL,L_1}, x_{C,L_1}mole-fraction solubility of the supercooled liquid and of the crystal in waterdimensionless ilevbare2013a E3, E4
\Delta G_{a\to c}free-energy difference amorphous–crystalilevbare2013a E2
\mu_1^{\circ}, \mu_{1c}^{\circ}chemical potential of pure amorphous (supercooled liquid) and crystalline drugtrasi2015a E1
S_a, S_camorphous and crystalline solubilityµg/mL trasi2015a E1, R1
S_{amorphous}, S_{crystalline}solubility of the amorphous and crystalline formsµg/mL hsieh2012 E4
a_{amorphous}, a_{crystalline}thermodynamic activity of the solid formdimensionless hsieh2012 E4
\Delta G_cfree-energy difference between the forms (Hoffman equation)kJ/mol hsieh2014 E3
R, Tgas constant; temperatureJ mol⁻¹ K⁻¹; K
\sigma^{\mathrm{amorph}}, \sigma^{\mathrm{crystal}}solubility of each form (2011 notation)µg/mL alonzo2011 E2
S_A, S_Camorphous and crystalline solubility (2018 notation)µg/mL li2018 E2
\mu_A, \mu_Cchemical potential of the drug in the amorphous and the crystalline solidJ/mol li2018 E2
\Delta G; C_a, C_sfree-energy difference; amorphous and crystalline solubility (2022 notation)J/mol; µg/mL duong2022a E1

Assumptions and valid domain

The activity coefficient is constant between the crystalline and amorphous concentration; the amorphous phase is a supercooled liquid; the first form omits the water term, which amorphous solubility advantage with water-sorption correction adds ilevbare2013a C55, C58; trasi2015a C36. In the activity form the ratio of solubilities equals the ratio of activities; water mixing into the amorphous phase is neglected, which can lower the amorphous solubility by up to 2-fold hsieh2014 R17. Used at 25 and 37 °C. In the ASD dissolution papers the activity ratio is approximated by the solubility ratio konno2008a E1; solute–solvent interactions are taken as equal for both solid forms, which the 2011 authors call "unlikely to be true" for a dispersion alonzo2011 C6, C41. The drug activity coefficient in solution varies little between the crystalline and the amorphous solubility, and the amorphous form and the solution equilibrate; crystallization, water ingress and glass relaxation hamper that equilibrium li2018 C41.

Use in the library

paperused forvalues or fitted parametersstatus / recomputed
ilevbare2013afirst approximation of the amorphous solubility, ritonavirnone printednot applicable (no numerical output) ilevbare2013a E5
trasi2015adefines the amorphous-to-crystalline solubility ratioritonavir 15–16, lopinavir 6.0–6.4, paclitaxel hydrate 85–94, felodipine 7–8 (extractor arithmetic)not applicable; ratios from Table 1 trasi2015a E1, X12
hsieh2012uncorrected amorphous solubility of five basesratios 22.2, 11.9, 20.4, 54.6, 7.0ratios reproduce from printed solubilities (24.4/1.1 = 22.2) hsieh2012 E4, R10
hsieh2014glyburide and warfarinabout 60 and 48reproduces 59.9 and 47.7 at 25 °C hsieh2014 E3, R16
konno2008afelodipine at 37 °Cratio about 10: 10 × 0.94 = 9.4 against printed about 9.5 µg/mLreproduces within rounding konno2008a E1
alonzo2011felodipine at 37 °Cratio about 9 implies ΔG = RT ln 9 ≈ 5.67 kJ/molinputs not printed alonzo2011 E2
alonzo2011flux of pure amorphous felodipine against crystalratio 8.5close to the estimate alonzo2011 R14, C40
li2018lopinavir, pH 3, 25 °Cmeasured S_A/S_C = 17.4/3.1 = 5.6; \mu_A - \mu_C not printedinputs not printed li2018 E2, R1 (synthesis: RT\ln 5.6 ≈ 4.3 kJ/mol at 298 K)
duong2022aturning a Hoffman free-energy estimate into a delamanid solubility ratiomeasured ratio 42.3 at pH 6.5 against 31.8 estimatedthe two equations are used together; no ΔG value is printed duong2022a E1, E2, R27

Where it fails or is disputed

The paclitaxel ratio lies outside the 5–50-fold range quoted in the introduction and rests on a hydrate trasi2015a X12, R18. The ketoconazole estimate (54.6-fold) is 2.6 times the measured supernatant, and the water correction brings it to 15.3-fold hsieh2012 X2, R10.d. For warfarin with Eudragit E100 the polymer-free supersaturation of 60.5 exceeds the 48-fold ceiling hsieh2014 X4. A dispersion and the pure amorphous drug need not give the same solution activity; their measured equality for felodipine "may be purely coincidental" alonzo2011 C45, C48. For lopinavir the measured ratio is used; the free-energy difference from thermal data is printed but not applied to data li2018 E3, C43. The delamanid ratio was measured in PBS pH 6.5, where both solubilities are very low (0.76 and 0.018 µg/mL), so small absolute errors move the ratio duong2022a R1.

Concepts

amorphous solubility advantage, chemical potential, amorphous solubility, Hoffman equation. Findings. Amorphous solubility and LLPS: F6, F11. Crystallization from solution: F2. Supersaturation from ASD dissolution: F7, F18, F23.

← Concepts and formulas

formula · as used in Dissolution

amorphous solubility advantage with water-sorption correction

Expression

C_{\mathrm{amorphous}} = C_{\mathrm{eq}}\,\exp\left(-I(a_2)\right)\,\exp\left(\frac{\Delta G_{a \to c}}{RT}\right) ilevbare2013a E1;

the same relation is printed with \Delta G_{c\to a} and the activity term written e^{-I(a_2)} almeidaesousa2015 E1; mosqueragiraldo2015 E1; almeidaesousa2016 E1. For weak bases it is printed as

C_A = \exp\left[-\frac{\Delta G}{RT}\right]\exp\left[-I(a)\right]C_T indulkar2015 E2,

where C_T is the crystalline solubility at the pH of interest. The free energy factor must exceed 1 in every form on this page: \Delta G_{a\to c} and \Delta G_{c\to a} are positive magnitudes, as in Ueda 2024 (Eq. 2), and the forms printed with -\Delta G/RT give the reported ratios only with \Delta G taken as negative. The mole-fraction form of the 2013 appendix is

\ln x_{SL,L_1} = \ln x_{C,L_1} + \frac{\Delta G_{a\to c}}{RT} + \ln\left(x_{SL,L_2}\,\gamma_{SL,L_2}\right) ilevbare2013a E11.

The papers of 2017–2022 print the relation in the same form for atazanavir,

S_{\mathrm{pred}} = \exp\left(\frac{-\Delta G}{RT}\right)\exp\left(-I(a)\right)S_{\mathrm{xtal}} indulkar2017a E3,

for ibuprofen as

C_{\mathrm{amorphous}} = C_{\mathrm{eq}}\,e^{-I(a_2)}\,e^{\Delta G_{c\to a}/RT} ueda2021 E1,

and as a ratio

\frac{S_a^{0}}{S_c^{0}} = e^{-I(a_2)}\,e^{\Delta G_{c\to a}/RT} ueda2022 E1.

In the Bioperformance papers the ratio form for an unionized solute is

\frac{\sigma_a}{\sigma_c} = e^{-I(a_2)}\, e^{\Delta G/RT} [raina2014a E5; raina2015c E2].

With ionization terms the general form is \sigma_a/\sigma_c = [(1-\alpha^x)/(1-\alpha^a)]\,e^{-I(a_2)}\,e^{(\mu_2^a - \mu_2^x)/RT} [raina2014a E4]. The clotrimazole paper prints C_{amorph} = \exp(-\Delta G/RT)\exp(-I(a))\,C_{crystal} with an unstated sign convention for ΔG [indulkar2016 E15, X11].

The crystallization-from-solution papers print it as

\frac{S_{amorphous}}{S_{crystalline}} = \exp[-I(a_2)]\cdot\exp\left[\frac{\Delta G_c}{RT}\right] hsieh2012 E6;

C_{amorphous} = C_{eq}\,\exp[-I(a_2)]\,\exp\left[\frac{\Delta G_{a\to c}}{RT}\right] ilevbare2012b E8; ilevbare2013b E2; ilevbare2013c E6;

\frac{\sigma^{amorph}}{\sigma^{crystal}} = e^{-I(a_2)}\,e^{\Delta G/RT} jackson2014 E1.

Variables and units

symbolmeaningunits
C_{amorphous}predicted amorphous solubilityµg/mL ilevbare2013a E1
C_{eq}, C_Tcrystalline solubility in the test mediumµg/mL ilevbare2013a E1; indulkar2015 E2
e^{-I(a_2)}activity of the amorphous drug saturated with water, from the Gibbs–Duhem treatment of the sorption isothermdimensionless, 0.22–0.999 indulkar2015 M2; almeidaesousa2015 M1
\Delta Gfree-energy difference between amorphous (supercooled liquid or glass) and crystalkJ/mol, from the Hoffman or heat-capacity route almeidaesousa2015 E2, E11, E14
R, Tgas constant (8.314 J mol⁻¹ K⁻¹ in the checks), temperature298.15 or 310.15 K almeidaesousa2015 E1; ilevbare2013a E1
\sigma_a, \sigma_camorphous and crystalline solubilityµg/mL [raina2014a E5]
e^{-I(a_2)} for felodipine, nifedipinefactor for the activity lowered by absorbed water0.74–0.83 [raina2014a R7]
S_{amorphous}, S_{crystalline}; \sigma^{amorph}, \sigma^{crystal}amorphous and crystalline solubility (2012 and 2014 notation)µg/mL hsieh2012 E6; jackson2014 E1
I(a_2)Gibbs–Duhem integral from the water sorption isotherm of the amorphous soliddimensionless hsieh2012 E5

Assumptions and valid domain

The amorphous drug is treated as a supercooled liquid (or a relaxed glass), the drug activity coefficient in the dilute solution is the same at the crystalline and the amorphous concentration, and water absorption is accounted for by the Murdande correction ilevbare2013a C55, C58, C59; indulkar2015 C43. It was tested for un-ionized drug at 25 and 37 °C in buffers and water without solubilizers, and for CRH1 with 20 µg/mL HPMC at pH 4.6 ilevbare2013a R8; almeidaesousa2015 R11; almeidaesousa2016 R2. In raina2014a the solute is unionized, ΔG is the Hoffman estimate, and the water uptake from gravimetric sorption is extrapolated to water activity 1 [raina2014a C9, C10, P4]. In the crystallization-from-solution papers the activity ratio of the two solid forms is taken as the solubility ratio, water taken up by the amorphous solid lowers its activity, and ΔG comes from the Hoffman approximation hsieh2012 E4, E5, E6; jackson2014 E1, E2; tested at 25 and 37 °C for drugs with Tm 117–242 °C.

Use in the library

paperused forvalues or fitted parametersstatus / recomputed
ilevbare2013aeight drugs, 37 °C4.0–133.3 µg/mL; ritonavir 39.2 in water, 20.6 in bufferreproduces within about 5% for ketoconazole, clotrimazole, felodipine, clozapine, not for ritonavir (32.9 against 39.2), efavirenz, loratadine, indomethacin ilevbare2013a E1, X1
almeidaesousa2015six drugs, 25 °CHoffman 0.272–402.29, Cp supercooled liquid 0.325–356.44 µg/mLreproduces (ibuprofen, Hoffman: 29.29 × 0.999 × exp(3240/(8.314 × 298.15)) = 108.1 against 108.16) almeidaesousa2015 E1, R11
indulkar2015clotrimazole, atazanavirratios about 9.2 and 62; 4.9 and 64.9 µg/mLprinted sign mismatch: exp[−ΔG/RT] gives 0.072 for clotrimazole; exp[+ΔG/RT] gives 9.30 and 62.2 indulkar2015 E2, X1
mosqueragiraldo2015telaprevir, 37 °C245 ± 5 (Hoffman), 189 ± 16 (Cp glass), 97 ± 8 µg/mL (Cp supercooled liquid)Hoffman route reproduces (about 241–246 µg/mL); Cp routes cannot be checked mosqueragiraldo2015 E1, E3
almeidaesousa2016CRH1, pH 6.8 and pH 4.6 + HPMC9.0–10.0 and 11.2–12.5 µg/mLreproduces for all six values almeidaesousa2016 E1, R2
indulkar2017aatazanavir, 37 °Cratio 62 and 68 µg/mL printed; Table I inputs give about 62 with 0.22 read as exp[−I(a)], about 228 read as I(a) (synthesis)reproduces with that reading; the printed sign is inverted indulkar2017a E3, X1; indulkar2015 M2
ueda2021ibuprofen, pH 2.0 (D2O), 37 °C151 µg/mL against 154 µg/mL measuredinputs not printed (ΔG and I(a2) are in ref 20); a combined factor of 3.50 follows from 43.1 µg/mL (synthesis: 151 ÷ 43.1) ueda2021 E1, R6, R2
ueda2022ibuprofen in buffer, 25–60 °Cpredicted ratio about 3.7 → 1.3 (20 → 65 °C); measured 5.8 → 2.5inputs not printed; predicted below measured at every temperature ueda2022 E1, R16
raina2014afelodipine, nifedipine0.74 × 10.92 × 0.74 = 5.98 (printed 5.99); 10.00 × 8.78 × 0.82 = 72.0reproduces [raina2014a E5]
raina2015csame drugs, FaSSIFFaSSIF estimate assumes the buffer ratioinputs not printed [raina2015c E2]
indulkar2016clotrimazolefactor in square brackets in the paperinputs not printed [indulkar2016 E15]
wilson2018enzalutamideprinted about 39 µg/mL (C_eq 2.9, I(a2) 0.69, ΔG 7594 J/mol from ΔH_f 33,820 J/mol, Tm 470 K, T 310 K)mismatch: recomputed 27.7 µg/mL [wilson2018 E2, X1]
hsieh2012five type 2 basesratios 12.3, 9.8, 16.7, 15.3, 4.3inputs not printed; ratios reproduce from printed solubilities hsieh2012 E6
ilevbare2012britonavir20.6 µg/mL from Ceq 1.3, ΔHf 60.4 kJ/mol, Tm 121 °Cinputs not printed (I(a2)) ilevbare2012b E8, R1
ilevbare2013bcelecoxib, efavirenz, ritonavir22.6, 19.8, 20.6 µg/mLinputs not printed ilevbare2013b E2
ilevbare2013csame, starting concentrationssameinputs not printed ilevbare2013c E6, R2
jackson2014danazolexp[−I(a2)] 0.935; ratio 19.6 printedmismatch: 15.4 recomputed jackson2014 E1, X1
raina2015be^(−I(a2)) e^(ΔG/RT) for six dihydropyridinese^(−I(a2)) 0.74–0.91; estimates 0.5–48 µg/mL in buffermismatch: felodipine 5.93 recomputed against 6.68 µg/mL raina2015b E2, X2
jackson2016amorphous solubility of danazol from crystalline solubility, DSC data with heat capacity and moisture sorption7.8 µg/mL (earlier 16)named only; thermal inputs not printed jackson2016 E3, R3
duong2022bposaconazole at pH 7.0C_A = \exp[-\Delta G/RT]\exp(-I_a)C_T as printed; ratio 37.9 with activity factor 0.33estimate 10.22 against 9.08 µg/mL measured; exponent sign and ratio not reproducible (extractor: about 26.5) duong2022b E2, R7, X2

Where it fails or is disputed

Tolnaftate's onset is 1.72 times its prediction and clotrimazole's about 1.6 times almeidaesousa2015 X5; indulkar2015 X6. The Hoffman route overshoots for telaprevir mosqueragiraldo2015 C23. The inputs of the 2013 predictions are not stated unambiguously ilevbare2013a X3. The atazanavir ratio of 62 follows from the printed inputs only with 0.22 read as exp[−I(a)], although Table I heads it I(a) indulkar2017a X1; indulkar2015 M2; the ibuprofen prediction rests on H2O inputs while the measurements are in D2O ueda2022 X6; the calculation cannot be made for pazopanib, which degrades on melting sugihara2018 C17. The sign convention of ΔG differs between papers [indulkar2016 X11; indulkar2015 E2]. The estimate failed in FaSSIF [raina2015c C18] and for telaprevir mosqueragiraldo2015 C24. The enzalutamide estimate cannot be reproduced from its printed inputs (F1) [wilson2018 X1]. The danazol ratio does not follow from the printed inputs, and for the five weak bases the matching estimate changes with the compound (uncorrected for clotrimazole and loratadine, corrected for clozapine) jackson2014 X1; hsieh2012 X2. The measured value is lower than the calculated one when the drug crystallizes first (celecoxib 2.5 against 22.6 µg/mL) ilevbare2013c R2. The amorphous samples for sorption and for dissolution were prepared differently ilevbare2013c X17. The dihydropyridine ratios differ between media in ways the equation does not allow, and the Fig. 9 bars differ from Table 3 for felodipine and nifedipine raina2015b X1, X2. The posaconazole paper prints the exponent with a minus sign, which would give an amorphous solubility below the crystalline one duong2022b X2.

Concepts

amorphous solubility advantage, amorphous solubility, water sorption correction of amorphous solubility, amorphous-crystalline free energy difference, Hoffman equation, ionization, Gibbs-Duhem equation. Findings. Amorphous solubility and LLPS: F5, F6, F7, F10, F16, F18, F21. Bioperformance: F1, F23. Crystallization from solution: F2, F21, F22.

← Concepts and formulas

formula · as used in Dissolution

amorphous-to-crystalline solubility ratio

Expression

\frac{\sigma_a}{\sigma_c} = \frac{\text{LLPS onset concentration}}{\text{crystalline solubility in the same medium}} [raina2015c E8], printed in words.

The ASD dissolution papers print it from the free-energy difference,

\frac{\sigma^{\mathrm{amorph}}}{\sigma^{\mathrm{crystal}}} = e^{\Delta G/RT} alonzo2010 E1,

and in words as the measured ratio, \mathrm{ratio} = S_{\mathrm{amorphous}}/S_{\mathrm{crystalline}} trasi2016 E1 and \mathrm{A/C} = S_{\mathrm{amorphous}}/S_{\mathrm{crystalline}} alvarenga2025 E1; nguyen2023c E2 uses the same ratio as the supersaturation at the amorphous solubility.

Variables and units

symbolmeaningunits
LLPS onsetconcentration of the extinction rise (the amorphous solubility)µg/mL
crystalline solubilityshake-flask value in the same mediumµg/mL
\sigma^{\mathrm{amorph}}, \sigma^{\mathrm{crystal}}solubility of amorphous and stable crystalline formµg/mL alonzo2010 E1
\Delta Gfree-energy difference, from the Hoffman equationJ/mol alonzo2010 E1

Assumptions and valid domain

The onset represents the amorphous solubility [raina2015c C13]. The ratio is not a constant of the drug but depends on medium and polymer (F4). In the 2010 dissolution paper it is used as printed, with \Delta G from the Hoffman equation and the measured crystalline solubility alonzo2010 P12. For tacrolimus the amorphous solubility is the value after ultracentrifugation trasi2016 E1.

Use in the library

paperused forvalues or fitted parametersstatus / recomputed
raina2015cfelodipine in three media177.3/39.3 = 4.51; 214.6/42.8 = 5.01; 10.4/1.1 = 9.45 (printed 9.2)reproduces except buffer [raina2015c E8, X2]
alonzo2010felodipine 37 °CΔG 5729 J/mol, ratio 9.22reproduces alonzo2010 E1
trasi2016tacrolimus monohydrate49/1.4 = 35.0reproduces: 35.0 against printed approximately 35 trasi2016 E1, R16
lu2017btelaprevir148/5.2 = 28.5reproduces lu2017b E5
purohit2019tacrolimus, maximum supersaturationprinted about 33mismatch: 50/1.4 = 35.7 with the text value, 50/1.5 = 33.3 with the figure-caption value purohit2019 E2, X1
ueda2020aatazanavir, nifedipine, clozapine, ketoconazole with HPMCAS gradestwelve ratios in Table 1eleven reproduce; clozapine with AS-LF printed 5.9, recomputed 219.0/22.0 = 9.95 [ueda2020a E1, X1]
nguyen2023apretomanid in seven mediaprinted 6.0 in FaSSIF V1mismatch: 308/53.8 = 5.72; buffer pH 6.5 reproduces (166.1/16.2 = 10.25, printed 10.2) [nguyen2023a E3]
alonzo2010indomethacin, 37 °Cratio 12.17 × 3 µg/mL = 36.5 against about 37 µg/mLreproduces alonzo2010 E2
alonzo2010indomethacin, 25 °Cratio 15.75 gives 15.8–23.6 against printed 17–25 µg/mLmismatch alonzo2010 X2
que2018paclitaxel, pH 6.8, 37 °C31.6/0.36reproduces: 87.8 against printed 88 que2018 R1, R2
duong2022adelamanid at pH 6.50.76/0.018reproduces: 42.2 against printed 42.3 duong2022a R1, R27
nguyen2023cdelamanid at pH 1.6 and 6.5154.5/10.2 and 0.76/0.018reproduces: 15.1 and 42.2 against printed 42 at pH 6.5 nguyen2023c R1, R2
alvarenga2025praziquantel in nine media, racemate and R-enantiomer5.6–7.7 and 4.0–5.8reproduces for PBS pH 6.5: 1.17/0.16 ≈ 7.3 and 1.39/0.23 ≈ 6.0 alvarenga2025 R1, E1
polyzois2024praziquantel at pH 6.51.4/0.2826 and 1.1/0.1964reproduces: ≈5.0 and ≈5.6 against the authors' "around fivefold" polyzois2024 R1, R2, R17

Where it fails or is disputed

The text writes the ratio as σc/σa in two places [raina2015c X3]. The buffer value follows only from an unrounded solubility of about 1.13 µg/mL [raina2015c X2]. The ratio fell with HPMCAS-HF and with micelles in the medium, although the flux advantage did not (F18, F19) [ueda2020a C17; elkhabaz2019b R8, R9]. The 25 °C indomethacin range of the 2010 paper does not reproduce; the comparisons drawn from it keep their direction alonzo2010 X2. The ratio is lower for the praziquantel enantiomer than for the racemate because its crystal is more soluble, not because its amorphous solubility is lower, so a larger ratio does not mean more dissolved drug alvarenga2025 R1. The text of the praziquantel paper of 2025 gives "approximately 8- and 6-fold", above every tabulated value for the enantiomer alvarenga2025 X4. For delamanid the ratio holds only at the pH at which both solubilities were measured; it falls to about 15 at pH 1.6 nguyen2023c R1, R2.

Concepts

amorphous solubility advantage, amorphous solubility, Hoffman equation. Findings. Bioperformance: F1, F4, F18, F19. Supersaturation from ASD dissolution: F1, F4, F22, F23, F25, F28, F29.

← Concepts and formulas

formula · as used in Dissolution

Arrhenius equation

Expression

For the nucleation rate:

I = A\exp\left(-\frac{\Delta E}{RT}\right) [marsac2006a E2]

as a slope, for a crystallization rate constant (outside the subcategory):

\frac{d\ln k}{d(1/T)} = -\frac{\Delta E}{R} [wanapun2010 E5]

For melt viscosity:

\log\eta = \log\eta_0 + \frac{E_\eta}{2.303RT} [tian2017 E1]

Variables and units

symbolmeaningunits
Inucleation rateunit not stated on the plot [marsac2006a X2]
Apre-exponential factor– [marsac2006a E2]
\Delta Eactivation energykJ/mol [marsac2006a R3]
R, Tgas constant; absolute temperatureJ mol⁻¹ K⁻¹; K [marsac2006a E2]
\eta, \eta_0melt viscosity; constantunit not printed [tian2017 E1]
E_\etaactivation energy for viscous flowkJ/mol [tian2017 E1]

Assumptions and valid domain

Fitted separately above and below Tg, since the temperature dependence breaks at Tg [marsac2006a P5, C10]. For viscosity the relation "may" hold over small temperature ranges, as a straight line of log η against 1/T [tian2017 E1].

Use in the library

paperused forvalues or fitted parametersstatus / recomputed
marsac2006aactivation energy of nucleation, pure and with 3 wt% PVPbelow Tg 122 (nifedipine), 145 (felodipine); with PVP 127, 201 kJ/molreproduces ≈122 kJ/mol from plot readings [marsac2006a E2, R3]
wanapun2010 (outside)activation energy of griseofulvin crystallization by SHG140 ± 20 kJ/molreproduces [wanapun2010 E5]
tian2017melt viscosity of indomethacin with 10% HPMC, HPMCAS, PVP, 80–130 °CEη 159.7, 143.5, 190.5 kJ/molreproduces 159.7 kJ/mol from the printed slope [tian2017 E1, R13, R14]

Where it fails or is disputed

The Arrhenius plot of the 2006 paper has no rate unit and temperatures only on the 1/T axis, so it serves for slopes only [marsac2006a X2]. The activation-energy difference between the two drugs is significant only below Tg [marsac2006a X6]. The viscosity of pure indomethacin could not be measured because it crystallized, so the polymer melts have no reference [tian2017 X12].

Concepts

kinetic barrier to nucleation, nucleation rate, accelerated stability testing. Findings. F2, F4, F29.

← Concepts and formulas

formula · as used in Dissolution

Cabrera-Vermilyea step pinning

Expression

\frac{V_\rho}{V_\infty} = 1 - \frac{\rho_c}{\rho} alonzo2012 E8

Growth is arrested when the spacing of adsorbed impurity molecules equals 2\rho_c alonzo2012 C9.

Variables and units

symbolmeaningunit
V_ρgrowth rate of a two-dimensional nucleus (step) of radius ρm/s
V_∞step growth rate at infinite radiusm/s
ρ_ccritical radius of a two-dimensional nucleusnm
ρradius of curvature of the step between pinning pointsnm

Assumptions and valid domain

The spacing L of adsorbed impurities does not depend on supersaturation; ρc falls as supersaturation rises, so the maximum effect of an additive falls with S alonzo2012 C9. Not tested numerically in the chapter papers (no use of eq 8 in a calculation).

Use in the library

paperused forvalues or fitted parametersstatus / recomputed
alonzo2012argument for the fall of HPMC's effect with Snoneinputs not printed alonzo2012 E8, C9
ilevbare2012bstep pinning chosen among four mechanismsα 4.35, 1.25argument only ilevbare2012b C12, E7
que2018critical radius 5–7 nm against site spacing 10–20 nm at S 88 (ASD dissolution chapter)ρc from γ surrogatesderived que2018 R15, C38
schram2015R_P/R_0 = 1 − ρc/l applied qualitatively to the AFM globule spacingl about 44 nm at pH 3; ρc not estimatedinputs not printed schram2015 E3, X7
schram2016V_P/V_0 = 1 − ρc/l with measured l and computed ρcl 68.5 and 15.8 nm; ρc 3.98 nm; V_P/V_0 0.94 and 0.75recomputed; predicts rate ratios of 1.06 and 1.34 against 2.7 and about 12 schram2016 E4, R12, R14, X3

Where it fails or is disputed

The spacing of adsorbed HPMC on felodipine, the quantity the equation needs, was not measured alonzo2012 C28. The model's mechanism is chosen by argument against three others ilevbare2012b C12. The arrest criterion is l ≤ ρc in one place and l ≤ 2ρc in another schram2016 X1.

Concepts

step pinning, critical radius of a two-dimensional nucleus. Findings. F9, F10, F23, F24.

← Concepts and formulas

formula · as used in Dissolution

classical nucleation barrier

Expression

W^* = \frac{16\pi\gamma^3}{3\,\Delta G_v^2} [baird2010 E24; vaneerdenbrugh2010a E3];

W^* = \frac{16\pi\,\sigma_{cm}^3}{3\,\Delta G_v^2} [baird2012 E2], which enters the steady-state rate I_{SS} = I_0 \exp\left[-\frac{W^* + \Delta G_\eta}{k_B T}\right] [baird2012 E1].

\Delta G^{*} \propto \frac{1}{(\ln S)^{2}} hsieh2012 E8. The same dependence appears in the nucleation-rate expression used for celecoxib, J = A\exp[-16\pi\gamma^{3}v^{2}/(3k^{3}T^{3}(\ln S)^{2})] xie2015 E3.

Variables and units

symbolmeaningunits
W^*free energy to form a nucleus of critical sizenot stated [baird2010 E24]
\gamma, \sigma_{cm}interfacial free energy of the nucleus–liquid (or nucleus–matrix) interface per areanot stated [vaneerdenbrugh2010a E3; baird2012 E2]
\Delta G_vfree energy difference per volume between crystal and liquidJ/cm³ [vaneerdenbrugh2010a E2, E5]
\Delta G^{*}free energy of forming the critical nucleusJ hsieh2012 E8
Ssupersaturation ratiodimensionless
\gamma, vinterfacial tension and molecular volume (in the full expression)J/m²; m³ xie2015 E3

Assumptions and valid domain

Homogeneous nucleation and a similar interfacial energy for the compared classes [baird2010 E24]; spherical nuclei [baird2012 E2]. Neither γ nor σcm was measured or estimated in any of the three papers [baird2010 E24; vaneerdenbrugh2010a E3; baird2012 E2]. In the supersaturation form the barrier falls steeply as S rises, so crystals nucleate only above a certain supersaturation, which depends on compound and conditions hsieh2012 C3; no numerical output is stated in the pH-shift paper.

Use in the library

paperused forvalues or fitted parametersstatus / recomputed
baird2010argument that a more negative ΔGv of class I lowers the barriernoneinputs not printed [baird2010 E24, C61]
vaneerdenbrugh2010areading the ΔGv–class linknoneinputs not printed [vaneerdenbrugh2010a E3, C39]
baird2012argument that viscosity enters nucleation and growthnoneinputs not printed [baird2012 E2, C4, C32]
duong2022bposaconazole barrier in buffer and nucleus size from fitted γ\Delta G^{*} = 16\pi\gamma^{3}\nu^{2}/(3k^{2}T^{2}\ln^{2}S); 2.73 × 10⁻²¹ J against ≈2.72 × 10⁻²¹ J read from the figure; PBS 2.72 × 10⁻²¹ J at S 33.6reproduces duong2022b E8, R17
hsieh2012why type 1 bases precipitate only after reaching a supersaturation of 1.4–26.7 times the titration solubilitynonenot applicable (no numerical output) hsieh2012 E8, R5
xie2015reading polymer effects on celecoxib induction times (ASD dissolution chapter)γ, v not fittedprinted xie2015 E3

Where it fails or is disputed

W* depends on γ³ but only on ΔGv²; the authors read the ΔGv–class correlation as suggesting that γ differences between compounds are small [vaneerdenbrugh2010a C39], an inference that rests on a ΔGv ranking that is not monotonic across classes [vaneerdenbrugh2010a X10]. In the pans and films used, nucleation may be heterogeneous [baird2010 C19; baird2012 C8], which the homogeneous form does not cover. Precipitation was seen at widely different supersaturations (1.4 for pyrimethamine to 26.7 for droperidol) hsieh2012 R5, C22. (synthesis: the barrier expression alone does not predict this spread without the interfacial energies of the compounds, which the paper does not give.)

Concepts

classical nucleation theory, nucleation, thermodynamic driving force for crystallization, heterogeneous nucleation. Findings. Crystallization tendency: F3, F6. Crystallization from solution: F1, F14, F34.

← Concepts and formulas

formula · as used in Dissolution

classical nucleation theory

Expression

J \propto \exp\left(-\frac{\Delta G^{*}}{k_B T}\right) hsieh2012 E7

J = A\exp\left(\frac{-\Delta G_{crit}}{kT}\right) ilevbare2013c E4

J_{N} = v^{*} z n \exp\left(\frac{-16\pi\gamma^{3}v^{2}}{3k_{B}^{3}T^{3}(\ln S)^{2}}\right) indulkar2018 E6

J = A\exp\left(\frac{16\pi \nu_o^{2} \gamma^{3}}{3 (k_B T)^{3} (\ln S)^{2}}\right) elkhabaz2021 E2 (printed without the minus sign)

J = A\,S\,\exp\left(\frac{-16\pi\gamma^{3}\nu^{2}}{3k^{3}T^{3}\ln^{2}S}\right) duong2022b E6

\ln(J/S) = \ln A - \frac{B}{\ln^{2}S}, \qquad B = \frac{16\pi\gamma^{3}\nu^{2}}{3k^{3}T^{3}} duong2022b E7

J = A\exp\left(-\frac{16\pi\gamma^{3}v^{2}}{3k^{3}T^{3}(\ln S)^{2}}\right) trasi2015 E6; xie2015 E3

Nucleation rate with a thermodynamic and a kinetic barrier, as printed in the solid-state papers of the physical-stability chapter:

I = A\exp\left(\frac{-\left(\Delta G^{*} + \Delta G_{a}\right)}{kT}\right) [konno2006 E8]

I = A\exp\frac{-\left(\Delta G^{*} + \Delta G_{a}\right)}{kT} [marsac2006a E9]

and for the undercooled melt:

I_{SS} = I_0\exp\left(-\frac{W^{*} + \Delta G_{\eta}}{k_B T}\right) [baird2012 E1]

In the reduced-temperature form printed for acetaminophen, with its typesetting as printed:

J = A\exp\left[-\frac{16\pi r^{3}}{3kT_m\Delta H_f^{2}T_r(\Delta T_r)^{2}} + \frac{\Delta G'}{KT}\right] [trasi2012a E1]

where the card reads r as the interfacial energy \gamma and the kinetic term as -\Delta G'/kT, as the text describes [trasi2012a X1].

The ASD dissolution papers of 2008 and 2010 print it with ln S unsquared,

J = A\exp\left(-\frac{16\pi\gamma^{3}v^{2}}{3k^{3}T^{3}\,(\ln S)}\right) konno2008a E3,

J \propto \exp\left[-\frac{1}{\ln S}\right] alonzo2010 E4;

the ritonavir dispersion paper states the dependence in words only: the relative nucleation rate rises with the drug concentration in a phase and falls with the crystal–solution interfacial tension ilevbare2013d E1.

Variables and units

symbolmeaningunit
Jnucleation ratem⁻³ s⁻¹
Apre-exponential kinetic factor, depends on molecular mobilitym⁻³ s⁻¹
ΔG*, ΔG_critfree energy of forming a critical nucleusJ
k, k_BBoltzmann constantJ/K
Tabsolute temperatureK
γinterfacial tension (free energy) between nucleus and solutionJ/m² (mJ/m² in the posaconazole fits)
ν, v, ν_omolecular volumem³ (920 ų for posaconazole)
Ssupersaturationdimensionless
v*, z, nmonomer attachment rate, Zeldovich factor, number density of moleculesas printed
Inucleation rate in the film papersm⁻³ s⁻¹ [konno2006 R4]
\Delta G^{*}, W^{*}thermodynamic barrier, from interfacial term against bulk driving forceJ [konno2006 E8]
\Delta G_{a}, \Delta G_{\eta}kinetic barrier for transport onto the nucleusJ [konno2006 E8]
T_r, \Delta T_rreduced temperature T/T_m and 1 - T_r– [trasi2012a E1]
\Delta H_f; \Delta G'heat of fusion; activation energy for molecular motionnot given [trasi2012a E1]

Assumptions and valid domain

Clusters grow by sequential molecular additions; the barrier rises with the cube of the interfacial energy and falls with (\ln S)^{2} (see classical nucleation barrier) ilevbare2013c E4, C14; hsieh2012 E8. Used qualitatively; no fit to induction times is printed. The solid-state papers assume homogeneous nucleation, although nucleation in the films is "most likely heterogeneous"; stresses from the volume change are ignored [konno2006 C33; marsac2006a C32]. In the ASD dissolution papers of 2008–2013 it is used only qualitatively: higher supersaturation, faster nucleation konno2008a C20; alonzo2010 C43; ilevbare2013d C40. The 2015 celecoxib paper prints the classical form with (\ln S)^{2} and uses it to argue that neither supersaturation nor interfacial tension explains the polymer differences in induction time xie2015 E3, C43.

Use in the library

paperused forvalues or fitted parametersstatus / recomputed
hsieh2012why type 1 bases precipitate only above a certain supersaturationnonenot applicable (no numerical output) hsieh2012 E7
ilevbare2013cwhy a polymer gains more at lower supersaturation (celecoxib 31-fold at S 7.3)noneinputs not printed ilevbare2013c E4, C45
xie2015celecoxib dispersions: J = A\exp[-16\pi\gamma^{3}v^{2}/(3k^{3}T^{3}(\ln S)^{2})]; longer induction times with polymers read as lower nucleation rate; why HPMCAS and HPMC lengthen celecoxib induction times more than PVPγ, v not fitted; γ, v, A not printedprinted; inputs not printed xie2015 E3, C42, C43
trasi2015J = A exp[−16πγ³v²/(3k³T³(ln S)²)] to state that T, S and γ set Jacetaminophen S 1.5, 20 °Cinputs (A, γ, v) not printed trasi2015 E6
li2016anamed only: nucleation rate depends highly on supersaturationbile-salt seriesnamed only li2016a E5
indulkar2018why lecithin might accelerate nucleation through γnoneinputs not printed indulkar2018 E6, C40
elkhabaz2021why surfactants should lower γ, and why human fluid does not fitnoneprinted without minus sign elkhabaz2021 E2, X1
duong2022blinearized fit of posaconazole induction times in buffer and three mediaγ 3.52, 2.61, 2.73, 3.24 mJ/m²; A 2.44, 5.14, 4.98, 9.87reproduces from the printed slopes and intercepts duong2022b E7, R16
konno2006sorting polymer effects into driving force and kinetic barriernoneinputs not printed [konno2006 E8]
marsac2006aframework for the nifedipine–felodipine comparisonnoneframework only [marsac2006a E9]
baird2012role of viscosity in class differencesnoneinputs not printed [baird2012 E1]
trasi2012aframework for polymer effects on acetaminophen nucleationnoneinputs not printed; printed form has misprints [trasi2012a E1, X1]
konno2008afelodipine nucleates readily at a high solubility rationonenot applicable konno2008a E3
alonzo2010scheme of dissolution against crystallizationnonenot applicable alonzo2010 E4
ilevbare2013dnucleation favoured in drug-rich dropletsnoneprinted in words ilevbare2013d E1

Where it fails or is disputed

Induction times include growth to detectable size, so a rate from them is nucleation plus early growth ilevbare2013c X14. The two-step picture (disordered cluster, then reorganization) is assumed to be rate-limiting but not shown ilevbare2013c C5, C15. The critical supersaturation at which precipitation is seen depends on compound and conditions hsieh2012 C3. The Poisson fit uses the printed volume 0.0012 m³ and a positive exponent, both misprints (V = 1.2 mL and a minus sign reproduce the 95% times within about 12%) trasi2015 X1, X2, E5. In the posaconazole fits the high-supersaturation sets hold 3–9 points (R² 0.84–0.97, FeSSIF V2 not fittable), and the conversion of induction time into J is not stated duong2022b X10, X11. No parameter was fitted in the solid-state papers; the theory serves to exclude a driving-force route and to frame a kinetic one [konno2006 C35, C40]. The polymer effects on acetaminophen nucleation were "not particularly straightforward" to explain with it, and it does not contain molecular recognition [trasi2012a C49]. The 2008 and 2010 dissolution papers print ln S without the square of the classical expression; use the squared form to compute rates konno2008a X8; alonzo2010 X3. The 2015 celecoxib form carries the square; in its argument the supersaturation is not the same with and without polymer (about 14.7 against 10.3–11.6), and the text refers to Eq. 2 where interfacial tension appears in Eq. 3 xie2015 X9, X1.

Concepts

classical nucleation theory, nucleation rate, crystal-solution interfacial free energy, kinetic barrier to nucleation, interfacial free energy, nucleation, interfacial tension. Findings. Crystallization from solution: F1, F14, F27, F29, F5, F34, F39, F42. Physical stability: F1, F4, F17. Supersaturation from ASD dissolution: F1, F4, F5, F13.

← Concepts and formulas

formula · as used in Dissolution

congruent release relation

Evidence table: congruent release relation. Content from the ASD dissolution chapter (2011) and from papers of the release-mechanism chapter.

Expression

G_D = \frac{G_C\,A_D}{A_C} alonzo2011 E4

\left(\frac{dC}{dt}\right)_{drug} = \left(\frac{dC}{dt}\right)_{polymer}\frac{m_{drug}}{m_{polymer}} indulkar2019a E3

G_B = \frac{N_B}{N_A}\,G_A xie2016a E1

Printed with weight fractions in the 2020 felodipine study:

\left(\frac{dC}{dt}\right)_{drug} = \left(\frac{dC}{dt}\right)_{polymer}\frac{N_{drug}}{N_{polymer}} saboo2020a E2

Printed in the 2022 ritonavir surfactant study:

\left(\frac{dC}{dt}\right)_{\mathrm{drug}} = \frac{\left(\frac{dC}{dt}\right)_{\mathrm{polymer}} m_{\mathrm{drug}}}{m_{\mathrm{polymer}}} indulkar2022 E1

Variables and units

symbolmeaningunit
G_D, G_Cdissolution rate of drug and of carrieras measured
A_D, A_Cproportion of drug and of carrier in the solidw/w
(dC/dt)_{drug}, (dC/dt)_{polymer}release rates of drug and polymerµg/(mL min)
m_{drug}, m_{polymer}masses in the dispersionmg
G_A, G_Bdissolution rates of components A and Bas measured
N_A, N_Bproportion of each componentw/w
N_{drug}, N_{polymer}weight fractions of drug and polymer–

Assumptions and valid domain

High polymer loading, so that no drug-rich layer limits dissolution alonzo2011 C37. Holds when Corrigan's condition N_A/N_B > D_A C_{SA}/(D_B C_{SB}) is met (cited), which the 2016 paper takes as the basis of polymer-controlled release at low and drug-controlled release at moderate to high drug loading xie2016a E2, C4. Release controlled by polymer dissolution saboo2020a E2; the polymer dissolves and brings the drug into solution because there is too little drug to form an intact surface layer indulkar2019a E3. In the normalized form of the surface-normalized release rate it predicts equal drug and polymer rates saboo2020a E2, E3.

Use in the library

paperused forvalues or fitted parametersstatus / recomputed
alonzo2011why 90:10 dispersions dissolve much faster than 50:50noneinputs not printed alonzo2011 E4
indulkar2019aritonavir–copovidone release at low drug loading (10% ritonavir–PVPVA at 20 min)integrated over time at 10% drug: ≈67 mg PVPVA × 10/90 = ≈7.4 mg ritonavir against ≈7.6 mg read from the release curvereproduces (inputs read from plots) indulkar2019a E3, R1, R2
saboo2020anormalized drug and polymer release rates; nilvadipine, felodipine, cilnidipine at 40% in HPMCASequal normalized rates predicted; drug/polymer 0.42/0.42, 0.34/0.32, 0.26/0.24 mg/min/cm²reproduces in the normalized form, equal within SD saboo2020a E2, R16
indulkar2022cited regime, the good regime for 30:70 ritonavir–PVPVA with surfactantsnonenot applicable (not fitted) indulkar2022 E1
xie2016awhy celecoxib release slows at high drug loadingnonenot applicable xie2016a E1, C4

Where it fails or is disputed

In the 2011 study neither rate was measured, so the regime is inferred from particle disintegration and UV speed alonzo2011 C38, C28. Above the limit of congruency the polymer leaves first and the relation no longer holds saboo2020a R14; indulkar2019a R5. It fixes the ratio of the two rates, not their size: in congruent dispersions the polymer rate itself was below that of a neat polymer compact saboo2019 R8; saboo2020a C19.

Concepts

polymer-controlled release, congruent release. Findings. Supersaturation from ASD dissolution: F10, F20. Release mechanism and LoC: F1, F2.

← Concepts and formulas

formula · as used in Dissolution

critical cooling rate to avoid nucleation

Expression

R_{Ncrit} \sim \frac{1}{\tau_{Nmin}} [baird2010 E21], with the nucleation time \tau_N = \frac{1}{J_N V} [baird2010 E22].

Variables and units

symbolmeaningunits
R_{Ncrit}critical cooling rate to avoid nucleationnot stated [baird2010 E21]
\tau_{Nmin}minimum nucleation time between Tm and Tgnot stated [baird2010 E21]
J_N, Vnucleation rate and sample volumenot stated [baird2010 E22]

Assumptions and valid domain

An approximation [baird2010 E21]. Glass formation requires cooling faster than the maximum crystallization rate; the minimum nucleation time lies between Tm and Tg, where the driving force rising with undercooling meets the viscosity that restricts diffusion near Tg [baird2010 C49].

Use in the library

paperused forvalues or fitted parametersstatus / recomputed
baird2010argument for why nucleation and growth windows decide glass formationnoneinputs not printed [baird2010 E21, E22, C49]

Where it fails or is disputed

No nucleation time or rate was measured [baird2010 E21]. Because τN depends on sample volume [baird2010 E22], the critical rate is not a pure material property (synthesis: from the 1/(J_N V) form).

Concepts

critical cooling rate, nucleation, nucleation temperature zone, glass-forming ability. Findings. F3, F16.

← Concepts and formulas

formula · as used in Dissolution

crystal growth inhibition effectiveness ratio

Expression

The polymer effectiveness ratio for crystal growth inhibition is the growth rate without polymer over the rate with polymer:

E_G=\frac{R_{G,np}}{R_{G,p}}

moseson2020a E2; moseson2021 E1. E_G>1 means the polymer slows growth.

The crystallization-from-solution papers print the same ratio as

E_g = \frac{R_{g0}}{R_{gp}}

ilevbare2012c E5; ilevbare2012a E3; ilevbare2012b E12; ilevbare2013b E5. The inverse form R/R_0 = R_{gp}/R_{g0} is used in the Kubota–Mullin model ilevbare2012b E7.

For the melt growth of two felodipine polymorphs it is printed in words: the bulk growth rate without polymer divided by the bulk rate with 3% PVP, per polymorph and temperature [kestur2013a E2].

Variables and units

symbolmeaningunitids
E_Geffectiveness ratiodimensionlessmoseson2020a E2
R_{G,np}crystal growth rate without polymerµg/s (vessel mass rate)moseson2020a E2, X12
R_{G,p}crystal growth rate with polymerµg/smoseson2020a E2
R_{g0}initial growth rate without polymerµg mL⁻¹ min⁻¹ or µg min⁻¹ilevbare2012a E3
R_{gp}initial growth rate with polymer or additivesameilevbare2012a E3
E_geffectiveness ratio; 3 means growth three times slowerdimensionlessilevbare2013b E5
bulk growth rates (felodipine melt)linear growth rates without and with 3% PVP, read from plotsm/s[kestur2013a E2, R8, R13]

Assumptions and valid domain

Evaluated at the highest seed level (50 µg/mL) at S = 6 for indomethacin; for bicalutamide from seeded growth at 150 µg/mL moseson2020a E2, P20; moseson2021 R5. The growth rates are vessel mass rates not normalised to seed surface area and the extraction method is not printed moseson2020a X12. In the seeded-growth papers a ratio above 1 is taken as effective and below 1 as accelerating; the rate is the slope of the dissolved drug over the first 2 min at fixed seed mass and supersaturation ilevbare2013b C17; ilevbare2012a E3, E4. Tested for ritonavir, celecoxib and efavirenz at 37 °C, pH 6.8, 5 µg/mL polymer. In the felodipine polymorph work it is applied to growth from the supercooled melt at 60–100 °C, not from solution [kestur2013a R15, C28].

Use in the library

paperused forvalues or fitted parametersstatus / recomputed
moseson2020aindomethacin with 5 and 50 µg/mL PVPVAE_G 18 and 56reproduces from the figure readings: 0.99 / 0.055 = 18 and 0.99 / 0.018 = 55 moseson2020a R5, E2
moseson2021bicalutamide with PVPVA 70 µg/mL and HPMCAS 1 mg/mLE_G 8.6 and 158inputs not printed (growth rates are in a supplement that was not supplied) moseson2021 R5, E1
ilevbare2012c34 polymers on ritonavir0.83–3.25absolute rates not printed ilevbare2012c E5, R9
ilevbare2012bpolymers against S and pH6.40, 2.99, 1.56; 2.98 → 1.12not applicable (definition) ilevbare2012b E12
ilevbare2012a14 polymers, 13 pairs, surfactantsup to 12.1; 0.49 for TPGSreproduces (3.6/1.1 = 3.27, printed 3.3) ilevbare2012a E3
ilevbare2013b16 polymers on three drugsup to 12.6reproduces (69.80/11.88 = 5.88, text about 6.0) ilevbare2013b E5
schram2015E_g = R_0/R_P of felodipine with HPMCAS-LF2.29 (pH 6.8), 1.28 (pH 3)slopes not tabulated; end-point estimate gives 2.3 and 1.3 schram2015 E4, R4
schram2016same, R_0 of buffer-grown seeds without polymer2.7, 5.5, 8.0, 12.0 with HPMCAS in solution; 1.8, 3.0, 8.4 withoutplot readings schram2016 E5, R2
lu2017aE_G at δ 2.4 and E_C at δ 7.9 or 12.5 for telaprevir with bile saltsE_G 1.0–4.6; STCDC no desupersaturationplot readings lu2017a E2, E3, R7, R8
lu2018telaprevir seeds with bile salt mixtures, δ 7.9E_G = R_0/R over the first 10 minSTDC 3.8; STCDC >60; binary-L 35.5; binary-H 7.4; inputs not printed lu2018 E3, R5
kestur2013awhether PVP acts in the liquid or at the crystal faces of felodipine forms I and IIform I ≈15.8 → ≈3.5, form II ≈18.7 → ≈6.5 (60 → 100 °C)reproduces from Figs. 2 and 3 for form II and for form I at 90–100 °C, not for form I at 60–80 °C [kestur2013a E2, X7]
kestur2013bsurface against bulk growth of felodipine form I with 3% PVP≈2 (surface), ≈7 (bulk)from the printed rates [kestur2013b R12]

Where it fails or is disputed

The ratio falls as supersaturation rises, depends on how the seeds were prepared and on the polymer concentration, so values from different systems are not comparable ilevbare2012b C56; schram2016 C13. A large ratio in solution does not predict protection against crystallisation in the solid moseson2021 C51. The stated rule (E_g above 1 is effective) does not match the counts of effective polymers or the polymers called ineffective at 1.0–1.4 (cut-off near 1.2 in practice) ilevbare2013b X3; ilevbare2012c X7. Rates depend on seed mass, volume and methanol fraction, which are not always printed ilevbare2012c X16. A polymer that raises the solubility lowers S and flatters the ratio (F19) ilevbare2013c X7. The reference rate R_0 differs: one seed route in the felodipine seed study and the pH-independent single curve in the 2015 paper schram2016 E5; schram2015 X3; rates are not normalised to area schram2016 X12. In the felodipine melt work the error bars of the two polymorphs separate at 90–100 °C, so equality of their ratios holds within about a factor of two [kestur2013a X6].

Concepts

crystal growth inhibition, crystallization inhibition by polymers, crystal seeding, crystal growth rate, polymorphism. Findings. ASD process: F25, F27, F29. Crystallization from solution: F7, F8, F9, F17, F18, F23, F24, F33. Physical stability: F3, F19.

← Concepts and formulas

formula · as used in Dissolution

depth of field of a microscope objective

Expression

As printed in the four nucleation papers:

D_{tot} = \frac{\lambda n}{NA^{2}} + \frac{n e}{M \cdot NA} [konno2006 E1; marsac2006a E1; konno2008 E1; marsac2008a E2]

Variables and units

symbolmeaningunits
D_{tot}total depth of field, used as the sampled thicknessmm (0.0144 mm at 10×) [konno2006 E1]
\lambdawavelength of light550 nm [konno2006 E1]
nrefractive index of the medium1.000 (air) [konno2006 E1]
NAnumerical aperturenot printed [konno2006 E1]
esmallest distance resolved by the detector14 µm [konno2006 E1]
Mlateral magnification10× [konno2006 E1]

Assumptions and valid domain

The counted nucleation sites lie within the depth of field, so the site density per volume follows from the density per area and D_{tot} [konno2008 C38]. Used for birefringent sites of about 1 µm or more in spin-coated films [konno2008 C38].

Use in the library

paperused forvalues or fitted parametersstatus / recomputed
konno2006volume nucleation rates of felodipine films0.0144 mm at 10×NA not printed; NA = 0.25 reproduces 14.4 µm [konno2006 E1]
marsac2006anifedipine and felodipine nucleation rates0.0144 mm at 10×same check [marsac2006a E1]
konno2008nucleation at 0–75% RH0.0144 mmsame check [konno2008 E1]
marsac2008anucleation with PVP and water0.0144 mm at 10×; other objectives not givensame check [marsac2008a E2, X10]

Where it fails or is disputed

The 2006 and 2008 felodipine papers describe the conversion as multiplication by D_{tot} where a per-volume density needs division [konno2006 X6; konno2008 C38]. Rates are therefore comparable only within this counting method; the film thickness is not printed [marsac2006a X10; konno2008 X7].

Concepts

nucleation rate, nucleation. Findings. F1.

← Concepts and formulas

formula · as used in Dissolution

Fedors group-contribution solubility parameter

Expression

\delta = \sqrt{\frac{\sum_i \Delta e_i}{\sum_i \Delta v_i}} = \sqrt{\frac{\Delta E_v}{V}} ilevbare2012c E1; ilevbare2013c E5; ilevbare2013b E1; ilevbare2012a E1

Molar-volume correction for glassy polymers (Tg above 25 °C):

\Delta v_i = 4n \quad (n < 3), \qquad \Delta v_i = 2n \quad (n \geq 3) ilevbare2012c E2, E3

Variables and units

symbolmeaningunit
δsolubility parameter; lower means more hydrophobicMPa^1/2
Δe_igroup contribution to the energy of vaporizationJ/mol
Δv_igroup contribution to the molar volumecm³/mol
ΔE_v, Venergy of vaporization and molar volumeJ/mol; cm³/mol
nnumber of main-chain skeletal atoms in the smallest repeating unitinteger

Assumptions and valid domain

Group contributions at 25 °C; only the structural formula is needed; for glassy polymers the estimated molar volume deviates from the measured one, hence the correction ilevbare2012c E1, E2. Applied to drugs and to cellulosic, vinyl and acrylic polymers; no uncertainty is stated.

Use in the library

paperused forvalues or fitted parametersstatus / recomputed
ilevbare2012c14 new cellulose esters19.62–23.28 MPa^1/2inputs not printed (group contributions are in the reference) ilevbare2012c E1
ilevbare2012a14 polymers20.05–32.24 MPa^1/2inputs not printed ilevbare2012a E1
ilevbare2013b16 polymers and 3 drugsdrugs 20.03, 21.89, 23.38inputs not printed ilevbare2013b E1
ilevbare2013c21 polymers and 3 drugs19.62–32.24; drugs as aboveinputs not printed ilevbare2013c E5
mosqueragiraldo2016Fedors SP of 18 new cellulose derivatives (ionization not allowed for)SP 22.08–25.54 MPa^1/2 for the telaprevir polymersnot recomputed mosqueragiraldo2016 P5, M10–M27
mosqueragiraldo2018asix carboxylated cellulose derivatives, neutral structuresnamed only19.9–25.5 MPa^1/2 mosqueragiraldo2018a E2, R6

Where it fails or is disputed

The SP values of the commercial and synthetic polymers are not printed in the 2012 growth paper ilevbare2012c X11. The SP window explains ritonavir and efavirenz but not PVPVA on celecoxib and efavirenz or Pn-IPAAmd and PAA on celecoxib ilevbare2013c X11; ilevbare2013b C51. Hydrophobicity (SP) and carboxyl content are confounded in the new esters ilevbare2012c X10. The SP of A5a (25.54) and A5b (24.29) differ by more than the span of the effective acids, and the calculated SP did not predict effectiveness across chemistries mosqueragiraldo2016 X8, C25. The method cannot include ionized substituents, while the simulations of the same paper treat the chains as fully ionized mosqueragiraldo2018a P12, X9.

Concepts

solubility parameter, polymer hydrophobicity. Findings. F8, F13, F25, F36.

← Concepts and formulas

formula · as used in Dissolution

Flory-Huggins activity equation

Expression

Activity coefficient of the drug in a polymer, with the amorphous drug as the solvent (2006):

\ln\gamma_{\mathrm{drug}} = \ln\frac{\Phi_{\mathrm{drug}}}{x_{\mathrm{drug}}} + \left(1-\frac{1}{m}\right)\Phi_{\mathrm{polymer}} + \chi\,\Phi_{\mathrm{polymer}}^{2} [marsac2006b E6];

the same quantity scaled from a liquid analogue (1-ethyl-2-pyrrolidone, EP) to PVP (2009):

\ln\gamma_{\mathrm{drug}}^{PVP} = \frac{MV_{\mathrm{drug}}}{MV_{\mathrm{lattice}}}\left[\frac{1}{m_{\mathrm{drug}}}\ln\frac{\Phi_{\mathrm{drug}}}{x_{\mathrm{drug}}} + \left(\frac{1}{m_{\mathrm{drug}}}-\frac{1}{m_{PVP}}\right)\Phi_{PVP}\right] + \ln\gamma_{\mathrm{drug}}^{EP} [marsac2009 E8];

\ln\gamma_{\mathrm{drug}}^{PVP} = \frac{MV_{\mathrm{drug}}}{MV_{\mathrm{lattice}}}\left[\frac{1}{m_{\mathrm{drug}}}\ln\frac{\Phi_{\mathrm{drug}}}{x_{\mathrm{drug}}} + \left(\frac{1}{m_{\mathrm{drug}}}-\frac{1}{m_{PVP}}\right)\Phi_{PVP} + \chi\,\Phi_{PVP}^{2}\right] [marsac2009 E9].

As the activity of the drug in the library's other papers:

\ln a = \ln\Phi_1 + \left(1-\frac{1}{x_{12}}\right)\Phi_2 + \chi\,\Phi_2^{2} [konno2006 E9];

\ln a_{\mathrm{drug}} = \ln\Phi_{\mathrm{drug}} + \left(1-\frac{1}{m}\right)\Phi_{PVP} + \chi\,\Phi_{PVP}^{2} [marsac2006a E10].

The ASD dissolution papers print it as the change of the drug chemical potential in an undissolved polymer:

\frac{\Delta\mu_{\mathrm{drug}}}{RT} = \ln\Phi_{\mathrm{drug}} + \left(1-\frac{1}{r}\right)\Phi_{\mathrm{poly}} + \chi\,\Phi_{\mathrm{poly}}^{2} li2018 E4

Variables and units

symbolmeaningunits
\gamma_{drug}, aactivity coefficient and activity of the drugdimensionless [marsac2006b E6; konno2006 E9]
\Phivolume fractiondimensionless [marsac2006b E6]
x_{drug}mole fraction of the drugdimensionless; mole-fraction basis in PVP not printed [marsac2009 X13]
mratio of polymer to lattice-site volumedimensionless [marsac2006b E6]
MVmolar volumecm³/mol (e.g. 288.62 for nifedipine) [marsac2006b M1; marsac2009 E8]
\chiinteraction parameterdimensionless [marsac2006b E6]
\Delta\mu_{\mathrm{drug}}change of the drug chemical potential on mixingJ/mol li2018 E4
\Phi_{\mathrm{drug}}, \Phi_{\mathrm{poly}}volume fractions of drug and polymer (2018 notation)dimensionless li2018 E4
rV_{\mathrm{poly}}/V_{\mathrm{drug}}, volume ratio of polymer to drug (2018 notation for m)dimensionless li2018 E4

Assumptions and valid domain

In the analogue liquid the first two terms vanish when the mixing entropy is ideal (minimal size difference) [marsac2006b C46]. The 2009 scaling assumes ideal mixing entropy with EP, identical contacts of the drug with EP and with the PVP repeat unit, Flory–Huggins combinatorial entropy for PVP, and equal γ at the solubility limits in EP and in PVP [marsac2009 E6, E7, C11]. In the ASD dissolution use: a drug–polymer dispersion that is one phase and stays one phase on hydration, with a polymer largely insoluble in the medium; the change of χ with water is not included li2018 C45, C46.

Use in the library

paperused forvalues or fitted parametersstatus / recomputed
marsac2006bsolubility of the crystalline drug in PVP and methyl pyrrolidonewith χ −3.8 and −4.2reproduces for felodipine in PVP K12 with m = 7.50 (Φ_drug 0.210, 0.31 g/g against 0.31); felodipine in K29/32 gives 0.29 against 0.25 [marsac2006b E6, R17]
marsac2009γ of five compounds in PVP K12, K29/32, K90 from γ in EPγ in PVP 0.50–5.97inputs not printed (lattice volume of EP, mole-fraction basis) [marsac2009 E8, E9, R9]
marsac2006adrug activity against PVP content with χ of the melting routeactivity ≈0.84 (nifedipine) and ≈0.83 (felodipine) at Φ_PVP 0.2reproduces approximately (0.839, 0.826 with 1/m ≈ 0) [marsac2006a E10, R19]
marsac2006aargument that PVP lowers the driving force alike and little for nifedipine and felodipine, so the ranking persistsactivity ≈0.96, 0.84, 0.67 at Φ 0.1, 0.2, 0.3same calculation as the row above [marsac2006a R19, C47]
konno2006argument that Flory–Huggins gives little activity loweringnoneχ and x₁₂ for felodipine–polymer not given [konno2006 E9, C35]
li2018qualitative ranking of the suppression of lopinavir concentration by insoluble polymersχ and r not determinedinputs not printed li2018 E4, C44, C51

Where it fails or is disputed

The values in PVP are predictions under the stated assumptions; none was checked against a solubility measured in a polymer, and the one check (methyl pyrrolidone) is about 30% low for nifedipine [marsac2006b X10; marsac2009 X17]. The 2009 relation has no printed lattice volume, so it cannot be recomputed from the paper [marsac2009 X4, X13]. The combinatorial and residual parts are linked, because order imposed by exothermic interactions lowers the entropy of mixing [marsac2009 C10]. The conclusion drawn from it in the physical-stability papers, that a few percent of polymer acts kinetically, was not tested by any measured activity [konno2006 C35; marsac2006a C46]. For lopinavir, χ was not measured for any lopinavir–polymer pair, so the use is qualitative li2018 C46, C51. With χ = 0 and a large r the equation gives a drug activity of about 0.82 at a drug volume fraction of 0.5, above the proportional-dilution line that the paper calls ideal (extractor calculation) li2018 X2.

Concepts

activity coefficient, combinatorial entropy of mixing, Flory-Huggins theory, drug solubility in polymer, thermodynamic driving force for crystallization, Flory-Huggins interaction parameter, chemical potential, solubility suppression. Findings. Miscibility and drug-polymer interactions: F8, F9. Physical stability: F4. Supersaturation from ASD dissolution: F18.

← Concepts and formulas

formula · as used in Dissolution

Flory-Huggins free energy of mixing

Expression

In mole numbers, as printed in the 2006 paper:

\frac{\Delta G_M}{RT} = n_{\mathrm{drug}}\ln\Phi_{\mathrm{drug}} + n_{\mathrm{polymer}}\ln\Phi_{\mathrm{polymer}} + n_{\mathrm{drug}}\,\Phi_{\mathrm{polymer}}\,\chi [marsac2006b E1];

per lattice site, with the size ratios m of the 2009 paper:

\frac{\Delta G}{RT} = \frac{\Phi_{\mathrm{drug}}}{m_{\mathrm{drug}}}\ln\Phi_{\mathrm{drug}} + \frac{\Phi_{\mathrm{polymer}}}{m_{\mathrm{polymer}}}\ln\Phi_{\mathrm{polymer}} + \chi\,\Phi_{\mathrm{drug}}\Phi_{\mathrm{polymer}} [marsac2009 E10];

and for a drug (volume fraction \Phi) and a polymer of m lattice sites, as printed in two later papers of the library:

\Delta G_{mix} = RT\left[\Phi\ln\Phi + \frac{1-\Phi}{m}\ln(1-\Phi) + \chi\,\Phi\,(1-\Phi)\right] [tian2017 E2];

\Delta G = RT\left[\varphi\ln\varphi + \frac{1-\varphi}{m}\ln(1-\varphi) + \chi\,\varphi\,(1-\varphi)\right] [moseson2018 E1].

A form is named but not printed in [rumondor2009b E2].

The itraconazole–HPMC paper prints the same form for a drug D and a polymer P,

\frac{\Delta G_{mix}}{RT} = n_D\ln\phi_D + n_P\ln\phi_P + n_D\,\phi_P\,\chi [purohit2015a E1],

and uses it in words only.

Variables and units

symbolmeaningunits
\Delta G_M, \Delta Gfree energy of mixingdivided by RT in the 2006 and 2009 forms [marsac2006b E1; marsac2009 E10]
n_{drug}, n_{polymer}moles of drug and polymermol [marsac2006b E1]
\Phivolume fractiondimensionless; from weight fraction and true density [marsac2006b P5, E8]
m, m_{drug}, m_{polymer}ratio of the molecular volume to that of the lattice sitedimensionless [marsac2009 E10; moseson2018 E1]
\chiinteraction parameterdimensionless [marsac2006b E1]
R, Tgas constant, absolute temperature[marsac2006b E1]

Assumptions and valid domain

The amorphous drug is treated as a solvent and one lattice site equals the molecular volume of the drug [marsac2006b E1, C9]; χ is independent of composition [marsac2009 P8]; the entropy curves are computed with χ = 0 for nifedipine with methyl pyrrolidone and three PVP grades [marsac2006b R1]. The temperature and the PVP grade of the 2009 curves are not printed [marsac2009 X12]. The critical χ for miscibility depends on how the lattice is defined [marsac2006b C18]. The indomethacin polymorph paper uses it for drug–polymer melts at 80–135 °C, above Tg, with 10% w/w polymer, as an argument only [tian2017 E2, A2].

Use in the library

paperused forvalues or fitted parametersstatus / recomputed
marsac2006bentropy of mixing of nifedipine with methyl pyrrolidone and PVP; ΔG/RT for χ −4.2 to 2.0χ = 0, −4.2, −3.8, 0.5, 1.0, 2.0; miscibility needs about 0.6 or lessprinted; not applicable, curves carry no ordinate scale [marsac2006b E1, R1, R2, R3]
marsac2009ΔG/RT of five PVP pairs and sucrose–dextran from two sets of χindomethacin minimum ≈2.4 and ≈5 times the athermal oneprinted; not applicable, no numerical axis [marsac2009 E10, R10]
tian2017argument that stronger drug–polymer interactions lower the driving force, so that PVP acts "most likely" through both mobility and driving forcenoneprinted; Φ, m and χ not given; interactions cited from another paper [tian2017 E2, C30, C31, X13]
moseson2018framework for the melting depression of the drug in PVPVAnone directlyprinted; no numerical output [moseson2018 E1]
purohit2015aargument that, without hydrogen-bond donors, itraconazole–HPMC mixing is entropy-driven and may be limited at room temperaturenone (no χ, n or φ given)printed; not applicable [purohit2015a E1, C41, C42, C47]

Where it fails or is disputed

The notation differs between papers (mole numbers against size ratios against polymer segments), so a χ from one convention is not directly usable in another [marsac2006b E1; marsac2009 E10; moseson2018 E1]. The first two terms are the entropy of mixing and are small for a polymer; the curves depend on the lattice and on χ's constancy, while the melting-route χ refers to temperatures near the drug melting point [marsac2006b C11, C32]. The same function applied to a ternary water–drug–polymer system needs three χ values that cannot be transferred from the binary ones alonzo2010 C44. The driving-force argument of the indomethacin polymorph paper cannot explain why HPMC beat HPMCAS at high temperature, and χ was not measured for any of the three polymers [tian2017 C29, X13].

Concepts

free energy of mixing, entropy of mixing, Flory-Huggins theory, Flory-Huggins interaction parameter, drug-polymer miscibility, thermodynamic driving force for crystallization. Findings. Miscibility and drug-polymer interactions: F5, F6, F18. Physical stability: F4, F29.

← Concepts and formulas

formula · as used in Dissolution

flux definition

Expression

J = \frac{dm}{A\,dt} [indulkar2016 E11].

The same expression is printed for the side-by-side diffusion cell indulkar2018 E4; indulkar2019b E4.

Variables and units

symbolmeaningunits
mmass transferredµg
Amembrane area1.77 cm² [indulkar2016 P5]
Jfluxµg/(h·cm²)
Amembrane area of the side-by-side cell7.07 cm² indulkar2018 P8; indulkar2019b P3
Jflux, from the slope of receiver concentration against time with receiver volume and areaµg/(min·cm²) indulkar2018 R12

Assumptions and valid domain

Receiver concentration of each interval converted to mass; the outflow is non-cumulative [indulkar2016 P10, P5]. Sink conditions on the receiver side, so that the flux follows the donor activity; donor at the amorphous or the crystalline solubility of each medium, runs of about 40–60 min without crystallization indulkar2018 C9, P8, R15.

Use in the library

paperused forvalues or fitted parametersstatus / recomputed
indulkar2016Jmax of clotrimazole donors0.720 µg/mL × 1.8 mL/h / 1.77 cm² = 0.732 µg/(h·cm²)reproduces [indulkar2016 E11]
indulkar2017aatazanavir fluxA 7.07 cm²slopes not printed indulkar2017a E4
wilson2018enzalutamide mass flowno flux value printed; the 30 mm orifice would give A = 7.07 cm²not applicable [wilson2018 E3, R13, R15]
indulkar2018flux at the amorphous solubility of tacrolimus and cilnidipine in three media; ratio to the crystalline flux for atazanavir and ritonavir0.027–0.031 and 0.0014–0.0018 µg/(min·cm²); flux at the crystalline solubility not measurable for these two drugsslopes not printed indulkar2018 E4, R12, R13
indulkar2019bsupersaturation at the amorphous solubility of atazanavir in SDS mediastated about 65; no flux values printedinputs not printed indulkar2019b E4, R2, X6

Where it fails or is disputed

None found in the Bioperformance papers. For tacrolimus and cilnidipine the flux at the crystalline solubility was below what the method could measure, so the supersaturation ratio could not be formed and equality across media was assumed indulkar2018 R13, X4.

Concepts

membrane flux, sink conditions. Findings. Bioperformance: F2, F25. Crystallization from solution: F31, F38, F40.

← Concepts and formulas

formula · as used in Dissolution

Gordon-Taylor equation

Expression

As printed with a density-based constant:

T_g=\frac{w_1T_{g1}+Kw_2T_{g2}}{w_1+Kw_2},\qquad K=\frac{\rho_1T_{g1}}{\rho_2T_{g2}}

[moseson2018 E3]. As printed with the drug weight fraction w_1 and a fitted constant:

T_g=\frac{w_1T_{g1}+K(1-w_1)T_{g2}}{w_1+K(1-w_1)}

[li2019 E1].

As printed in the felodipine nucleation paper:

T_{g12} = \frac{w_1 T_{g1} + K w_2 T_{g2}}{w_1 + K w_2} [konno2006 E2]

K = \frac{T_{g1}\rho_1}{T_{g2}\rho_2} [konno2006 E3]

with a Couchman–Karasz constant:

K = \frac{\Delta C_{P1}}{\Delta C_{P2}} [konno2006 E4]

In the acetaminophen paper the Gordon–Taylor-type rule is cited in words only: the Tg of a miscible blend varies with the weight fraction and Tg of each component [trasi2012a E2].

As printed in the indomethacin release study, with a fitted constant:

T_{g,mix} = \frac{w_1 T_{g1} + k\,w_2 T_{g2}}{w_1 + k\,w_2} saboo2020 E3

As printed in the 2024 phase-diagram study of the phenolphthalein analogues:

T_{g,ASD} = \frac{w_d T_{g,d} + K\,w_p T_{g,p}}{w_d + K\,w_p} deac2024b E14

Variables and units

symbolmeaningunitids
T_gglass transition temperature of the miscible blendK[moseson2018 E3]
w_1, w_2weight fractions of drug and polymer–[moseson2018 E3]
T_{g1}, T_{g2}Tg of drug (IDM 43.7 °C) and polymer (PVPVA 104.2 °C); nanoTA: 367 K and 482 KK[moseson2018 M1, M2; li2019 E1]
Kconstant from true densities (0.932 with Tg in K) or fitted (0.628)–[moseson2018 E3; li2019 E1]
\rho, \Delta C_Pdensities 1.33 (felodipine), 1.25 (PVP), 1.29 (HPMCAS), 1.19 g/cm³ (HPMC); heat capacity steps 0.33, 0.20, 0.31, 0.25 J/g/Kg/cm³; J/g/K[konno2006 M1, M2, M3, M4]
T_{g,mix}Tg of the homogeneous film (indomethacin release study)°Csaboo2020 E3
w_1, T_{g1}weight fraction and Tg of indomethacin (53 °C by nanoTA)–, °Csaboo2020 E3
w_2, T_{g2}weight fraction and Tg of PVPVA (130 °C by nanoTA)–, °Csaboo2020 E3
kfitted constant, 0.91–saboo2020 E3

Assumptions and valid domain

A miscible, ideally mixing blend; K from the Simha–Boyer rule with Tg in kelvin (the temperature unit of K is not stated in the paper); for nanoTA the fit to softening temperatures of miscible rotary-evaporated films from 0 to 100% DL [moseson2018 E3; li2019 P10, R13]. The felodipine paper states that the components are miscible and their free volumes additive [konno2006 E2]. In the indomethacin release study: homogeneous films; Tg from nanoTA; k by partial least squares to films of 10–90% drug saboo2020 E3, R27.

Use in the library

paperused forvalues or fitted parametersstatus / recomputed
moseson2018formulation Tg line of IDM–PVPVA72.9 °C predicted against 72.2 ± 0.5 °C at 50/50reproduces within 0.05 °C for all predicted Tg (K = 0.932 with Tg in K) [moseson2018 E3, R5]
li2019local drug content from nanoTA softeningK = 0.628, Tg1 = 367 K, Tg2 = 482 Kreproduces (110 °C → 0.794; 180 °C → 0.174; 150 and 105 °C → 0.40 and 0.85) [li2019 E1, R16]
moseson2022cTg line of BCL–PVPVAK = 0.987 with Tg in K (BCL 52.3 °C, 1.35 g/mL; PVPVA 104.2 °C, 1.18 g/mL)reproduces: 88.5 °C at 30% BCL against about 89.6 °C read from the figure; the density choice is not stated [moseson2022c E6, R9]
shah2024Tg line of PCZ–HPMCASTg of PCZ 61 °C and HPMCAS 122 °C, densities 1.28 and 1.27 g/mLmismatch: printed line about 81.5 °C at 0.5 PCZ; 89.1 °C with K = 0.852 (Tg in K); 81.4 °C with K = 0.504 (Tg in °C), which matches the line at 0.1–0.9 within about 0.5 °C shah2024 E2, R6
konno2006ideal-mixing Tg lines for felodipine with PVP, HPMCAS, HPMCK 0.280, 0.398, 0.351 (Tg in °C)reproduces the plotted lines only with Tg in °C; with kelvin K 0.767, 0.845, 0.858 and all systems fall below [konno2006 E3, X3]
trasi2012aTg rises of 1.7–4.2 °C with 10% polymer read as miscibilitynoneprinted in words; polymer Tg values not printed [trasi2012a E2, R9, C17]
trasi2017context for the Tg drop of amorphous tacrolimus and its HPMC dispersion after 75% RHnonenamed only trasi2017 E7, R15
saboo2020inverting the local Tg of a dissolving 25% indomethacin–PVPVA film into its drug content111, 95, 88, 82 °C → 23, 44, 52, 60 wt% at 0–20 minreproduces: at 82 °C w_1 = k(T_{g2} - T_g)/(T_g(1 - k) - T_{g1} + k T_{g2}) = 0.601 against 60 ± 5; 111 °C gives 23 wt% saboo2020 E3, R28
deac2024bdry MePHPH–PVPVA Tg; Tg against water for the glass–gel boundaryK = 0.65; fitted water Tg 197.6–297.1 Kreproduces 349.3 against 349.1 K deac2024b E14, X11

Where it fails or is disputed

With Tg in °C, K = 0.466 and 50/50 would give 62.9 °C [moseson2018 E3]. nanoTA softening temperatures lie 20–60 °C above DSC Tg, so a nanoTA calibration is a separate fit, and a miscible 33% DL film (about 145–154 °C) reads as about 40% LPV on the curve [li2019 C25, X17]. Some drug-rich values lie below the pure-LPV calibration point [li2019 X16]. In the posaconazole paper the printed line matches K computed from Tg in °C, whereas in the indomethacin paper it matches K computed from Tg in K, and the unit of K is not stated in either [shah2024 E2; moseson2018 E3]. In the felodipine nucleation paper the temperature scale of the constant is not stated either and the plotted lines need °C [konno2006 X3]; the Couchman–Karasz constant as printed reproduces neither orientation [konno2006 X4]. The nanoTA method probes about 50 nm of a film, while FTIR and EDX of the same study probed tablets more deeply, so at 20 min the three estimates span about 60–72 wt% saboo2020 X15. Could not describe dry PHPH–PVPVA, whose Tg lay above both components deac2024b E14, R31.

Concepts

Gordon–Taylor equation, temperature-composition phase diagram, glass transition temperature, Couchman-Karasz equation, surface drug enrichment. Findings. ASD process: F7, F8, F15. Physical stability: F5, F18, F33. Release mechanism and LoC: F7, F30.

← Concepts and formulas

formula · as used in Dissolution

Henderson-Hasselbalch equation

Expression

\mathrm{pH} = \mathrm{p}K_a + \log_{10}\frac{[\mathrm{B}]}{[\mathrm{BH}^+]} indulkar2015 E1;

the un-ionized part of a measured total concentration:

C_U = \frac{X}{1+X}\,C_T,\qquad X = 10^{\mathrm{pH}-\mathrm{p}K_a} indulkar2015 E6;

and the pH-shift titration curve before and after precipitation (E4, E5), printed with the denominator 1 - (\Delta vol_1/\Delta vol_2)\times[\mathrm{sample}] indulkar2015 E4, E5, X18. Almeida e Sousa and co-workers name the relation without printing it almeidaesousa2016 E3.

The paper of 2018 prints the total-solubility form

C_T = \left(\frac{1 + X}{X}\right)C_U,\qquad X = 10^{\mathrm{pH} - \mathrm{p}K_a} sugihara2018 E1.

The Mesoporous silica paper on electrostatics names the equation without printing it and uses it for the ionized fraction and for crystalline pH-solubility profiles [hate2020b E1, P10, P11].

Variables and units

symbolmeaningunits
[\mathrm{B}], [\mathrm{BH}^+]concentration of the un-ionized base and its conjugate acidindulkar2015 E1
C_U, C_Tun-ionized and total concentrationµg/mL indulkar2015 E6
\mathrm{p}K_apKa of the base; in the Mesoporous silica paper ketoconazole 2.9 and 6.5, clozapine 7.3 (7.5 in the introduction), atazanavir 4.49[indulkar2015 M1, M2, M3; hate2020b M1, M2, M3, X1]

Assumptions and valid domain

A weak base is almost fully un-ionized two pH units above its pKa and almost fully ionized two units below indulkar2015 C16. The Mesoporous silica paper states none [hate2020b E1].

Use in the library

paperused forvalues or fitted parametersstatus / recomputed
indulkar2015percent ionized; un-ionized LLPS concentration; titrationclotrimazole pH 4: 98.7% ionized; clotrimazole pH 6: C_U 0.61 µg/mLreproduces (nicardipine pH 9 printed 0.9%, recomputed 1.6%) indulkar2015 E1, E6, X4
almeidaesousa2016expresses CRH1 concentrations at pH 4.6 as un-ionized drugnone printednamed only almeidaesousa2016 E3, C13
sugihara2018predicted crystalline and amorphous solubility curves of pazopanibpKa 6.4; C_U from the pH 8.4 valuesreproduces (crystalline at pH 4: 252 × 0.018 µg/mL = 4.5 µg/mL against about 4.8 read from the curve) sugihara2018 E1, R3
hate2020bionized fraction at pH 1, 4.5, 5.5 and 6.8ketoconazole about 100, 99, 91, 33%; clozapine about 100, 100, 98, 76%; atazanavir about 100, 50, 9, 0.5%reproduces (synthesis: at pH 6.8, 1/(1 + 10^(6.8 − 6.5)) = 33%, 1/(1 + 10^(6.8 − 7.3)) = 76%, 1/(1 + 10^(6.8 − 4.49)) = 0.5%) [hate2020b R1]
hate2020bcrystalline pH-solubility profilescurves leave their plateau near pH 5 (atazanavir), 7 (ketoconazole), 8 (clozapine)intrinsic solubilities not printed [hate2020b R19, P11]

Where it fails or is disputed

The printed percentage for nicardipine at pH 9 and atazanavir at pH 3.5 differ slightly from the recomputed values indulkar2015 X4. The clozapine pKa is 7.5 in the introduction and 7.3 in the calculations [hate2020b X1].

Concepts

Henderson-Hasselbalch equation, ionization, pKa, re-adsorption after pH shift. Findings. Amorphous solubility and LLPS: F10, F14, F23. Mesoporous silica: F6, F13.

← Concepts and formulas

formula · as used in Dissolution

Higuchi-Corrigan critical mixture ratio

Evidence table: Higuchi-Corrigan critical mixture ratio. Content from the release-mechanism chapter (2019–2020), with a row from the ASD dissolution chapter.

Expression

\frac{N_{drug}}{N_{polymer}} = \frac{D_{drug}\,C_{s(drug)}}{D_{polymer}\,C_{s(polymer)}} saboo2020a E4

\frac{N_A}{N_B} > \frac{D_A\,C_{SA}}{D_B\,C_{SB}} xie2016a E2

Named, without an expression, as the critical mixture ratio of the Higuchi two-component model, set by the relative solubilities and diffusivities of the components indulkar2019a E4.

Variables and units

symbolmeaningunit
Nweight fraction (proportion) of a component–
Ddiffusion coefficient–
C_s, C_Ssaturation solubility of a componentmg/mL

Assumptions and valid domain

Diffusion-controlled dissolution of a two-component system (cited) saboo2020a E4; physical mixture, non-interacting components, non-disintegrating surface indulkar2019a E4. For felodipine–PVPVA: amorphous solubility 8 µg/mL, PVPVA solubility 46 mg/mL (cited), D_{drug}/D_{polymer} = 10 saboo2020a R27.

Use in the library

paperused forvalues or fitted parametersstatus / recomputed
indulkar2019athe model fails for congruent release at 10–25% ritonavirnonenamed only indulkar2019a E4, C24
saboo2020acritical ratio of felodipine–PVPVAprinted 1.7 × 10⁻⁶mismatch: 10 × 0.008 / 46 = 1.7 × 10⁻³ saboo2020a X1, R27
xie2016a (ASD dissolution)basis of polymer control at low and drug control at high celecoxib loadingnonenot applicable xie2016a E2

Where it fails or is disputed

Both the printed and the recomputed ratio lie far below the 5–50% loadings tested, so the model predicts drug control where release was congruent saboo2020a X1, C36, C37. The SI calls the relation "equation 3" of the main article, which is Eq. (4) saboo2020a X1. Judging release by the drug:polymer ratio alone is "clearly an over simplification" saboo2020a C38.

Concepts

Higuchi two-component dissolution model, polymer-controlled release, Stokes-Einstein equation. Findings. Release mechanism and LoC: F2.

← Concepts and formulas

formula · as used in Dissolution

Hoffman equation

Expression

\Delta G_v = -\frac{\Delta H_{fus}\,(T_{melt,ons} - T)\,T}{T_{melt,ons}^{2}} [baird2010 E25];

\Delta G_v = -\frac{\Delta H_{fus}\,(T_{m} - T)\,T}{T_{m}^{2}} [vaneerdenbrugh2010a E2];

\Delta G_v = \frac{\Delta H_{m}\,(T_{m} - T)\,T}{T_{m}^{2}} [lu2016 E1].

Named but not printed in [baird2012 E6]. The sign differs between papers: the two 2010 papers print a leading minus sign, the 2016 paper does not and plots the negative of its own expression [lu2016 X17].

Two more printed forms. In the PEG dispersions paper the expression is printed without a leading sign and used inside the simplified solubility equation \ln[\gamma_d x_d] = -\Delta G_{fus}/(R\,T) [baird2011 E5]:

\Delta G_{fus} = \frac{\Delta H_{fus,d}\,(T_{melt,d} - T)\,T}{T_{melt,d}^{2}} [baird2011 E6].

In the solution-methods paper it is printed with a positive sign and \Delta T = T_m - T:

\Delta G = \frac{\Delta H_f\,\Delta T}{T_m}\cdot\frac{T}{T_m} [raina2015a E2],

which equals \Delta H_f\,(T_m - T)\,T/T_m^{2} and is the amorphous-minus-crystal free energy that enters e^{\Delta G/RT} of the amorphous solubility estimate.

The papers of the amorphous solubility chapter print the relation with a positive sign, as the amorphous-minus-crystal free energy that enters e^{\Delta G/RT}:

\Delta G_{a\to c} = \frac{\Delta H_f\,(T_m - T)\,T}{T_m^{2}} ilevbare2013a E2; indulkar2015 E3; mosqueragiraldo2015 E2; almeidaesousa2016 E2;

the 2015 Almeida e Sousa paper writes \Delta_{fus}H for the heat of fusion and \Delta G_{c\to a} for the direction almeidaesousa2015 E2. For atazanavir it is printed again,

\Delta G = \frac{\Delta H_f\,(T_m - T)\,T}{T_m^{2}} indulkar2017a E2.

The papers of the crystallization-from-solution chapter print it with a positive sign as well:

\Delta G_c = \Delta H_f\,\frac{(T_m - T)\,T}{T_m^{2}} hsieh2012 E3; hsieh2014 E2;

\Delta G_{a \to c} = \frac{\Delta H_{fus}\,(T_m - T)\,T}{T_m^{2}} ilevbare2012b E9; ilevbare2013c E7;

\Delta G_C = \frac{\Delta H_f\,(T_m - T)\,T}{T_m^{2}} ilevbare2013b E3;

\Delta G = \frac{\Delta H_f\,\Delta T\,T}{T_m^{2}}, \qquad \Delta T = T_m - T jackson2014 E2.

The moisture-induced separation paper of the physical-stability chapter prints it with a positive sign,

\Delta G_c = \Delta H_f\frac{\left(T_m - T\right)T}{T_m^{2}} [rumondor2009c E3],

and the felodipine kinetics paper names it without an expression [rumondor2009b E1].

The ASD dissolution papers print it as

\Delta G_c = \Delta H_f\,\frac{(T_m - T)\,T}{T_m^{2}} konno2008a E2,

\Delta G = \frac{\Delta H_f\,\Delta T\,T}{T_m^{2}} alonzo2010 E2; alonzo2011 E3,

and, with the sign that makes \Delta G negative,

\Delta G = -\frac{\Delta H_f\,(T_m - T)\,T}{T_m^{2}} duong2022a E2.

Variables and units

symbolmeaningunits
\Delta G_vfree energy difference between crystal and amorphous or liquid stateJ/cm³ after conversion with crystalline density [vaneerdenbrugh2010a E2, E5; baird2010 E25]; kJ/mol [lu2016 E1]
\Delta H_{fus}, \Delta H_menthalpy of fusionkJ/mol or J/cm³ [baird2010 E26; vaneerdenbrugh2010a E1]
T_m, T_{melt,ons}melting temperature (onset)K [vaneerdenbrugh2010a E1; lu2016 E1]
Ttemperature of evaluation293.15 K [baird2010 E25; vaneerdenbrugh2010a E2], 298 K [baird2012 E6], crystallization temperature [lu2016 E1]; 25 or 37 °C hsieh2014 E2; ilevbare2012b E9
\Delta G_{fus}, \Delta H_{fus,d}, T_{melt,d}free energy difference between crystalline and liquid drug at T (298.15 K in the check); heat of fusion of the drug in kJ/mol; its melting temperature\Delta H_{fus,d} in kJ/mol; temperatures in K; unit of \Delta G_{fus} not printed [baird2011 E5, E7]
\Delta H_fmolar heat of fusionnot printed [raina2015a E2]
\Delta TT_m - TK [raina2015a E2]
\Delta G_{a\to c}amorphous-minus-crystal free energy that enters e^{\Delta G/RT} in the amorphous solubility papers (\Delta G_{c\to a} in the 2015 Almeida e Sousa paper)kJ/mol in the use table below ilevbare2013a E2; almeidaesousa2015 E2
\Delta G_c, \Delta G_Cfree-energy difference between amorphous (supercooled liquid) and crystalkJ/mol hsieh2012 E3; ilevbare2013b E3
\Delta H_f, T_m, T in the moisture paperheat of fusion; melting and evaluation temperatureskJ/mol; K [rumondor2009c E3]
\Delta G_c, \Delta G (ASD dissolution papers)free-energy difference between amorphous and crystalline drugJ/mol konno2008a E2; alonzo2010 E2

Assumptions and valid domain

Lu et al. call it an approximation [lu2016 E1]. Papers outside this chapter state that it assumes enthalpies of crystal and supercooled liquid linear in temperature and applies above Tg [marsac2006a E3; marsac2006b E4], that it assumes a constant heat-capacity difference and small undercooling almeidaesousa2015 E2, and that it may not suit large undercoolings mosqueragiraldo2015 E2. In this chapter it is evaluated at room temperature, far below Tm and below Tg for many compounds [baird2010 E25; baird2012 E6]. In the PEG dispersions paper it is used as an estimate of \Delta G_{fus} from thermal properties, with the drug solubility in PEG 400 as a proxy for the polymer [baird2011 E6, C20, C21]. In the solution-methods paper no assumptions are stated beyond the reference; ΔHf and Tm come from DSC at 10 °C/min [raina2015a E2, P4]. In the amorphous solubility papers the assumptions are a constant, temperature-independent ΔCp, small undercooling and Tg close to T∞ almeidaesousa2015 C8, and a temperature of interest "reasonably close to Tm", which is violated for telaprevir (Tm 238 °C, 37 °C) mosqueragiraldo2015 C24, M1. The pH-shift and crystal-growth papers state that the enthalpies of crystal and supercooled liquid vary linearly with temperature, "to a first approximation" hsieh2014 E2; jackson2014 E2; ΔHf and Tm come from DSC of the crystalline material and temperatures must be in kelvin hsieh2012 E3. The felodipine kinetics paper states that it applies to a pure amorphous drug; with polymer and sorbed water a reasonable estimate is "extremely difficult" [rumondor2009b C17]. In the ASD dissolution papers it is called increasingly approximate far below Tg (cited) alonzo2011 C5 and was judged a good estimate for felodipine in earlier work (cited) konno2008a R20.

Use in the library

paperused forvalues or fitted parametersstatus / recomputed
baird2010ΔGv descriptor in the class PCAclass I contribution −0.40 (more negative ΔGv)inputs not printed [baird2010 E25, R22.g]
vaneerdenbrugh2010aΔGv descriptor in the class PCAcontributions −0.29, +0.29, +0.13 for classes I, II, IIIinputs not printed [vaneerdenbrugh2010a E2, R20.e]
baird2012ΔGv column at 298 K−8.6 (lidocaine) to −54.7 J/cm³ (acetaminophen)named only; the standard form reproduces the other 33 rows within about 0.6 J/cm³, ritonavir printed −37.6 against about −21.4 [baird2012 E6, M5, M12, X2]
lu2016driving force of α and β vemurafenib; virtual transitionα 11.0 kJ/mol at 115 °C; transition 319 °Creproduces [lu2016 E1, R22]
marsac2006afelodipine and nifedipine driving force6.22 and 8.83 kJ/mol at 25 °Creproduces [marsac2006a E3]
ilevbare2013cdriving force at 37 °C (extractor calculation)ritonavir ≈10.2, efavirenz ≈2.70, celecoxib ≈7.74 kJ/molinputs not printed for a stated output ilevbare2013c E7
baird2011\Delta G_{fus} inside the activity coefficient of four drugs in PEG 400 at 25 °Cno \Delta G_{fus} value printednot applicable; checked through the activity coefficient (0.614 for chlorpropamide, reproduces) [baird2011 E6, E7]
raina2015aΔG in the amorphous solubility estimate of six dihydropyridinesΔHf and Tm not printedinputs not printed [raina2015a E2]
ilevbare2013aΔG inside Eq. 1 for eight drugsritonavir 10.1 kJ/mol at 37 °C from Table 2 inputsno ΔG printed; recomputed ilevbare2013a E2
almeidaesousa2015comparator of the Cp method3.24–10.33 kJ/mol for six drugsreproduces (ibuprofen 3.25 against 3.24 kJ/mol) almeidaesousa2015 E2, R11
indulkar2015ΔG at 310 K for clotrimazole and atazanavir6.26 kJ/mol (clotrimazole, with an unprinted molar mass)inputs not printed indulkar2015 E3
mosqueragiraldo2015telaprevir13.31 kJ/mol; amorphous solubility 245 ± 5 µg/mLreproduces mosqueragiraldo2015 E1, E2
almeidaesousa2016CRH15.68 kJ/molreproduces (5.685) almeidaesousa2016 E2
indulkar2017aΔG of atazanavir inside Eq. 314.55 kJ/mol from Table I (ΔHf 90.1 J/g, Tm 208 °C, 310 K)not printed; with 0.22 read as exp[−I(a)] it gives the printed 62, and about 228 read as I(a) (synthesis) indulkar2017a E2, X1; indulkar2015 M2
hsieh2012amorphous solubility of five basesΔHf, Tm not printedinputs not printed hsieh2012 E3
ilevbare2012britonavirΔHf 60.4 kJ/mol, Tm 121 °C, 37 °CΔG 10.1 kJ/mol, exp(ΔG/RT) 50.8 (extractor) ilevbare2012b E9
hsieh2014glyburide, warfarin175.6 °C and 45.5 kJ/mol; 169.2 °C and 43.6 kJ/molreproduces: 59.9 and 47.7 at 25 °C hsieh2014 E2, E3
jackson2014danazolΔHf 28.9 kJ/mol, Tm 225.4 °CΔG 6.95 kJ/mol; ratio 15.4 against 19.6 printed jackson2014 E1, E2
duong2022bposaconazole, 310 K\Delta G = \Delta H_f(T_m - T)T/T_m^{2}Tm 442.25 K, ΔHf 76.95 J/g; ΔG 16.13 J/g by the extractor duong2022b E3, X2
rumondor2009cdriving force of six drugs tested as a predictor of moisture-induced separation4.1 (ketoprofen) to 11.0 kJ/mol (pimozide); nifedipine 8.2, felodipine 6.1reproduces (nifedipine 8.23, pimozide 10.97, ketoprofen 4.14) [rumondor2009c E3, M1, M2, M5]
rumondor2009bnamed as the pure-drug driving forcenonenamed only [rumondor2009b E1]
konno2008afelodipine amorphous solubility, 37 °Cratio about 10, about 9.5 µg/mLinputs not printed konno2008a E2, R17
alonzo2010felodipine, 37 °C30.12 kJ/mol, 143.41 °C: ΔG 5729 J/mol, ratio 9.22 against about 9reproduces alonzo2010 E1
alonzo2010indomethacin, 37 °C; 25 °C32.48 kJ/mol, 153.4 °C: ΔG 6445 J/mol, ratio 12.17, 36.5 against about 37 µg/mL; 15.8–23.6 against printed 17–25 µg/mLreproduces; mismatch at 25 °C alonzo2010 E2, X2
alonzo2011felodipine, 37 and 25 °Cabout 9.1 and 5–6 µg/mLinputs not printed alonzo2011 E3, M1
duong2022adelamanid amorphous-to-crystalline solubility ratio at 37 °C, against the measured 42.3ratio 31.8; Tm 196.1 °Cinputs partly printed; (synthesis: a ratio of 31.8 at 310 K needs ΔG ≈ 8.9 kJ/mol, so ΔHf ≈ 39.8 kJ/mol) duong2022a E2, R27, M1

Where it fails or is disputed

The ΔGv term does not rank the classes monotonically: class II, not class III, has the most positive contribution [vaneerdenbrugh2010a X10]. A printed ΔGv in one table does not follow from its own inputs [baird2012 X2]. Similar viscosity with a twofold different ΔGv weakens a viscosity-only comparison [baird2012 X9]. For vemurafenib the larger driving force of α did not make α dominate at 120–190 °C [lu2016 C52]. Outside this chapter, errors at large undercooling are reported almeidaesousa2015 E2; mosqueragiraldo2015 E2. In the PEG dispersions paper the relation is evaluated at 25 °C, far below the melting points of 126.7–151.7 °C, and the result is the activity coefficient of F3 of the PEG dispersions chapter [baird2011 E7, M1, M2, M3, M4]. In the solution-methods papers, for diverse drugs the heat-capacity method gave estimates much closer to measured LLPS onsets almeidaesousa2015 C43; the Hoffman-based danazol estimate (16 µg/mL) was above the measured 13 µg/mL jackson2014 R5. In the amorphous solubility papers it lacked accuracy for diclofenac (28.9 against 52.2 measured ratio) and telaprevir (2.7 times the onset) almeidaesousa2015 R13, R5; mosqueragiraldo2015 R17; Table 10 of the six-drug paper does not predict the size of the error almeidaesousa2015 X8. The DSC method and some inputs are not stated hsieh2014 X11; hsieh2012 X14. The danazol ratio of 19.6 cannot be reproduced jackson2014 X1. The temperature of the warfarin and glyburide calculation is not printed (25 °C assumed) hsieh2014 E2. In the physical-stability papers the driving force did not sort the six drugs by moisture-induced separation [rumondor2009c C32]; for nifedipine against felodipine it pointed the right way for nucleation (F2 of the physical stability chapter) [marsac2006a R4.l]. The 25 °C indomethacin range of the 2010 dissolution paper does not reproduce from its inputs alonzo2010 X2. Felodipine concentrations of 14.1 µg/mL measured by UV exceed the 9.5 µg/mL estimate of the same 2008 paper konno2008a X5. For delamanid the estimate lies about a quarter below the measured ratio (42.3), which the authors call "reasonable agreement" duong2022a R27, C43.

Concepts

Hoffman equation, thermodynamic driving force for crystallization, enthalpy of fusion, degree of supercooling, activity coefficient, amorphous-crystalline free energy difference, amorphous solubility advantage. Findings. Crystallization tendency: F6, F7, F13. PEG dispersions: F3. Solution methods: F5. C. Amorphous solubility and LLPS: F5, F7. Crystallization from solution: F2, F16. Physical stability: F2, F13. Supersaturation from ASD dissolution: F5, F7, F23.

← Concepts and formulas

formula · as used in Dissolution

ideal-mixing reduction of amorphous solubility

Expression

S_a(x_1) = S_a^{\circ}\,x_1 trasi2015a E4,

for the second drug S_a(x_2) = S_a^{\circ}(1 - x_1), from the ideal-mixing chemical potentials

\mu_1 = \mu_1^{\circ} + RT\ln x_1,\qquad \mu_2 = \mu_2^{\circ} + RT\ln(1 - x_1) trasi2015a E2, E3.

The papers of 2017–2022 print the relation for a polymer as the second component,

S_a = S_a^{0}\,x_{drug} ueda2021 E2

and

\frac{S_a}{S_a^{0}} = x_{drug} ueda2022 E2.

For binary and ternary drug mixtures, applied to the free concentration and to the Caco-2 flux, the relation is printed as

S_1 = S_{A1}\,X_1, \qquad J_1 = J_{A1}\,X_1, \qquad X_1 = \frac{n_1}{n_1+n_2+n_3+\cdots} [alhalaweh2016 E7, E8, E9].

The ASD dissolution papers print it for one drug of a two-drug film or dispersion,

C_{max} = S_a\,x_d trasi2015b E1,

and for a drug in an undissolved polymer by weight fraction,

C_{max} = S_a\,w_d li2018 E7, printed in words as a straight line from 0 µg/mL at 0% to the amorphous solubility, 17.4 µg/mL, at 100% drug loading.

Variables and units

symbolmeaningunits
S_a(x_1)amorphous solubility of drug 1 at mole fraction x_1 in the drug-rich phaseµg/mL trasi2015a E4
S_a^{\circ}amorphous solubility of the pure drugµg/mL, ultracentrifuge values 26.2 and 17.1 trasi2015a R1, X14
x_1mole fraction of drug 1 among the drug molecules in the drug-rich phasedimensionless trasi2015a E4
S_1free concentration of drug 1 with a drug-rich phase containing other drugsM [alhalaweh2016 E7]
S_{A1}amorphous solubility of drug 1 aloneM [alhalaweh2016 E7]
X_1mole fraction of drug 1 in the drug-rich phase– [alhalaweh2016 E9]
J_1, J_{A1}flux with and without the other drugsmg/min/cm² [alhalaweh2016 E8]
C_{max}maximum bulk concentration of one drugµg/mL trasi2015b E1; li2018 E7
S_aamorphous solubility of that drug alone (25 µg/mL ritonavir, 17 µg/mL lopinavir)µg/mL trasi2015b E1
x_dmole fraction of the drug in the amorphous mixture or drug-rich phasedimensionless trasi2015b E1
w_ddrug weight fraction (drug loading) of the dispersiondimensionless li2018 E7

Assumptions and valid domain

Constant aqueous activity coefficients, droplets of about 350 nm too large to raise solubility, the same water content in single and mixed drug-rich phases, and the single-drug amorphous solubility as S_a^{\circ} trasi2015a C38. Tested for ritonavir–lopinavir at x = 0.06–0.70, 25 °C trasi2015a R16. Ideal mixing in the drug-rich phase and amorphous miscibility of the drugs [alhalaweh2016 C26]; tested for ritonavir, atazanavir and lopinavir in PVP. In the ASD dissolution papers the two amorphous drugs mix ideally (cited) trasi2015b C38; tested for ritonavir–lopinavir films and dispersions trasi2015b R5, R17. The 2018 line scales the amorphous solubility with the drug weight fraction ("ideal behavior") li2018 E7.

Use in the library

paperused forvalues or fitted parametersstatus / recomputed
trasi2015abulk ritonavir and lopinavir against the ritonavir mole fractionlines 0 to about 20.8 µg/mL (ritonavir) and about 16.8 to about 3.4 µg/mL (lopinavir) for x = 0 to 0.8reproduces (26.2 × 0.8 = 20.96; 17.1 × 0.2 = 3.42) trasi2015a E4, R16
ueda2021dilution argument for polymer in the ibuprofen-rich phasenone (not evaluated numerically)not applicable ueda2021 E2
ueda2022qualitative link of Sa/Sa0 with the polymer contentno x_drug values printedthe per-chain mole fraction stays at 0.97 or more while Sa/Sa0 reaches 0.52–0.54 (extractor calculation) ueda2022 E2, X3, R17
other chaptersideal-mixing line for binary amorphous mixtures and polymer dispersionsnoneprinted; not recomputed here [trasi2015b E1; alhalaweh2016 E7; li2018 E7]
alhalaweh2016binary and ternary ceilings; Caco-2 fluxclinical 1:3 ratio: X_RTV = 0.246; 0.5 × 10.5 × 10⁻⁵ = 5.25 × 10⁻⁵reproduces [alhalaweh2016 E7, E8, E9]
li2018lopinavir ASD films17.4 × 0.50 = 8.7 µg/mLreproduces li2018 E7
trasi2015bfilm plateaus at 7:3, 5:5, 3:7five of six within 0.5 µg/mL; RTV 7:3 15.2 against 16.7 µg/mLprinted comparison trasi2015b R5
trasi2015b5:5 film with literature molecular weightsx_RTV 0.466: 11.6 and 9.1 µg/mL against printed 11.6 and 9.0reproduces trasi2015b E1
trasi2015bHPMCAS dispersions against the lineRTV on the line; LPV up to about 15% belowapproximate trasi2015b R17, X8
li2018positions of the polymers against the lineHPMCAS slightly above; CAP at 15–50% and EC at 50–85% drug near it; HPMCP belowprinted comparison li2018 C20, R3

Where it fails or is disputed

Ritonavir points lie 2–4 µg/mL above the line, no fit statistic is given, and which column of Table 1 supplied S_a^{\circ} is not stated trasi2015a X9, X14. Only one pair was modelled trasi2015a C43. For polymers the assumptions of similar molar volumes and adhesive interactions equal to cohesive ones fail, and the relation cannot reproduce the size of the solubility loss; it is used qualitatively ueda2021 C28; ueda2022 X3. In alhalaweh2016 the drug-rich phase composition was computed by mass balance and ideality was not measured [alhalaweh2016 C17]; the NTA count of the mixture does not show the phase below the single-drug limits [alhalaweh2016 X6]. The plotted RTV line ends at about 26 rather than 25 µg/mL; the mole fractions need molecular weights the paper does not print trasi2015b X3, E1. The authors read positions above or below the 2018 line as weaker or stronger interaction than ideal, but the line is proportional dilution by weight, whereas the 2015 relation uses mole fractions; with χ = 0 and a large polymer the Flory–Huggins drug activity at a drug volume fraction of 0.5 is about 0.82, above the line (extractor calculation) li2018 X2, C20; trasi2015b E1.

Concepts

ideal mixing, chemical potential, drug-rich phase, drug–drug miscibility, amorphous solubility. Findings. Amorphous solubility and LLPS: F11, F19, F20, F21. Bioperformance: F6, F20. Supersaturation from ASD dissolution: F11, F18.

← Concepts and formulas

formula · as used in Dissolution

induction time decomposition

Expression

t_{ind} = t_n + t_g ilevbare2013c E2

t_{ind} \propto J^{-1} ilevbare2013c E3

Both relations are printed in the same form in the celecoxib dispersion papers xie2015 E1, E2; xie2016a E4.

Variables and units

symbolmeaningunit
t_indmeasured induction time, from creating the supersaturation until crystals are detectedmin
t_ntime to form stable nucleimin
t_gtime for nuclei to grow to detectable sizemin
Jnucleation ratem⁻³ s⁻¹

Assumptions and valid domain

The proportionality holds if steady-state nucleation is reached quickly and t_n \gg t_g; nuclei are detectable only after growth ilevbare2013c C14, E2. The relation was not tested for the three drugs or the polymers ilevbare2013c X14. In the celecoxib papers the proportionality is stated as an assumption ("If it is assumed") xie2015 C41; the onset is read from the abrupt rise of extinction at 350 nm together with the fall of absorbance at 249 nm xie2016a C9.

Use in the library

paperused forvalues or fitted parametersstatus / recomputed
ilevbare2013creading polymer effects on induction time as nucleation-rate effectsinduction times about 2.4–855.5 mininputs not printed ilevbare2013c E2, E3
xie2015celecoxib dispersions (ASD dissolution chapter); celecoxib 22 µg/mL with 5 µg/mL polymers, pH 6.8, 37 °Cdecomposition printed as E1; proportionality as E2; induction within 5 min without polymer, ≈1 h PVP-K12, ≈2 h PVP-K29/32, more than 8 h HPMCAS, HPMCprinted xie2015 E1, E2; no t_n or t_g printed xie2015 E1, R1
xie2016acelecoxib with PAA and cellulose derivatives; with HPMCASdecomposition printed; 960 min taken as the induction time with HPMCAS, an underestimateprinted xie2016a E4; no component times printed xie2016a E4, C39
chen2015t_ind = t_n + t_g, not separated11 drugsprinted chen2015 E1, C5
li2016asame, with t_n >> t_g assumedthree drugs, 13 bile saltsprinted in words li2016a E4
mosqueragiraldo2016T_ind = T_n + T_growthtelaprevir, 26 polymersprinted mosqueragiraldo2016 E1
lu2017t_ind = t_n + t_g, read as nucleation when t_n dominatestelaprevir, six bile saltsprinted lu2017 E3, C9
trasi2015t_j = t − t_g with t_g fittedacetaminophen: t_g 7.8–928 sfitted trasi2015 E4, R3
indulkar2018lecithin, bile salt and SIF media, four drugsinduction time as first scattering rise; components not separatednot applicable indulkar2018 E5
lu2018telaprevir in bile salt mixtures and complete mediat_{ind} = t_n + t_gnot applicable lu2018 E2
indulkar2019batazanavir in SDSadditive may act on either partnot applicable indulkar2019b E5, C29
enright2020atazanavir in phospholipid-digest and volunteer mediaprinted in wordsnot applicable enright2020 E1
elkhabaz2021atazanavir, posaconazole in six mediaT_{ind} = T_{crit} + T_{grow}, read as nucleation onsetnot applicable elkhabaz2021 E1
que2018unseeded paclitaxel at S ≈88 with and without 20 µg/mL HPMCASwithin 6 min against more than 16 hno component times printed; growth on seeds continued in the same system que2018 R3, C30

Where it fails or is disputed

A polymer that slows early growth also lengthens t_{ind}, and for strong inhibitors the extinction rises above the baseline before the fitted onset (about 25 against 31.5 min; about 180 against 260 min), so values depend on where the lines are drawn ilevbare2013c X14, R6. The detection method changes the time (SHG earlier than a probe ratio) jackson2014 R25. The seeded and unseeded comparison shows that for STC and SGC the nucleation part dominates but for STCDC and SGCDC growth does lu2017 R10; lu2017a R14, C37; in the acetaminophen study the induction time is the time to massive nucleation trasi2015 C32. In the SDS study crystal size and agglomeration change across the same threshold as the induction time, so a change in the growth term cannot be excluded indulkar2019b X7, X5. Neither celecoxib paper separates t_n from t_g xie2015 E1; xie2016a E4 (synthesis: growth was slowed about 70-fold with HPMCAS xie2016a R12, so part of the longer induction time may come from t_g). For paclitaxel the polymer that lengthened the unseeded induction time beyond 16 h only slowed growth on seeds, so the induction time of an unseeded test says little about a dispersion that carries crystals que2018 R3, R14.

Concepts

nucleation induction time, nucleation rate, nucleation inhibition. Findings. Crystallization from solution: F3, F5, F13, F14, F27, F28, F29, F31, F32, F33, F35, F38, F39. Supersaturation from ASD dissolution: F4, F6, F20, F22.

← Concepts and formulas

formula · as used in Dissolution

initial growth rate from the desupersaturation slope

Expression

R_g = \text{slope of } C \text{ against } t \text{ over the first 2 min} ilevbare2012a E4

C_t = -R_g\,t + b ilevbare2013b E8

Variables and units

symbolmeaningunit
R_ginitial bulk crystal growth rateµg mL⁻¹ min⁻¹ or µg min⁻¹
C, C_tdissolved drug concentration or amount (in 50 mL) at time tµg/mL or µg
ttime after seedingmin
bintercept (starting amount)µg

Assumptions and valid domain

Desupersaturation reflects growth of the seeds, and the curve is linear over the first 2 min ilevbare2012a C14; ilevbare2013b E8. For felodipine the slope is taken over 5 min alonzo2012 P4. Tested for ritonavir, celecoxib and efavirenz at 37 °C and felodipine at 25 °C.

Use in the library

paperused forvalues or fitted parametersstatus / recomputed
ilevbare2012aritonavir growth rates and ratios1.56 µg mL⁻¹ min⁻¹ at 10 µg/mL (text), about 1.4 (figure)concentration–time curves not printed ilevbare2012a E4, X5
ilevbare2013bcelecoxib at 10 µg/mL, no polymer and with CA 320S Sub 0.63−69.80 t + 487.46; −11.88 t + 482.40 µgreproduces (≈488 to ≈348 µg in 2 min gives ≈70 µg min⁻¹) ilevbare2013b E8, R8
schram2015slope of concentration against time over 1 h taken as the growth ratefelodipine S 8schram2015 C5, E4
lu2017ainitial slope over 30 min (δ 2.4) or 10 min (higher δ), in µg/min for 50 mL5.4, 58.6, 89.2 µg/min in bufferplot readings; per vessel lu2017a R2, X12

Where it fails or is disputed

The same no-polymer condition gives 71.0, 69.80 and about 68 µg min⁻¹ in three places of the celecoxib paper, outside the printed standard deviations ilevbare2013b X7. At near-amorphous-solubility concentrations the slope may include secondary nucleation or a drug-rich phase ilevbare2012b X18. Seed mass, volume and methanol fraction are often not printed ilevbare2012c X16.

Concepts

desupersaturation, crystal growth rate. Findings. F5, F7, F23, F33.

← Concepts and formulas

formula · as used in Dissolution

Jackson interface-kinetics growth rate

Expression

U = \frac{2 k_B T}{\pi \lambda^2 \eta}\, f \left[1 - \exp\left(-\frac{\Delta H\,\Delta T}{k_B T\,T_m}\right)\right] \exp\left(-\frac{\Delta S}{k_B}\right) [trasi2014a E1].

Variables and units

symbolmeaningunits
Ucrystal growth ratenot stated [trasi2014a E1]
\lambdaaverage diffusion jump distancenot stated
\etaviscosityPa·s (cited data) [trasi2014a P7]
ffraction of interface sites that are active growth sitesdimensionless
\Delta H, \Delta Senthalpy and entropy difference between liquid and crystalnot stated
T, T_m, \Delta Ttemperature, melting temperature, undercoolingK

Assumptions and valid domain

Stokes–Einstein holds and viscosity describes diffusion at the interface in the studied range [trasi2014a C20]; not near Tg, where diffusion decouples from viscosity [trasi2014a C21]. The entropy term reflects the fraction of molecules with the right orientation to join the crystal [trasi2014a C31].

Use in the library

paperused forvalues or fitted parametersstatus / recomputed
trasi2014aframework for the driving-force correction and the entropy fitnone fitted directlyinputs not printed (λ, f and η(T) not given) [trasi2014a E1, R10, R11]

Where it fails or is disputed

At similar viscosity the drugs fell into two sets whose corrected growth rates differ by about 2–3 orders of magnitude, so factors beyond viscosity and driving force contribute [trasi2014a C30]. The 2012 viscosity study used a related screw-dislocation form without the entropy term [baird2012 E3].

Concepts

crystal growth rate, melt viscosity, entropy of fusion, thermodynamic driving force for crystallization. Findings. F2, F6.

← Concepts and formulas

formula · as used in Dissolution

Kubota-Mullin model

Expression

\frac{R}{R_0} = 1 - \alpha\,\theta_{eq} alonzo2012 E5; ilevbare2012b E7

A model of growth inhibition by an adsorbed impurity based on step pinning: the growth rate with impurity relative to that without falls linearly with the surface coverage, where α is an effectiveness factor that depends on the surface energy, the molecular area, the supersaturation and the spacing of adsorption sites, \alpha = \gamma a/(kT\,(\ln S)\,L) alonzo2012 E5, E7; ilevbare2012b E7. It was developed for inorganic systems; Alonzo and co-workers state that, to their knowledge, it had not been used for polymers on organic pharmaceutical crystals alonzo2012 C10. The authors extend its proportionality between step, face and mass growth-rate ratios to bulk de-supersaturation rates alonzo2012 C4, E4. Both felodipine–HPMCAS papers print V_P/V_0 = 1 - \rho_c/l and apply it to AFM spacings: with l 68.5 nm and ρc 3.98 nm it gives 0.94, and with l 15.8 nm it gives 0.75, against measured rate ratios of 2.7 and about 12 schram2015 E3; schram2016 E4, R12, R14, X3. (This page also holds the former concept page "Kubota-Mullin model", whose content is about the same equation.)

Variables and units

symbolmeaningunit
R, R_0overall mass growth rate with and without polymerµg mL⁻¹ min⁻¹
αimpurity effectiveness factordimensionless
θ_eqequilibrium surface coverage by adsorbed polymerdimensionless

Assumptions and valid domain

Langmuir-type adsorption (isotherm fit, here shifted by hand for felodipine); the proportionality between step, face and overall mass growth-rate ratios extends to bulk de-supersaturation rates; constant seed surface area and face-area ratios; applies only below the kinetic roughening transition alonzo2012 C4, C5, C6, C23; ilevbare2012b E7. How the parameters are obtained: seeded growth rates with and without polymer at several polymer concentrations give R/R_0; the coverage \theta_{eq} comes from an adsorption isotherm fit (modified Langmuir, Langmuir–Freundlich); α is chosen so that the line fits the measured ratios at one supersaturation alonzo2012 P9; ilevbare2012b P11, E6.

Use in the library

paperused forvalues or fitted parametersstatus / recomputed
alonzo2012felodipine with HPMC at S 8α 0.4 (text, table) or 0.45 (Fig. 5 caption)reproduces with 0.45: 1 − 0.45 × 0.631 = 0.716 against 0.71 plotted; mismatch with 0.4 alonzo2012 E5, X1
alonzo2012felodipine with HPMC, α at S 3, 5, 8, 10, 120.7, 0.5, 0.4, 0.6, 0.2 (25 °C)as printed alonzo2012 R9
alonzo2012plateaus of R/R00.65 (S 5) and 0.55 (S 10) quotedmismatch: 1 − α at θ = 1 from Table 1 gives 0.5 and 0.4 alonzo2012 E5, X2
ilevbare2012britonavir with CAP Adp 0.85, σ 0.99, 37 °Cα = (1 − 0.80)/0.16 = 1.25, θ 0.16, R/R0 0.80 (pH 3.8); α = 1/0.23 = 4.35, θ 0.23, R/R0 0 (pH 6.8)reproduces ilevbare2012b E7, R16
ilevbare2012b, alonzo2012reading of αα about 1: adsorbed molecules one critical-nucleus diameter apart at full coverage; above 1: closer, so growth can stop below full coverageinterpretation ilevbare2012b E13; alonzo2012 C25
schram2015R_P/R_0 = 1 − ρc/l with l the globule spacingpH 3 l 44 nmqualitative schram2015 E3, C18
schram2016same with measured spacing and critical radius, HPMCAS on buffer-grown and dispersion-grown felodipine seeds (S 4, 25 °C); see the pinning formulal 68.5 and 15.8 nm; ρc 3.98 nm; predicted rate ratios about 1.06 and 1.34recomputed schram2016 E4, R12, R14, X3

Where it fails or is disputed

α at pH 6.8 was derived from the point it is compared with and is a lower bound; the low-concentration points disagree (0.44–0.09 measured against 1.00–0.96 calculated) ilevbare2012b X8, R15. The coverage of the felodipine fit is model-dependent alonzo2012 X12. The model was not tested above σ_c ilevbare2012b X11. With the printed l and ρc the model gives much smaller effects than measured schram2016 X3. The felodipine α at S 8 is 0.4 in text and table and 0.45 in the Fig. 5 caption; the plateaus quoted "from the alpha estimates" do not follow from Table 1; the coverage was shifted by hand alonzo2012 X1, X2, X12. The ln S in eq 7 replaces the low-supersaturation approximation S − 1 of the original alonzo2012 C7. The arrest criterion is stated as l ≤ ρc and as l ≤ 2ρc, and ρc was not estimated in the 2015 paper schram2016 X1; schram2015 X7.

Concepts

impurity effectiveness factor, surface coverage; based on step pinning; related to polymer adsorption. Related formulas. Kubota-Mullin impurity effectiveness factor, Langmuir-Freundlich isotherm, proportionality of step velocity and growth rate ratios. Findings. Crystallization from solution: F9, F10, F11, F23, F24.

← Concepts and formulas

formula · as used in Dissolution

lever rule

Evidence table: lever rule. Content from the release-mechanism chapter (2023–2025), with a row from the Physical stability chapter.

Expression

Printed in words: the ratio of the amount of phase A to that of phase B equals the ratio of the length BX to AX, X being the overall composition on the tie line joining A and B [yang2022b E1]. Written with these symbols (synthesis: no equation printed):

\frac{m_A}{m_B} = \frac{\overline{BX}}{\overline{AX}}

Named only in the 2023 phenolphthalein-analogue paper deac2023b E5.

Printed in 2024:

W^{\alpha} = \frac{m^{\alpha}}{m^{T}} = \frac{W_i^{T} - W_i^{\beta}}{W_i^{\alpha} - W_i^{\beta}} deac2024b E12

and stated in words for a ritonavir diagram in 2023 yang2023 E2.

Variables and units

symbolmeaningunit
m_A, m_Bamounts of the coexisting phases A and Bany consistent amount
\overline{AX}, \overline{BX}lengths on the tie line from the overall composition X to A and to B–

Assumptions and valid domain

Thermodynamic equilibrium, with the compositions joined by a tie line [yang2022b E1]; complete separation to the binodal compositions immediately on entering the unstable region deac2023b E5.

Use in the library

paperused forvalues or fitted parametersstatus / recomputed
yang2022b (Physical stability)phase amounts along hydration paths of a schematic ritonavir–PVPVA–water diagramnoneinputs not printed [yang2022b E1, C50]
deac2023bmajority phase and hydrophobic-phase volume against drug load, schematicnonenamed only deac2023b E5, C34, C36
yang2023amount of drug-rich phase on schematic ritonavir–PVPVA–water diagrams with and without SDSnoneschematic yang2023 E2, C41
deac2024bdrug-rich fraction at the spinodal against loading, from PC-SAFT diagramsW^{\alpha} ≈0.15 → 0.82 (MePHPH, 27 → 39.5%)inputs not printed; Table S1 row d fails the mass balance deac2024b E12, R35, X3

Where it fails or is disputed

In the 2023 paper used on schematic diagrams only; no ternary diagram or tie line was measured there deac2023b X14. The 2024 use assumes onset at the spinodal, immediate local equilibrium and inversion at 0.5 deac2024b E12, C51.

Concepts

lever rule, tie line, ternary phase diagram, phase inversion. Findings. Release mechanism and LoC: F27, F30, F31.

← Concepts and formulas

formula · as used in Dissolution

mass flow rate from receiver concentration slope

Expression

J = \frac{dC_r}{dt}\times V_r with V_r the receiver volume; printed in words [raina2014a E11; mosqueragiraldo2018b E2].

Variables and units

symbolmeaningunits
dC_r/dtslope of the linear region of receiver concentrationµg/mL per min
V_rreceiver volume30 mL [raina2014a P9]; 32 mL [mosqueragiraldo2018b E2]
Jmass flowµg/min

Assumptions and valid domain

Sink receiver, linear region, time window chosen after the donor maximum (and before crystallization for PVPVA) [mosqueragiraldo2018b P4].

Use in the library

paperused forvalues or fitted parametersstatus / recomputed
raina2014afelodipine and nifedipine flux2 µg/mL: about 0.0004 µg/mL/min × 30 mL ≈ 0.012 µg/minreproduces from plot reading [raina2014a E11]
mosqueragiraldo2018btelaprevir mass flowwindows 10–60 to 800–1000 minslopes not printed [mosqueragiraldo2018b E2, X18]
hate2022PAMPA mass flow of five drugsslope of receiver concentration against time up to 90 min, normalized by volume, in µg/mininputs not printed [hate2022 E2]

Where it fails or is disputed

One paper cites it as "Eq. (8)", which is the free energy of mixing [raina2014a X2]. Time windows differ between systems [mosqueragiraldo2018b X18].

Concepts

membrane flux. Findings. F2, F7, F9, F21, F22.

← Concepts and formulas

formula · as used in Dissolution

membrane flux from concentration difference

Expression

J = \frac{D_{eff}}{l}\left(C_d - C_r\right) [indulkar2016 E1]; with the receiver washed continuously, J = (D_{eff}/l)\,C_d [indulkar2016 E4]. A form with the membrane partition coefficient is printed for the PAMPA cell: C_{m1} - C_{m2} = \dfrac{J\,K\,d_m}{D}, with C_{m2} \ll C_{m1} under a receiver sink [hate2022 E7].

For the dialysis membrane of the ASD dissolution papers it is printed with a sorption coefficient,

J_i = \frac{D_i K_i}{l}\,(c_{io} - c_{il}) alonzo2011 E1.

Variables and units

symbolmeaningunits
D_{eff}effective diffusion coefficient in the membranenot printed
ldiffusion path lengthnot printed
C_d, C_rdonor and receiver concentrationµg/mL
J_iflux of component i across the dialysis membraneas measured
D_i, K_idiffusion coefficient; sorption coefficient between liquid and membranenot given
c_{io} - c_{il}concentration difference across the membraneµg/mL

Assumptions and valid domain

Pseudo-steady state in the membrane [indulkar2016 C9]; receiver concentration neglected when washed [indulkar2016 C10]. For the dialysis set-up of the ASD dissolution papers the flux is taken as directly proportional to the concentration difference, so that a difference in dissolved drug between donors shows as a difference in receptor slope alonzo2011 C9; particles do not cross.

Use in the library

paperused forvalues or fitted parametersstatus / recomputed
indulkar2016flow-through model of clotrimazoleK = A D_eff/(V_d l) fittedinputs not printed [indulkar2016 E1, E4, E6]
hate2022donor-side interface concentration in a PAMPA cellK, membrane thickness and D not giveninputs not printed [hate2022 E7, R19]
alonzo2011dissolved felodipine from dispersionsslope ratios 10.5, 9.5, 8.5 (90:10, 50:50, pure amorphous)proportionality check 0.0816/0.0394 = 2.07 against 2.0 alonzo2011 R14, E1

Where it fails or is disputed

Droplets are assumed not to contribute to the flux [indulkar2016 C11, X4]. All ratios share one crystalline slope (n = 1), and the membrane cutoff is given as 6–8 kDa and as 10 kDa alonzo2011 X4, X1.

Concepts

membrane flux, sink conditions, free drug concentration. Findings. Bioperformance: F5. Supersaturation from ASD dissolution: F7, F8.

← Concepts and formulas

formula · as used in Dissolution

membrane flux from permeability and concentration

Expression

J = P\,C elkhabaz2019b E5, printed as J = pc in the enzalutamide study [wilson2018 E6]. In the supplement of the media study the apparent permeability is the normalized flux divided by the donor concentration, in cm/min elkhabaz2019b E5.

Variables and units

symbolmeaningunits
Jflux across the membraneµg/(min·cm²) elkhabaz2019b R7
Pmembrane permeabilitycm/min elkhabaz2019b E5
Cconcentration available for permeationµg/mL, taken as µg/cm³ [elkhabaz2019b E5; wilson2018 E6]

Assumptions and valid domain

None stated in either paper; the concentration is meant to be the one available for permeation, that is the free drug [wilson2018 E6].

Use in the library

paperused forvalues or fitted parametersstatus / recomputed
wilson2018relation of flux to concentration for enzalutamidenot used numericallyprinted; no numerical output [wilson2018 E6]
elkhabaz2019bapparent permeability of atazanavir and posaconazole in six mediaatazanavir in buffer-V1 at J_{amph}: 1.19 × 10⁻¹/79 = 1.51 × 10⁻³ cm/minreproduces Table S2 elkhabaz2019b E5, R12

Where it fails or is disputed

With total concentration as C the apparent permeability fell in the micellar media, because only free drug crosses; multiplied by the ratio of total to buffer solubility it was the same at both solid phases in every medium (1.33–1.77 × 10⁻³ cm/min for atazanavir, 2.36–3.03 × 10⁻³ for posaconazole) (F18) elkhabaz2019b R12, R13.

Concepts

membrane flux, Fick's first law, free drug concentration, micellar solubilization. Findings. F18, F25.

← Concepts and formulas

formula · as used in Dissolution

membrane flux in terms of solute activity

Expression

J = \frac{dM}{dt} = \frac{D\,S\,a}{h\,\gamma_m} mosqueragiraldo2015 E4.

The papers of 2017–2022 print the relation per unit area,

J = \frac{D\,a}{h\,\gamma_{m}} indulkar2017a E7,

with the flux defined as

J = \frac{dm}{A\,dt} indulkar2017a E4, and as the mass flow rate

F = \frac{dM}{dt} = \frac{D\,S\,a}{h\,\gamma_m} lu2017b E1.

In the Bioperformance papers the relation is printed with the area outside the numerator,

J = \frac{dM}{dt\,S} = \frac{D\,a}{h\,\gamma_m} [alhalaweh2016 E1],

as J = dM/dt = D S a/(h \gamma_m) with the area S inside the numerator [raina2014a E6; raina2015c E3], and as J = (1/A)(dM/dt) = D a/(h \gamma_m) [hate2017 E1].

The crystallization-from-solution papers print it per area,

J = \frac{dM}{S\,dt} = \frac{D\,a}{h\,\gamma_m} jackson2016 E1;

J = \frac{dM}{A\,dt} = \frac{D\,a}{h\,\gamma_m} li2016a E2,

with the activity written as

a = C\,\gamma jackson2016 E2.

In the Mesoporous silica papers it is printed as

J = \frac{dM}{A\,dt} = \frac{D\,a}{h\,y_{m}} [dening2018 E1],

with the membrane activity coefficient written y_m and the activity a = C\,y [dening2018 E2].

In the ASD dissolution papers it is printed per membrane area,

J = \frac{dM}{dt}\cdot\frac{1}{S} = \frac{D\,a}{h\,\gamma_m} jackson2015 E1,

and with the supersaturation as the activity,

J = S_i\,\frac{D}{h\,\gamma_m} jackson2015 E3;

the tacrolimus paper prints \frac{dM}{dt} \propto a in words: the rate of transport into sink conditions is proportional to the thermodynamic activity of the solute in the donor, not to its concentration trasi2016 E2.

Variables and units

symbolmeaningunits
Jflux across the membraneµg/min in the telaprevir figure mosqueragiraldo2015 E4, R12
M, tmass transported, timemosqueragiraldo2015 E4
D, S, hdiffusion coefficient, membrane area, membrane thicknessmosqueragiraldo2015 E4
asolute activity in the donormosqueragiraldo2015 E5
\gamma_m (printed as italic y_m in the Mesoporous silica paper)activity coefficient of the drug in the membrane[mosqueragiraldo2015 E4; dening2018 E1]
J in the Bioperformance papersflux (or mass flow rate when S is inside)µg/min; µg/(h·cm²); mg/min/cm² [raina2014a E6; indulkar2016 E11; alhalaweh2016 R17]
S or Amembrane area7.065 cm² [raina2014a P8]; 1.77 cm² [indulkar2016 P5]; 115 cm² [hate2017 M10]; 7.07 cm² [dening2018 P12]
J in the crystallization-from-solution papersmass crossing the membrane per time and areaµg min⁻¹ cm⁻² (the printed danazol axis lacks the time) jackson2016 E1
S or A in the danazol cellmembrane area (orifice)7.065 cm²
D, hdiffusion coefficient of the solute in the membrane; membrane thicknesscm² s⁻¹; cm
C, \gammaconcentration and activity coefficient in solutionµg mL⁻¹, dimensionless jackson2016 E2
J in the ASD dissolution papersfluxµg/(min·mm²) jackson2015 E1
S in the danazol cell of 2015membrane cross-sectional area (not the supersaturation)mm² jackson2015 E1
S_isupersaturation, free drug over crystalline solubilitydimensionless jackson2015 E3
dM/dtmass flow rate into the receiverµg/min trasi2016 E2

Assumptions and valid domain

D, S, h and γm are constant across experiments, so differences in flux reflect differences in activity; sink conditions (receiver below half the crystalline solubility) mosqueragiraldo2015 C10, R11. In the Bioperformance papers: sink receiver, nearly constant donor concentration, and constant D, S, h and γm [raina2014a C11; alhalaweh2016 C2]. It was tested in a side-by-side cell with a regenerated cellulose membrane, a flow-through cell, a hollow-fibre module and Caco-2 monolayers. Sink conditions in the receiver, constant donor concentration, and S (or A), D, γ_m and h constant for a given set-up and solute, so that mass flow is proportional to the donor activity jackson2016 C9; li2016a E2. Tested for danazol (receiver below 0.3 µg/mL) and for celecoxib and nevirapine jackson2016 P9; li2016a P8. In the Mesoporous silica papers D, A, y_m and h are constant in all diffusion experiments, so mass flow follows donor activity; receiver concentrations stayed below the crystalline solubility [dening2018 C11, C12]. There it is used to read free drug released from drug-loaded silica, where dissolution sampling cannot tell free from held drug [dening2018 C22]. In the danazol dispersion study D, S, \gamma_m and h are constant in the cell, so flux is proportional to free drug, not total drug jackson2015 C11; in the tacrolimus study the receiver is under sink conditions and the relation is cited trasi2016 E2.

Use in the library

paperused forvalues or fitted parametersstatus / recomputed
mosqueragiraldo2015telaprevir flux against donor concentrationabout 0.068 µg/min at 5 µg/mL, about 0.97 at 90, about 1.07 at 130inputs not printed (D, h, γm) mosqueragiraldo2015 E4, R12
trasi2015aflux of ritonavir, lopinavir, paclitaxel as a measure of activityplateaus 0.13–0.27 µg/minread-out, relation not printed trasi2015a R2, C14
indulkar2017aatazanavir flux in buffer, calibration of free drug in SDSslope 0.0017 mL/min·cm² (R² 0.998) up to the amorphous solubilityinputs not printed (D, h, γm) indulkar2017a E7, R10
lu2017btelaprevir mass flow rate against concentration0.009 µg/min per µg/mL (R² 0.9932)inputs not printed (D, h, γm; S not stated as a value) lu2017b E1, R6
raina2014afelodipine and nifedipine flux plateauD, h, γm not printedprinted; inputs not printed [raina2014a E6]
raina2015csolubilizer effect on fluxsameprinted [raina2015c E3]
alhalaweh2016Caco-2 flux of drug mixturesA, D, γm assumed constantprinted [alhalaweh2016 E1]
hate2017hollow-fibre transfernot applied numericallyprinted [hate2017 E1]
jackson2015danazol ASD flux; free danazol from dissolving dispersions17.5 × 10⁻⁵ µg/(min·mm²) printed; free drug 7.1–9.1 µg/mL with LLPS, 5.4 µg/mL withoutmismatch: recomputed 1.28 × 10⁻³ jackson2015 E1; flux and concentration columns not proportional jackson2015 R9, X5
trasi2016tacrolimus mass flow; solutions and dissolved marketed products, pH 4.5, 37 °Cstated in words; plateau ≈0.0050–0.0055 µg/min from 60–100 µg/mL, products 0.0048–0.0054 µg/minno constants printed trasi2016 E2, R14, R15
wilson2018enzalutamide, ASD solutions and drug with polymerD, h and γm constant; donor activity inferred from mass flowno numerical output [wilson2018 E4, E5, C12]
elkhabaz2019batazanavir, posaconazole in six mediaconstants not printedinputs not printed elkhabaz2019b E3
ueda2020aatazanavir, clozapine with two HPMCAS gradesflux proportional to the extent of supersaturation, in wordsnot applicable [ueda2020a E2]
alkalla2026atazanavir and darunavir in diffusion cells and Caco-2A, D, γm and h assumed constantinputs not printed [alkalla2026 E2]
jackson2016maximum free-drug concentration of danazol from the flux plateau at 8 µg/mL; maximum flux with 1–1000 µg/mL polymerflux about 0.0152–0.0159 (plateau); 0.0126–0.0175 with polymer (units as printed)plot readings jackson2016 R10, R11, X9
li2016acheck that 0.1% STC and SGC leave the activity of celecoxib and nevirapine unchanged0.44, 0.46, 0.41 and 20.9, 23.4, 21.0 µg/minmeasured li2016a R15
lu2017activity ratio δ = F/F° from the mass flow of telaprevir (calibration from an earlier study)δ 11.5 and 28.8 (concentrations 60–330 µg/mL)plot readings lu2017 E2, R1
indulkar2018flux as a measure of donor activity in micellar mediaJ = Da/(h\gamma_m)inputs not printed indulkar2018 E2
indulkar2019bsame, in SDSas aboveinputs not printed indulkar2019b E2
dening2018free ritonavir from SBA-15 at 50–1000% of the amorphous solubility3.80–9.12 ng/min against 9.20 for amorphous ritonavir; free drug about 19 and 23 µg/mL at 200 and 400%inputs not printed; printed "ng/min" equal receiver slopes in ng/mL per min [dening2018 E1, R8, R9, R10, X3]
dening2018ritonavir loadings 4.9–38.1% w/w; lopinavir5.1–5.4 against 4.37 and 4.10 ng/min; lopinavir 51.4 and 70.9%inputs not printed [dening2018 R27, R20]

Where it fails or is disputed

The plateau still rises by about 10% mosqueragiraldo2015 X6; replicates and the slope window are not stated mosqueragiraldo2015 X13; trasi2015a X10. The relation needs a membrane that passes only dissolved drug; the telaprevir paper explains the same flux drop with bile-salt micelles both by lower activity and by slower diffusion of drug-loaded aggregates, and does not separate them lu2017b X8; indulkar2017a X9. Flux of nifedipine at about 10 µg/mL, near its crystalline solubility, was about zero, which proportionality to activity does not predict [raina2014a X11]. In the hollow-fibre module transfer keeps rising above the amorphous solubility, where activity should be constant [hate2018 C25]. One paper uses γ for both the membrane and the donor coefficient [raina2015c X8]. With a sink receiver the PAMPA mass flow of atazanavir kept rising above the amorphous solubility, where activity should be constant (F22) [hate2022 R19]. A crystalline co-drug lowered the flux plateau by lowering the activity of the drug-rich phase (F20) [alkalla2026 C37], and flux and total concentration decouple in micellar media (F18) elkhabaz2019b C25. The flux axes of the danazol paper have no time unit and no replicates are stated; the crystalline reference flux differs between figures (0.0011 and 0.0008) and the plateau-to-crystal flux ratio (about 14 to 19) exceeds the concentration ratio (about 9), which is not discussed jackson2016 X9, X10, X11. For celecoxib the ratio of concentration to solubility disagrees with the unchanged flux li2016a X18. The formula is also printed by 14 papers outside the crystallization-from-solution chapter (see the evidence table). With ritonavir on SBA-15 at the 1000% dose the flux equalled that of amorphous ritonavir while filtered dissolution gave about 85% of the amorphous solubility, unresolved [dening2018 X14]. The membrane of that paper is regenerated cellulose in the methods and "cellulose acetate" in one section [dening2018 X2]. The percent of reference depends on whether the reference is dose-matched [dening2018 X15]. For one danazol system the example profile gives 128 × 10⁻⁵ against a printed 17.5 × 10⁻⁵ µg/(min·mm²), unresolved jackson2015 E1, X4; the standard curve has an intercept jackson2015 X5. Below 50 µg/mL the tacrolimus flux rose with concentration but did not extrapolate to zero trasi2016 X8.

Concepts

membrane flux, thermodynamic activity, chemical potential, Fick's first law, sink conditions, incomplete drug release, free drug concentration. Findings. Amorphous solubility and LLPS: F8, F11, F16, F17. Bioperformance: F2, F3, F18, F19, F20, F22, F25. Crystallization from solution: F22, F31, F32, F38. Mesoporous silica: F8, F11, F15. Supersaturation from ASD dissolution: F7, F8.

← Concepts and formulas

formula · as used in Dissolution

Noyes-Whitney equation

Expression

As printed for crystals dissolving in a polymer melt (concentration C of dissolved drug in the liquid phase):

\frac{dC}{dt}=\frac{DA}{hV}\left(C_s-C\right)

[moseson2018 E5], and with a Nernst–Brunner diffusion layer in the same form [moseson2019 E2].

The ASD dissolution papers print a proportional form for aqueous dissolution,

\frac{dc}{dt} \propto A\,(C - C_{\mathrm{eq}}) alonzo2010 E3,

and name the equation for indomethacin precipitates without an expression xie2017 E1.

New printed forms (Release mechanism and LoC):

\frac{dm}{dt} = A\,\frac{D}{h}\left(C_s - C_b\right) indulkar2017b E4

\frac{dx}{dt} = C\left(S - x\right) purohit2017b E3

\frac{dC}{dt} = k\left(C_s - C\right) indulkar2019a E1

\frac{dC}{dt} = \frac{DA}{Vh}\left(C_s - C\right) indulkar2019a E2

\frac{dM}{dt} = \frac{DA}{h}\left(C_s - C\right) que2019 E1

\frac{dC}{dt} = k\left(C_s - C_t\right) saboo2020a E1

Stated in words as the Nernst–Brunner relation, the dissolution rate proportional to the saturation solubility under sink conditions correasoto2022b E4.

\left(\frac{dC}{dt}\right)_{\mathrm{drug}} = \frac{D A}{V h}\left(C_s - C\right) indulkar2022 E2

Variables and units

symbolmeaningunitids
C, C_sconcentration of dissolved drug; solubility of the crystalline drug in the molten polymer–[moseson2018 E5]
Ddiffusion coefficient–[moseson2018 E5]
Asurface area available for dissolution–[moseson2018 E5]
hboundary-layer thickness at the solid–liquid interface–[moseson2018 E5]
Vvolume of the liquid phase–[moseson2018 E5]
dc/dtdissolution rate in aqueous mediumµg/(mL min)alonzo2010 E3
C, C_{\mathrm{eq}}solution concentration; equilibrium concentration (aqueous form)µg/mLalonzo2010 E3
dm/dt, dM/dtmass of drug dissolved per unit time (release-mechanism forms)–indulkar2017b E4; que2019 E1
Asurface area exposed to the medium–indulkar2017b E4
D, hdrug diffusion coefficient; boundary or diffusion layer thickness–indulkar2019a E2
C_s, Ssolubility of the dissolving solid form (the amorphous solubility for an amorphous surface)µg/mLindulkar2019a E1, E2; purohit2017b E3
C_b, C, C_t, xdrug concentration in the bulk medium at time tµg/mLindulkar2017b E4; saboo2020a E1; purohit2017b E3
Vvolume of the dissolution mediummLindulkar2019a E2
k, C (purohit2017b)rate constant–indulkar2019a E1; purohit2017b E3

Assumptions and valid domain

Applied to crystal dissolution in the polymer melt, with viscosity not constant but falling as drug dissolves; no numerical output is stated in either paper [moseson2018 E5; moseson2019 E2]. Named the "modified Noyes and Whitney equation" (cited) and used as one arm of the scheme in which dissolution competes with crystallization of the solid and of the solution alonzo2010 E3, C43. Used to argue that EPO, by raising the crystalline solubility of indomethacin, "may" raise its dissolution rate xie2017 C47. Describes drug-controlled dissolution indulkar2017b E4; dissolution governed by the amorphous drug at high loading purohit2017b E3; C_s is the solubility of the solid form at the dissolving surface, and the rate approaches zero as C approaches it indulkar2019a E1, E2; D, A and h fixed, not applicable to dispersions whose release exceeds the amorphous solubility que2019 E1.

Use in the library

paperused forvalues or fitted parametersstatus / recomputed
moseson2018argument that temperature, plasticisation and shear speed up dissolutionnoneinputs not printed [moseson2018 C52]
moseson2019the diffusion-only model that fragmentation extendsnoneinputs not printed [moseson2019 C39, C40]
moseson2020why a physical mixture with large crystals lags a dispersion in thermogravimetry (crystal size sets dissolution in the molten polymer)nonenamed only [moseson2020 E1, C33]
moseson2022cframework for dissolution of bicalutamide crystals in PVPVA; the population balance model uses it through a size-dependent shrinkage rate with a fitted rate constantkd 0.1002 ± 0.0511 µm/s against assumed 0.5 and 4 µm/sinputs not printed (D, h and V not given) [moseson2022c E18, E9, R16]
alonzo2010scheme of Fig. 16nonenot applicable alonzo2010 E3
xie2017redissolution of indomethacin precipitates at pH 5α solubility 15 µg/mL, 27 µg/mL with 100 µg/mL EPOnamed only xie2017 E1, R2, C47
indulkar2017brelease into medium saturated at the amorphous solubilitynonenot applicable indulkar2017b E4, C35
purohit2017bwhy drug-controlled release cannot pass the amorphous solubilitynoneinputs not printed purohit2017b E3, C50
indulkar2019arelease from a drug-rich surface into saturated mediumnoneinputs not printed indulkar2019a E1, E2, C42
que2019the amorphous solubility as the ceiling of free drugnoneinputs not printed que2019 E1, C2
saboo2020arate advantage of an amorphous form similar to its solubility advantagenonenot applicable saboo2020a E1, C1
correasoto2022bintroduction: why the amorphous form dissolves fasternonenot applicable correasoto2022b E4
indulkar2022drug-controlled release of high-loading ritonavir–PVPVA (cited 50% result)noneinputs not printed indulkar2022 E2, R3
bapat2023named only, as the form that fails in the polymer-controlled regimenonenamed only bapat2023 E4, C2

Where it fails or is disputed

It neglects crystal defects, particle breakage and a changing particle number, which is the gap the 2019 paper addresses [moseson2019 C2, C55]. The 2022 paper replaces the diffusion-only picture by a model in which breakage is needed to finish within 20 min, and calls the equation a framework with unlikely sink conditions in HME [moseson2022c E18, R12]. As printed, A(C - C_{\mathrm{eq}}) is negative while a solid dissolves below C_{\mathrm{eq}}; read it as a direction only alonzo2010 X3. The solubility effect "alone cannot explain" the faster redissolution of the precipitate; crystal size, not tested with size-matched crystals, is the authors' main explanation xie2017 C47, C48. It does not describe polymer-controlled release, which continues into medium already at the amorphous solubility indulkar2017b C35; indulkar2019a C43. The 2017 ritonavir paper prints the label "(2)" for this equation, the same as for its Flory–Huggins equation, and calls it eq. 3 in the text purohit2017b X2.

Concepts

Noyes–Whitney equation, diffusion boundary layer, crystal dissolution into a polymer melt, crystallization during dissolution, Nernst-Brunner equation, drug-controlled release, amorphous solubility. Findings. ASD process: F9, F11, F12, F31, F36, F37. Supersaturation from ASD dissolution: F1, F10, F21. Release mechanism and LoC: F1, F2, F3, F4.

← Concepts and formulas

formula · as used in Dissolution

pH-solubility profile

Expression

C_T = C_B\left(1 + 10^{\,\mathrm{p}K_a - \mathrm{pH}}\right) indulkar2015 E8.

The paper of 2018 prints the same relation as

C_T = \left(\frac{1 + X}{X}\right)C_U,\qquad X = 10^{\mathrm{pH} - \mathrm{p}K_a} sugihara2018 E1,

which equals C_B\,(1 + 10^{\mathrm{p}K_a-\mathrm{pH}}) (synthesis: (1+X)/X = 1 + 1/X).

Two delamanid papers use the relation without printing it, one to fit the drug's pKa from measured solubilities and one to draw the predicted curve of a cited pKa nguyen2023c E1; nguyen2023b E1. The posaconazole paper prints it in the same form,

C_T = C_B\left(1 + 10^{\,\mathrm{p}K_a - \mathrm{pH}}\right) duong2022b E1,

as cited by the delamanid work nguyen2023c E1.

Variables and units

symbolmeaningunits
C_Ttotal solubility at the pHµg/mL indulkar2015 E8
C_Bcrystalline free-base solubility (the amorphous free-base solubility is substituted for the amorphous form)µg/mL indulkar2015 E8, C46
\mathrm{p}K_a, \mathrm{pH}pKa of the base, medium pHindulkar2015 E8
C_T (delamanid papers)total solubility of the drug at that pH, crystalline or amorphousµg/mL nguyen2023c R1
\mathrm{p}K_a (delamanid)pKa of the base: fitted 3.94 ± 0.04, 4.3 citednguyen2023c R3; nguyen2023b E1

Assumptions and valid domain

The solution is in equilibrium with the neutral form, not the salt indulkar2015 E8. Tested for clotrimazole, atazanavir and nicardipine at 37 °C over about ±2 pH units of the pKa indulkar2015 A2. In the delamanid papers it is applied to a monoprotic weak base in equilibrium with the neutral form, over pH 1.6 to 6.5 at 37 °C, to the crystalline and to the amorphous solubility alike nguyen2023c P1, P2, E1. For the coated-tablet paper the intrinsic solubility behind the printed curve is not given, so the curve is a reference line rather than a fit nguyen2023b E1.

Use in the library

paperused forvalues or fitted parametersstatus / recomputed
indulkar2015predicted crystalline and amorphous solubility at each pH; oral-dose scenariosatazanavir at pH 1.5: 1090 µg/mLreproduces (1.04 µg/mL, pKa 4.52; printed 1.1 mg/mL) indulkar2015 E8, R26
sugihara2018pazopanib crystalline and amorphous solubility against pHpKa 6.4; amorphous points fall below the curve at pH 5 and 5.5reproduces for the crystalline curve sugihara2018 E1, R3, C11
nguyen2023cfitting the delamanid pKa to crystalline and amorphous solubility between pH 1.6 and 6.5pKa 3.94 ± 0.04; crystalline 10.2 → 0.018 and amorphous 154.5 → 0.76 µg/mLthe fitted curve follows the amorphous data but gives about 3.7 instead of 10.2 µg/mL for the crystal at pH 1.6 nguyen2023c R3, R1
nguyen2023bdrawing the predicted buffer solubility of delamanid against the measured buffer and biorelevant valuespKa 4.3 cited; about 10.3 µg/mL at pH 1.6, below 0.02 µg/mL above pH 5.5inputs not printed; the biorelevant values lie far above the curve nguyen2023b E1, R13, R18

Where it fails or is disputed

The predicted amorphous curve is the crystalline curve times one factor, so its overlap with the LLPS data does not test the relation; the constancy of the un-ionized concentration does indulkar2015 X14. At the lowest pH a salt may limit solubility, not examined indulkar2015 X7. It covers the drug only: in the dispersions of the ASD dissolution papers the polymer's own pH-dependent solubility decides release, and the worst gastric pH for delamanid dispersions lay where neither drug nor polymer dissolved well nguyen2023c C14, C15. It does not apply to a neutral drug: praziquantel, with a calculated pKa of 1.14, kept an amorphous solubility of 1.17–1.43 mg/mL across six buffers and still lost release after gastric stages at pH 3.0 and 5.0 alvarenga2025 R4, R1, R10. Food components raised delamanid solubility far above the curve (13.10 and 57.97 µg/mL in a fed gastric medium) nguyen2023b R13.

Concepts

pH-dependent solubility, ionization, pKa, pH-dependent solubility of weak bases, enteric polymer. Findings. Amorphous solubility and LLPS: F10, F23. Supersaturation from ASD dissolution: F24, F25, F28.

← Concepts and formulas

formula · as used in Dissolution

power-law crystal growth rate

Expression

R_G = k_G\,A\,(C_b - C^{*})^{g} purohit2018 E3. The log-linearised fit \log(dC/dt) = n\log(S-1) + \text{intercept} is printed for tacrolimus seeds, with n = 1.677 hate2019 E5.

In supersaturation-ratio form, with its linearisation, and against the logarithmic supersaturation:

R_G = k_G\,S^{g} alonzo2012 E2;

\ln R_G = \ln k_G + g\,\ln S alonzo2012 E3;

R_G = k_g\,\sigma^{g} ilevbare2012b E3.

Variables and units

symbolmeaningunits
R_Gcrystal growth rate–
k_Ggrowth rate coefficientnot determined
Acrystal surface areanot determined
C_b, C^*bulk concentration, crystal solubilityµg/mL
goverall growth order, typically 1 to 2–
R_G (supersaturation form)overall crystal growth rateµg mL⁻¹ min⁻¹ alonzo2012 E2
k_ggrowth rate constant against σas R_G ilevbare2012b E3
S, \sigmasupersaturation ratio and its logarithmdimensionless

Assumptions and valid domain

Empirical purohit2018 E3; g = 1 for diffusion control and 2 for integration control in the felodipine–HPMC study alonzo2012 E2, E3. k_G depends on temperature, crystal–solution velocity and impurities but not on supersaturation alonzo2012 C3, C35. Fitted over S 3–12 for felodipine; not fitted for ritonavir alonzo2012 P8; ilevbare2012b E3.

Use in the library

paperused forvalues or fitted parametersstatus / recomputed
purohit2018why 450 mL shows growth and 900 mL notnone fittedinputs not printed purohit2018 E3, C52, C55
alonzo2012growth order of felodipine without and with HPMCg 1.50 ± 0.04; 1.97 ± 0.12; \ln k_G −4.24; −5.42 to −5.86; with HPMC kG about 0.0032, g 2, S 5: RG about 0.080reproduces (1 µg/mL HPMC, S 5: 0.080 against 0.087 µg mL⁻¹ min⁻¹ in Fig. 3) alonzo2012 E2, E3
hate2019tacrolimus on seedsdC/dt = k_g A (C_{in}(0) - C^*)^n with constant area; fit y = 1.677x - 3.136, R² 0.9896E4 reproduces (1.17 × 10⁻⁴ × (25 − 2.5)^1.7 = 0.0233 µg/mL/s); E5 mismatch: printed growth constant 1.17 × 10⁻⁴ "cm/s", 10^(−3.136) = 7.31 × 10⁻⁴ or 1.57 × 10⁻⁴ after dividing by C*^n hate2019 E4, E5, R18, X3
ilevbare2012bgrowth against σ; linear above σ_cno k_g or g reportednot applicable ilevbare2012b E3
schram2015R_G = k_G S^g, held at fixed disc speedS 8; no k_G or g reportednot fitted schram2015 E2, X7
schram2016R_G = A k_G S^g, area factor in the argument against area as the causeS 4; no k_G or g reportednot fitted schram2016 E2

Where it fails or is disputed

No growth constants were determined for tacrolimus in the dissolution study purohit2018 E3; the absorptive study fitted an order and a constant from seeded runs. The x-axis of the tacrolimus fit is log(C − C*) rather than the log(S − 1) it is labelled with, and the crossover with absorption near S 18.5 rests on a constant crystal area (F29) hate2019 X2, X16. The k_G values come from fits with different fixed orders (1.5 without HPMC, 2 with), so they should be compared at equal S alonzo2012 X8. Above the critical supersaturation the ritonavir rate is linear in σ, not a power law with order 2 ilevbare2012b R11, R12. The rotating-disc papers of 2015 and 2016 report neither order nor coefficient schram2015 X7; schram2016 E2.

Concepts

crystal growth, crystal seeding, crystal growth rate, integration-controlled crystal growth, kinetic roughening. Findings. Bioperformance: F12, F16, F29. Crystallization from solution: F9, F10, F23, F24.

← Concepts and formulas

formula · as used in Dissolution

reduced glass transition temperature

Expression

T_{rg} = \frac{T_g}{T_{melt}} [baird2010 E4].

Variables and units

symbolmeaningunits
T_{rg}reduced glass transition temperaturedimensionless [baird2010 E4]
T_g, T_{melt}glass transition and melting temperaturesK [baird2010 E4]

Assumptions and valid domain

Viscosity is taken as constant at Tg [baird2010 E4]; a value of 0.66 was proposed in the cited literature [baird2010 R29]. For 16 class I molecules without a measured Tg, Tg was estimated from a fit T_{rg} = 0.00021\,\mathrm{MW} + 0.64433 with R² 0.44 [baird2010 E27, X17].

Use in the library

paperused forvalues or fitted parametersstatus / recomputed
baird2010testing Trg against classI-A 0.69, I-B 0.7; class I 0.69 ± 0.02, class III 0.73 ± 0.04, not significantly differentreproduces: acetaminophen 297.15/443.15 = 0.671 [baird2010 E4, R14]
nguyen2023apretomanid0.67reproduces: (10 + 273.15)/(147.3 + 273.15) = 0.673 [nguyen2023a E2]

Where it fails or is disputed

Trg did not differ between class I-A and I-B, indicating no correlation with the ability to quench amorphous [baird2010 C23]. Tg/Tm was not a reliable indicator; class II alone spans Tg/Tm 0.65–0.76 [baird2012 C36, R14]. The class I values rest partly on estimated Tg [baird2010 X17].

Concepts

reduced glass transition temperature, glass transition temperature, glass-forming ability, Tm − Tg temperature gap. Findings. F12.

← Concepts and formulas

formula · as used in Dissolution

relative nucleation rate from seeded and unseeded induction times

Expression

\frac{R}{R_0} = \frac{t_{s,0}}{t_s} alonzo2012 E9

\frac{J}{J_0} = \left(\frac{t_s}{t_{s,0}}\right)^{3}\left(\frac{t_{u,0}}{t_u}\right)^{4} alonzo2012 E10

\frac{J}{J_0} = \left(\frac{R_0}{R}\right)^{3}\left(\frac{t_{u,0}}{t_u}\right)^{4}, \qquad E_J = \frac{J_0}{J} lu2017 E4; lu2017a E4, E5

With the polymer case in the denominator:

\frac{J_0}{J_p} = \left(\frac{R_p}{R_0}\right)^{3}\left(\frac{t_{u,p}}{t_{u,0}}\right)^{4} xie2016a E6

Variables and units

symbolmeaningunit
J, J_0nucleation rate with and without inhibitorm⁻³ s⁻¹
t_s, t_s,0seeded induction times with and without inhibitormin
t_u, t_u,0unseeded induction times with and without inhibitormin
R/R_0seeded growth-rate ratio, used for t_{s,0}/t_sdimensionless
J_0, J_pnucleation rate without and with polymerm⁻³ s⁻¹
R_0, R_pmass growth rate without and with polymer, from seeded desupersaturation slopesµg/(mL min)
t_{u,0}, t_{u,p}unseeded induction times without and with polymermin

Assumptions and valid domain

Seeded and unseeded runs under identical conditions; the seeded induction-time ratio is replaced by the growth-rate ratio of the de-supersaturation curves (Verdoes 1992, outside the library) alonzo2012 C11, E9. Used for one drug, one polymer level and one supersaturation. For celecoxib R_0 is the slope of the linear region over the first 5 min without polymer; R_p is, for simplicity, the slope over the whole 16 h with HPMCAS xie2016a C38. t_{u,p} = 960 min because no sharp slope change was seen, which underestimates the induction time xie2016a C39.

Use in the library

paperused forvalues or fitted parametersstatus / recomputed
alonzo2012felodipine, 1 µg/mL HPMC, S 10t_{u,0} 15.3 min, t_u 136.5 min, R/R_0 0.607; J/J_0 = 7.05 × 10⁻⁴reproduces: 7.06 × 10⁻⁴ with 1.647; 7.00 × 10⁻⁴ with the printed 1.643 alonzo2012 E10, X6
xie2016acelecoxib with HPMCAS (ASD dissolution chapter): 22 µg/mL with 5 µg/mL HPMCAS, pH 6.8, 37 °Ct_{u,p} 960 min, R_0/R_p = 70; J_0/J_p about 4,000derived xie2016a R13; reproduces with t_{u,0} = 5 min from the text: (1/70)^{3}(960/5)^{4} = 3962; the t_{u,0} used by the authors is not printed xie2016a E6, R13
lu2017telaprevir, 1.86 mM STC and SGC, δ 11.5; t_u,0 about 30 min, t_u 960 minJ/J_0 2.5 × 10⁻³ and 2.9 × 10⁻⁶recomputed 2.58 × 10⁻³ and 3.06 × 10⁻⁶ lu2017 E4, R10, X1
lu2017asame with bile salts at 1.86 and 12 mM; rate ratio set to 100 for STCDC and SGCDCE_J about 360 to 3 × 10⁵; about 1 for STCDCreproduced for the 1.86 mM values lu2017a E4, E5, R14

Where it fails or is disputed

Rests on one pair of induction times with no stated uncertainty entering to the fourth power; a 10% change in t_u changes J/J_0 about 1.5-fold alonzo2012 X7. The exponents are not derived in the paper. The induction times enter capped at 960 min, so E_J is a bound; the rate ratios used are the δ 12.5 values while the text speaks of growth; the 12 mM inputs are not printed lu2017 X2; lu2017a X13, X14. For celecoxib the slopes and t_{u,0} are not printed, and R_p was taken over 16 h while the figure covers 4 h, so the ratio cannot be reproduced from the printed data xie2016a X8. With t_{u,p} capped at 960 min the ratio is a lower bound xie2016a C39, C40. t_{u,0} enters to the fourth power (synthesis: with t_{u,0} of 4 or 6 min the ratio is about 9,700 or 1,900).

Concepts

nucleation rate, nucleation inhibition, crystal growth inhibition. Findings. Crystallization from solution: F5, F6, F20, F32, F33. Supersaturation from ASD dissolution: F5.

← Concepts and formulas

formula · as used in Dissolution

sink index

Expression

\mathrm{SI} = \frac{C_s\,V}{\mathrm{Dose}} purohit2018 E1.

Variables and units

symbolmeaningunits
C_ssolubility (crystalline or amorphous)µg/mL
Vmedium volumemL
Dosetotal drug5000 µg purohit2018 R4

Assumptions and valid domain

SI above 1: enough medium to dissolve the dose; sink in the compendial sense is three times the solubility needed purohit2018 E1. Ueda 2024 (Eqs. 15–16, p. 54) write the two forms separately, SI_{cr}=S_c/(Dose/V) and SI_{am}=S_a/(Dose/V): the criterion of 3 applies to SI_{cr}, and SI_{am}=1 marks the dose that just reaches the maximum activity.

Use in the library

paperused forvalues or fitted parametersstatus / recomputed
purohit2018five dissolution conditions1.8 × 900/5000 = 0.324; 14.9 × 900/5000 = 2.68reproduces purohit2018 E1, R4
hate2019tacrolimus 5 mg in 240, 100, 40 mL50 × 240/5000 = 2.4 (printed 2.4); 1 and 0.4reproduces hate2019 E1, R7

Where it fails or is disputed

The amorphous solubility is cited and approximate purohit2018 R4.

Concepts

sink index, sink conditions. Findings. F16, F17, F28, F31.

← Concepts and formulas

formula · as used in Dissolution

solid-liquid equilibrium solubility equation

Expression

\ln x_{C,L_1} = -\frac{\Delta G_{a\to c}}{RT} - \ln\gamma_{L_1} ilevbare2013a E3;

\ln C_B = -\frac{\Delta G}{RT} - \ln\gamma indulkar2015 E7;

and for the supercooled liquid \ln x_{SL,L_1} = -\ln\gamma_{L_1} ilevbare2013a E4. As printed, \Delta G_{a\to c} and \Delta G are positive magnitudes; with the signed quantity \mu^{(c)}-\mu^{0(a)}, which is negative, the term carries a plus sign, as in Taylor and Zhang 2016 (Eqs. 2 and 6).

New forms (Miscibility and drug-polymer interactions). With the heat-capacity terms, as printed for the solubility of a crystalline drug in a polymer (2006):

\ln\gamma_{\mathrm{drug}}\,x_{\mathrm{drug}} = -\frac{\Delta H_{fus}}{RT}\left[1-\frac{T}{T_m}\right] - \frac{1}{RT}\int_{T_m}^{T}\Delta C_P^{\mathrm{config}}\,dT + \frac{1}{R}\int_{T_m}^{T}\frac{\Delta C_P^{\mathrm{config}}}{T}\,dT [marsac2006b E5];

and in the 2009 paper, where the left side is written as the free energy of fusion:

\ln\gamma_{\mathrm{drug}}\,x_{\mathrm{drug}} = \frac{-\Delta G_{fus}}{RT} = -\frac{\Delta H_{fus}(T_m)}{RT}\left[1-\frac{T}{T_m}\right] - \frac{1}{RT}\int_{T_m}^{T}\Delta C_P\,dT + \frac{1}{R}\int_{T_m}^{T}\frac{\Delta C_P}{T}\,dT [marsac2009 E1].

Simpler forms in other papers of the library:

\ln x_{actual} = -\frac{\Delta H_{fus}}{RT}\left(1-\frac{T}{T_M}\right) - \ln\gamma [marsac2008a E3];

\ln\left[\gamma_d\,x_d\right] = -\frac{\Delta G_{fus}}{RT} [baird2011 E5];

\ln x = -\frac{\Delta H_f}{R}\left(\frac{1}{T}-\frac{1}{T_m}\right) - \frac{\Delta C_p}{R}\left(1-\frac{T_m}{T}+\ln\frac{T_m}{T}\right) - \ln\gamma [raina2014a E1].

The ritonavir–atazanavir paper writes \log\chi = \log X_{ideal} - \log\gamma with \log X_{ideal} = -\frac{\Delta H_m}{2.303R}\frac{T_m - T}{T_m T} [alhalaweh2016 E4, E5].

Variables and units

symbolmeaningunits
x_{C,L_1}, C_Bsolubility of the crystalline drug in watermole fraction; µg/mL ilevbare2013a E3; indulkar2015 E7
\Delta Gfree-energy difference between supercooled liquid and crystalindulkar2015 E7
\gamma_{L_1}, \gammaactivity coefficient of the drug in the aqueous solutiondimensionless ilevbare2013a E3
\gamma_{drug}activity coefficient of the drug at the solubility limitdimensionless [marsac2009 E1]
\chi, X_{ideal}mole-fraction solubility and ideal solubility in the ritonavir–atazanavir paper– [alhalaweh2016 E4, E5]
x_{drug}mole-fraction solubilitydimensionless [marsac2009 E1]
\Delta H_{fus}, T_mheat of fusion and melting temperature of the drugkJ/mol, K (Table I and II values) [marsac2006b M1, M2; marsac2009 M1, M2]
\Delta C_P^{config}, \Delta C_Pheat-capacity difference between liquid and crystalvalues cited, not printed [marsac2006b X11; marsac2009 P7]
TtemperatureK; not stated for the Table II predictions [marsac2006b X11]

Assumptions and valid domain

The solvent is not present in the crystal; the first term is the lattice contribution and the second the solute–solvent interaction indulkar2015 E7; γ is constant over the crystalline and amorphous concentration range ilevbare2013a C55. For a drug in a polymer, the polymer assumes the role of a solvent, so the equation describes solubility of a crystalline drug in a polymer, with \gamma from Flory–Huggins theory [marsac2006b C45]. For the analogue liquid the entropy of mixing is assumed ideal [marsac2006b C46]. For ketoconazole the heat-capacity difference was approximated by its value at Tg, integrated between Tg and Tm [marsac2009 P7]. In the 2009 route the same γ is assumed at the solubility limits in the analogue and in PVP [marsac2009 C11]. The amorphous form removes the fusion terms, so \ln x = -\ln\gamma [raina2014a E2]. The ritonavir–atazanavir paper sets ΔCp to zero [alhalaweh2016 E5].

Use in the library

paperused forvalues or fitted parametersstatus / recomputed
ilevbare2013aappendix derivation of the amorphous solubilitynoneγ not printed ilevbare2013a E3, E4
indulkar2015argument that the un-ionized amorphous and crystalline solubility differ by a constant factornoneγ not printed indulkar2015 E7, C42
marsac2006bsolubility of nifedipine and felodipine in PVP K12, PVP K29/32 and methyl pyrrolidone0.06–0.07 g/g and 0.25–0.31 g/g in PVP; 0.15 and 0.48 g/g in methyl pyrrolidonereproduces with ΔC_P terms set to zero at 298.15 K for nifedipine in PVP K12 (0.071 against 0.07); one felodipine value in K29/32 does not match (≈0.29 against 0.25) [marsac2006b E5, E6, R17, X11]
marsac2009γ in EP from the measured solubility; ideal solubilityγ 0.15–0.89inputs not printed (heat capacities, ideal solubilities) [marsac2009 E1, R9, X4]
baird2011activity coefficient in PEG 400see the PEG chapterreproduces (through its E7) [baird2011 E5]
marsac2008aactivity coefficient of nifedipine and felodipine in water from the solubility in methyl pyrrolidoneγ in water 1.89 × 10³ and 2.43 × 10⁵reproduces within the stated SD with the lattice terms implied by the printed data (−5.40 and −3.51); ΔH_fus and T_M not printed [marsac2008a E3, R10, R11]
raina2014abackground to the amorphous solubility predictionnoneinputs not printed (ΔC_p and γ not printed) [raina2014a E1, R7]
alhalaweh2016crystal and solvation contributions to the solubility of ritonavir and atazanavir at 310 Klog γ about 4.45 and 3.88 (read)mismatch: recomputed 4.65 and 3.01 from the card's ideal solubility and the Table 2 crystalline solubility [alhalaweh2016 E4, R7]
alhalaweh2016ideal-solubility term of ritonavir and atazanavirplotted log X_ideal −1.07, −1.97; recomputed −2.59, −4.53mismatch [alhalaweh2016 E5, X1, X2]
marsac2008anifedipine and felodipine in methyl pyrrolidone and water (second reading)γ in water 1.73 × 10³ and 2.31 × 10⁵reproduces within SD [marsac2008a E3]

Where it fails or is disputed

The appendix prints its first equation as "(1)" but cites it as Eq. 3 ilevbare2013a X4. The temperature and the heat-capacity values of the 2006 Table II are not printed, the methyl pyrrolidone check is about 30% low for nifedipine, and the polymer-phase values are predictions, not measurements [marsac2006b X10, X11; marsac2009 X17]. Solubility measured in a small analogue overestimates solubility in the polymer unless corrected for the smaller mixing entropy [marsac2006b C51]. The plotted terms of the ritonavir–atazanavir paper mix concentration scales; the ordering of the terms survives the recomputation [alhalaweh2016 X2]. For marsac2008a the γ in water is given as 1.89 × 10³ and 2.43 × 10⁵ in one reading and as 1.73 × 10³ and 2.31 × 10⁵ in another; both are reported as reproducing within the stated SD [marsac2008a E3, R10, R11].

The ratio form of the same relation for liquid PEG is on the page activity coefficient from solubility.

Concepts

crystalline solubility, activity coefficient, ideal solubility, drug solubility in polymer, micellar solubilization, amorphous solubility. Findings. C. Amorphous solubility and LLPS: F5, F10, F12. Miscibility and drug-polymer interactions: F8, F9. Bioperformance: F1, F6.

← Concepts and formulas

formula · as used in Dissolution

Stokes-Einstein equation

Expression

D_{NMR} = \frac{k_B T}{6\pi\eta r} indulkar2017a E5;

stated in words in the bile-salt paper, the diffusion coefficient of a particle falls with its radius,

D \propto \frac{1}{r} lu2017b E8.

The same expression, D=k_BT/(6\pi\eta r), is printed for a solute in a polymer melt [moseson2019 E3]. In indulkar2016 and hate2018 the equation is named but not printed [indulkar2016 E18; hate2018 E7].

Printed in the 2017 ritonavir paper for NTA sizing:

D = \frac{k_B T}{6\pi\eta r} purohit2017b E1

Named without an expression in the nifedipine and dihydropyridine papers indulkar2017b E7; saboo2019 E5 and in the 2020 critical-ratio calculation saboo2020a E6.

Variables and units

symbolmeaningunits
D_{NMR}self-diffusion coefficient of the micellem²/s indulkar2017a E5
k_B, TBoltzmann constant; temperature (25 °C)indulkar2017a E5
\etaviscosity of water at 25 °Cindulkar2017a C9
rhydrodynamic radiusnm indulkar2017a R25
r in NTA sizinghydrodynamic radius of nanodropletsnm (111–257 nm) [indulkar2016 R4]
Ddiffusion coefficient–
k_B, TBoltzmann constant; absolute temperatureK
\etadynamic viscosity of the medium–
rparticle (hydrodynamic) radiusnm

Assumptions and valid domain

Surfactant and drug do not change the viscosity, and a high SDS concentration minimizes the monomer contribution to the diffusion coefficient indulkar2017a C9. Used for 40 mg/mL SDS in D2O at 25 °C indulkar2017a P12. In the melt papers it is used to estimate solute diffusivity in high-viscosity media such as a polymer melt; the viscosity and radius are not given [moseson2019 E3]. Spherical particles in a Newtonian medium; limited at high viscosity [moseson2022c E19]. Particles in Brownian motion in suspension purohit2017b E1; for the drug–polymer ratio, similar viscosity for both, drug about 1 nm and polymer about 10 nm hydrodynamic radius saboo2020a E6.

Use in the library

paperused forvalues or fitted parametersstatus / recomputed
indulkar2017aradius of SDS micelles with 0, 0.4 and 7 mg/mL atazanavirD 10^−10.3, 10^−10.3, 10^−10.42 m²/s; r 4.61, 4.61, 6.08 nmreproduces within the rounding of the printed exponent (r about 4.90 nm for 10^−10.3 m²/s, extractor; the radius ratio 6.08 ÷ 4.61 = 1.319 equals 10^0.12) indulkar2017a E5, R25
lu2017bexplanation of the lower flux of drug carried in bile-salt aggregatesnonenamed only, no numerical output lu2017b E8, C46
other chapterssizing of drug-rich nanodroplets by NTAnoneprinted; not recomputed here [trasi2016 E4; purohit2017b E1; indulkar2016 E18; hate2018 E7; tres2018 E3]
moseson2019explaining why dissolution of IDM crystals in copovidone took hours and fragments stayed in placenoneinputs not printed [moseson2019 C39, C51, E3]
moseson2022cframework for the low fitted dissolution rate of bicalutamide crystals in the viscous meltnoneinputs not printed [moseson2022c E19, C37]
indulkar2016NTA sizing of clotrimazole droplets; constancy of the effective diffusion coefficient in the membranenonenamed only [indulkar2016 E18]
hate2018NTA sizingnonenamed only [hate2018 E7]
hate2022colloid size against PAMPA mass flowdiffusion coefficient inversely proportional to particle size, in wordsnamed only [hate2022 E3, C56]
indulkar2017bNTA sizing of nifedipine nanodroplets≈190–222 nmnamed only indulkar2017b E7, R7
saboo2019NTA of nilvadipine and cilnidipine medianone printed from NTAnamed only saboo2019 E5, R12
saboo2020adiffusion-coefficient ratio of felodipine and PVPVAD_{drug}/D_{polymer} = 10reproduces (10 nm / 1 nm at equal viscosity) saboo2020a E6, R27
saboo2020NTA of indomethacin and ester media250–350 nm statednamed only saboo2020 E7, R7

Where it fails or is disputed

The viscosity of water is used for a D2O solvent indulkar2017a X7. In the bile-salt paper it is used to explain the same flux drop that is read elsewhere as lower activity, and the two readings are not separated lu2017b X8. In the melt papers it was not tested against the measured gradient of about 8 µm after 1 h at 130 °C [moseson2019 R9]; the authors note its limitations at high viscosity [moseson2022c E19]. In the PAMPA study of hate2022 colloids of very different size gave the same mass flow, contrary to the Stokes-Einstein expectation (F22) [hate2022 C56, R17]. The inputs of the NTA runs (temperature, viscosity, diffusion coefficients) are not printed purohit2017b E1. The radii of the 2020 calculation are estimates saboo2020a E6.

Concepts

Stokes-Einstein equation, micelle/water partition coefficient, membrane flux, diffusion boundary layer, drug-rich nanodroplets, Higuchi two-component dissolution model. Findings. Amorphous solubility and LLPS: F17, F18. ASD process: F11, F36, F37. Bioperformance: F5, F22. Release mechanism and LoC: F4, F5, F16.

← Concepts and formulas

formula · as used in Dissolution

supersaturation from membrane flux ratio

Expression

In words: the supersaturation is directly proportional to flux, so S = J/J_{ref} with the flux of a reference solution at the crystalline solubility [raina2015c E9]; the activity form is F/F^\circ = a/a^\circ = \delta lu2017b E6.

The activity form

\frac{F}{F^{\circ}} = \frac{a}{a^{\circ}} = \delta

is printed again in the telaprevir growth and bile-salt papers lu2017a E1; lu2017 E2, and as SR = J/J^{*} for atazanavir and ritonavir indulkar2018 E3; indulkar2019b E3.

Variables and units

symbolmeaningunits
Jflux of the test solutionµg/min
J_{ref}reference flux (felodipine 1 µg/mL in buffer, S = 1)µg/min; not stated [raina2015c X5]
F, F^{\circ}flux from the test solution and from a solution saturated with crystalline drugµg min⁻¹ cm⁻² lu2017 E2
a, a^{\circ}activity of the drug in the solution and at crystalline saturationdimensionless
\deltaactivity-based supersaturationdimensionless

Assumptions and valid domain

Flux proportional to activity (E3 of the same card) [raina2015c E9]. The flux is proportional to activity whatever the share of drug in micelles (a regenerated-cellulose membrane, 6–8 kDa, side-by-side cell); the calibration of δ against concentration comes from a companion study of the same group lu2017 E1, E2, C6; lu2017a P2.

Use in the library

paperused forvalues or fitted parametersstatus / recomputed
raina2015cBSA solutionsS 7.3 and 4.2 from fluxinputs not printed; plot readings give about 16 and 9 [raina2015c E9, X5]
lu2017btelaprevir with bile saltsδ ≈ 26.5 at 140 µg/mLreproduces lu2017b E6
elkhabaz2019batazanavir and posaconazole in six mediaSR_{max} = J_{amph}/J_{eq}; atazanavir buffer-V1 0.119/0.00217 = 54.8 (figure about 55), six-medium mean 53.6reproduces elkhabaz2019b E4, R8, R9
lu2017set δ 11.5 and 28.8 in buffer and with six bile salts at 1.86 and 12 mMconcentration for δ 11.5: about 60 (most media), about 90 (SGCDC), about 140 µg/mL (12 mM STDC, SGDC, STCDC)plot readings lu2017 R1, X12
lu2017aset δ 2.4, 7.9, 12.5; read the free drug after 15 h of growthresidual 60.5 of 65.2 µg/mL (1.86 mM STCDC); 91.7 of 95.2 (SGCDC)measured; values are concentrations, not δ lu2017a R12, X17
indulkar2018atazanavir, ritonavir in buffer, FaSSIF-V1, Composite-SIF and the lecithin seriesSR = J/J^{*}; SR_{amorph} = J_{amorph}/J^{*}63–65; 9.2–10; about 40 in STC alone indulkar2018 E3, R12, R10
lu2018telaprevir in bile salt mixtures and complete mediaF/F^{\circ} = a/a^{\circ} = \delta with buffer calibrationδ 11.5 and 28.8 set per medium lu2018 E1, R1
indulkar2019batazanavir in SDSSR = J/J^{*}about 65 stated indulkar2019b E3, R2

Where it fails or is disputed

The reference flux behind the BSA values is not printed [raina2015c X5]. The flux ratio and the concentration ratio differ by up to about sixfold in pooled human fluid (posaconazole 29 against 5) (F18) elkhabaz2019b R9. Cell volumes, sampling times and replicates of the residual measurement are not printed; the starting concentration for SGCDC matches no δ of the calibration table; the error bars of the calibration curves are not defined lu2017a P5, X4; lu2017 X12. The formula is also printed by four papers outside the crystallization-from-solution chapter (see the evidence table). The flux at the crystalline solubility could not be measured for tacrolimus and cilnidipine, so their equal supersaturation is assumed indulkar2018 R13, X4.

Concepts

free drug concentration, supersaturation, thermodynamic activity, membrane flux. Findings. Bioperformance: F3, F18. Crystallization from solution: F31, F32, F33, F38, F39, F40.

← Concepts and formulas

formula · as used in Dissolution

supersaturation ratio

Expression

Printed in words: the supersaturation ratio is the LLPS concentration divided by the equilibrium solubility of the crystalline drug,

S = \frac{C_{\mathrm{LLPS}}}{C_{\mathrm{eq}}} (restated; printed in words) almeidaesousa2015 E15.

The paper of 2018 prints it with the symbols C and C^{*} for the amorphous and the crystalline solubility at the same pH,

S_C = \frac{C}{C^{*}} sugihara2018 E2.

In the ASD process papers the degree of supersaturation is the dissolved concentration over the crystalline solubility,

S=\frac{C}{C_{cryst}}

[li2019 E2]. The ritonavir granulation paper prints it in words as relative supersaturation, S=C/C^{*}, with C^{*} the crystal solubility trasi2019 E1; the residual-crystal paper prints it as the solution concentration over the equilibrium (crystalline) solubility moseson2020a E3. In the droplet-drying model the same ratio is C/S, the drug concentration over its solubility in the instantaneous droplet composition li2020 E14.

In the Bioperformance papers it is printed as

S = \frac{c}{c^{*}} [raina2015c E6],

with c^* the crystalline solubility in the same medium; it is also printed in words as experimental concentration over crystalline solubility [hate2017 E11].

The crystallization-from-solution papers print it as

S = \frac{C}{C_{eq}} alonzo2012 E1; ilevbare2013c E1;

S = \frac{c}{c^{*}} ilevbare2012c E4;

S = \frac{c}{c_{eq}}, \qquad \sigma = \ln S ilevbare2012b E1, E2;

S = \frac{c}{c_0} ilevbare2012a E2;

S = \frac{C}{C_0} ilevbare2013b E4; hsieh2012 E9.

In the Mesoporous silica papers it is printed as

S = \frac{C}{C^{*}} [dening2018 E6],

S = \frac{C}{C^{*}} [dening2019 E6], with the theoretical S of a dose given in words as the dose over volume divided by the crystalline solubility [dening2019 E6], and as

S \approx \frac{C}{C_{\mathrm{cry}}} (restated; printed in words) [mccarthy2020 E4].

In the ASD dissolution papers it is printed as

S = \frac{c}{c^{*}} konno2008a E4; xie2015 E5; xie2016a E3,

S = \frac{C}{C_{\mathrm{eq}}} chen2015a E1; li2016b E1, printed in words and called the apparent supersaturation ratio; and in the activity form

S = \frac{a}{a^{*}} = \frac{c\,\gamma^{\prime}}{c^{*}\,(\gamma^{\prime})^{*}} que2018 E1, with the activity coefficients taken as equal in simple buffer que2018 C10.

Variables and units

symbolmeaningunits
C_{LLPS}concentration at the onset of phase separationµg/mL almeidaesousa2015 R5
C_{eq}crystalline equilibrium solubility in the same mediumµg/mL almeidaesousa2015 R5
Sdegree of supersaturation (relative)dimensionless [li2019 E2; trasi2019 E1; moseson2020a E3]
Cmeasured, molecularly dissolved concentration (filtered or ultracentrifuged)µg/mL trasi2019 E1, C11
C_{cryst}, C^{*}, C_{cry}crystalline solubility of the stable form (equilibrium solubility in the same medium)µg/mL [trasi2019 E1; moseson2020a E3; mccarthy2020 E4]
theoretical Sconcentration if the whole dose dissolved, over the crystalline solubilitydimensionless [dening2019 E6; dening2018 P6]
C/Sdrug concentration over its solubility along the drying pathdimensionless li2020 E14
c, c^*solution concentration; crystalline solubility in the same mediumµg/mL; 128 µg/mL for nevirapine at pH 6.5 [hate2017 R1]
C_{eq}, c_{eq}, c^{*}, C_0, c_0equilibrium (crystalline) solubility at the test temperature and medium (crystallization-from-solution notation)µg/mL ilevbare2012b E1; ilevbare2012a E2; ilevbare2013b E4
\sigmanatural logarithm of S, used for growth analysesdimensionless ilevbare2012b E2
c, C; c^{*}, C_{\mathrm{eq}} (ASD dissolution notation)drug concentration in solution; equilibrium solubility of the crystal, for celecoxib Form III in the same mediumµg/mL konno2008a E4; chen2015a E1
C_{\mathrm{eq}} (lopinavir)crystalline solubility in a medium with the same excipients at the same temperatureµg/mL li2016b E1
a, a^{*}; \gamma^{\prime}, (\gamma^{\prime})^{*}activity and activity coefficient in the supersaturated and the saturated solution (paclitaxel)dimensionless que2018 E1

Assumptions and valid domain

None stated; it is a concentration ratio, not an activity ratio [almeidaesousa2015 E15; raina2015c C29]. In the process papers C is taken as the molecularly dissolved concentration, so colloids removed by 0.45 µm filtration are not counted trasi2019 C11. It is used against the crystalline solubility, not the amorphous one, so an S of 6 can lie below the amorphous solubility moseson2020a R1, X17. The Bioperformance papers state that it is valid only if the activity-coefficient ratio \gamma/\gamma^* is 1 (dilute solution, no solubilizer) and below the amorphous solubility [raina2015c C32; dening2018 E6]. In the crystallization-from-solution papers concentration replaces thermodynamic activity because the solutions are extremely dilute ilevbare2013b C14; the solubility is that of the stable crystal in the same buffer, measured without methanol ilevbare2012a R1; ilevbare2013c X16. In the pH-shift titration paper the degree of supersaturation is the peak concentration over the titration equilibrium solubility for type 1 bases but the supernatant over the HPLC crystalline solubility for type 2 bases hsieh2012 E9, X3. In the Mesoporous silica papers it states both the dose (theoretical S) and the result (achieved S) of release from silica, so their ratio is the fraction of the dose in solution [dening2018 P6, R6; mccarthy2020 R20, R21]. In the ASD dissolution papers, with surfactants, C_{\mathrm{eq}} is measured in each medium so that the same S gives the same driving force chen2015a C2; leached HPMCAS is assumed to leave C_{\mathrm{eq}} largely unchanged chen2015a C11. For lopinavir the ratio is called apparent because concentration ratios in complex media "may or may not" represent the driving force for crystallization li2016b C7, E1. The celecoxib papers print the form for dilute solutions xie2015 E5.

Use in the library

paperused forvalues or fitted parametersstatus / recomputed
almeidaesousa2015six drugs4.3–54.0 (fluorescence), 4.7–64.5 (extinction)eleven of twelve ratios reproduce; diclofenac extinction printed 51.6, recomputed 54.3 almeidaesousa2015 E15, R5
indulkar2015weak basesabout 13 and about 63stated in words (amorphous over crystalline solubility) indulkar2015 R10, C46
sugihara2018pazopanib, pH 5.0 to 8.4about 103, 304, 379, 505, 603, 528, 501 (pH 5.0, 5.5, 6.0, 6.4, 6.5, 7.0, 8.4)reproduces (pH 6.5: 19.8 ÷ 0.033 = 600 against about 603) sugihara2018 E2, R4
li2019degree of supersaturation of lopinavir releasenone printedprinted [li2019 E2]
trasi2019compare single-drug and co-granulated dissolution at pH 6.8RTV about 17 alone and about 3 co-granulated; LPV about 7 and 5; C^{*} 1.8 and 2.9 µg/mLreproduces: 31 / 1.8 = 17.2 and 19 / 2.9 = 6.6; the figure values give about 2.0–2.2 for the co-granulated RTV trasi2019 R5, E1, X3
moseson2020athe test condition of 50 µg/mL indomethacinS = 6 (crystalline solubility about 8 µg/mL)reproduces: 50 / 8 = 6.25 moseson2020a E3, R1
li2020supersaturation of a drying dropletpeak about 2.4 (12.5:87.5 water:methanol) and about 320 (15:85) at 25% DLmodel output li2020 R20
raina2015ctest of c/c* against fluxBSA 0.1%: 50/39.0 = 1.28; 1%: 50/47.8 = 1.05reproduces [raina2015c E6]
hate2017nominal supersaturation after the pH shift500/128 = 3.91 (printed 3.9)reproduces [hate2017 E11]
alonzo2012felodipine S 3–12Ceq about 0.5 µg/mL; S 10 = 5 µg/mLreproduces alonzo2012 E1
ilevbare2013cinduction-time starts for celecoxib, ritonavir, efavirenzS 14.7, 15.4, 2.4; 22/1.5 = 14.67efavirenz printed 2.4 against recomputed 2.32 from 19/8.2 ilevbare2013c E1, X4
li2016aS' = C/Cs with the solubility measured with 0.1% bile saltnevirapine 7.1–8.7; celecoxib 13.6 printed, 16.7 recomputedmismatch for celecoxib li2016a E1, X1
elkhabaz2019bconcentration-based maximum in six mediaatazanavir buffer-V1 79/1.4 = 56.4; posaconazole human fluid 13.2/2.6 = 5.1reproduces elkhabaz2019b E1, R8, R9
hate2019tacrolimus dose levels5 mg in 100 mL: 50/2.5 = 20; in 240 mL: S 8reproduces hate2019 E2, R7
purohit2019crystallized capsule contents against the crystalline solubilityabout 3.7/1.5 = 2.5; with text values 4/1.4 = 2.9reproduces purohit2019 E1, R5, X1
nguyen2023apretomanid nucleation80/16.2 = 4.9 (stated 5); 160/16.2 = 9.9 (stated about 10)reproduces [nguyen2023a E1, R5, R6]
ilevbare2012critonavir S 7.610 µg/mL over 1.3 µg/mLprinted 7.6, recomputed 7.7 (10/1.3 = 7.69) ilevbare2012c E4
ilevbare2012britonavir S 3.8, 7.6, 15.3; σ_c 1.37c_eq about 1.31 µg/mL fits the printed setreproduces within rounding; σc 1.37 gives 5.13 µg/mL ilevbare2012b E1, E2
ilevbare2012aritonavir 100 and 50 mM bufferS 7.6/7.7 and 4.310/2.3 = 4.35 reproduces 4.3 ilevbare2012a E2
ilevbare2013bcelecoxib, efavirenz, ritonavirS 6.6, 1.2, 7.6, 14.7, 15.410/1.5 and 10/1.3 printed as 6.6 and 7.6 (truncated) ilevbare2013b E4
hsieh2012degree of supersaturationdipyridamole 71.3/5.7 = 12.5reproduces hsieh2012 E9
chen2015ratio of drug concentration to the crystalline solubility in the medium of interest, fixed per drug1.5–15 for 11 drugs; Ceq 0.2–81.3 µg/mLprinted in words; reproduces (13 × 19.0 = 247 µg/mL) chen2015 E2, R1
schram2015S = C/Ceq of felodipine, 4 µg/mL over about 0.5 µg/mLS 8reproduces schram2015 E1
schram2016same, 2 µg/mLS 4 (ln S 1.39)reproduces schram2016 E1, R13
dening2018ritonavir doses and the dilution scheduleS 7.8 (27.9/3.6) and 3.9; stepwise to 1reproduces (27.9/3.6 = 7.75; 14/3.6 = 3.9) [dening2018 E6, M1]
dening2019theoretical S of the dilution steps7.8, 3.9, 2.6, 1.9, 1.3, 1.0reproduces (28/3.6 = 7.8) [dening2019 E6, R16]
mccarthy2020theoretical and achieved S of indomethacin and methyl ester15.3 and 21.4 theoretical; 7.2 and 7.0 achievedreproduces (35.1/2.29 = 15.3; 9.0/0.42 = 21.4; 16.6/2.29 = 7.2) [mccarthy2020 E4, R21, R20]
konno2008aqualitative: nucleation rate rises with Snonenot applicable konno2008a E4
chen2015aS = 5 start in eight media; S of suspension liquidsSDS 107/14.5reproduces, 7.38 against printed 7.4 chen2015a E1, R17
alonzo2011supersaturation ratio about 60 of methanol-shift solutionscrystalline solubility at 25 °C not printedapproximate alonzo2011 C30, X9
li2016blopinavir leached from HPMCAS-HF and HPMCP suspensions into surfactant media, pH 3about 3.3–3.9 (HF) and 1.6–1.8 (HPMCP) across surfactantsreproduces nine of ten bars; HF without surfactant ≈7.3/1.9 = 3.8 against ≈3.9 li2016b E1, R20, X2
xie2015celecoxib 22 µg/mL with and without polymernone printedextractor calculation: 22/1.5 ≈ 14.7 without polymer, ≈10.3–11.6 with 22 µg/mL polymer xie2015 E5, X9
xie2016acelecoxib 22 µg/mLnone printedextractor calculation: 22/1.5 ≈ 15 without polymer xie2016a E3
que2018paclitaxel at the amorphous solubility31.6/0.36 ≈ 88reproduces, 87.8 against printed 88 que2018 E1, R1, R2
nguyen2023cdelamanid dispersions after 1 h in acid, against the crystalline solubility at that pH≈0.9–3.8 (pH 1.6), ≈3.3–11.4 (pH 3.0), ≈11–42 (pH 5.0); 42 at the amorphous solubilityreproduces at pH 6.5, 0.76/0.018 = 42.2 against printed 42 nguyen2023c E2, R13, R2

Where it fails or is disputed

The printed diclofenac extinction ratio is probably a misprint almeidaesousa2015 X1. The sorafenib ratio is stated as 54 and "between 50 and 60" and is 64.5 by extinction almeidaesousa2015 X14. The ratio is quoted as about 600 (abstract), 500–600 (results) and about 500 (conclusions) for the same data sugihara2018 X1; it is a concentration ratio, not an activity ratio (see activity-based supersaturation ratio). In the process papers the values of C^{*} at pH 6.8 for ritonavir and lopinavir are given without method or reference, so every S of that paper depends on them trasi2019 X14. A concentration-based ratio ignores that the driving force depends on the chemical potential, which is lowered when two drugs mix in one phase trasi2019 C38. With solubilizers c/c* under-reads the activity-based supersaturation [raina2015c C38]. It is not valid above the amorphous solubility [dening2018 E6]. In hate2019 the same dose gives S 8 or S 20 depending on volume, and the choice decides whether absorption or growth on seeds dominates (F28, F29) hate2019 E2, R7. A polymer can change the crystalline solubility, so S computed from the polymer-free value differs from S with the polymer (F19) hsieh2014 C18; ilevbare2013c X7. The printed values of S differ by rounding (7.6 and 7.7; 15.3 and 15.4) ilevbare2012a X1. Methanol (about 0.5% v/v) is present in the media but not in the solubility measurement ilevbare2013c X16. The ratio of concentration to solubility understates the supersaturation of celecoxib in bile-salt and HPMCAS media, where the mass flow does not change li2016a X18; the equilibrium concentration in the HPMCAS and SDS media was not reported for felodipine schram2016 X9. The supporting table of the indomethacin paper gives S values (8.2, 6.6, 7.4) that do not follow from the printed concentrations and solubilities [mccarthy2020 X6]. The dilution schedule of the ritonavir paper lists seven S values for six periods, so the S of the last samples is uncertain [dening2018 X6]. A misprint gives the lower ritonavir dose as S 3.6 instead of 3.9 [dening2018 X1]. In the celecoxib suspensions with SDS the normalization ignores about 860 µg/mL leached HPMCAS chen2015a X10; in polysorbate 80 S fell to ≈0.85, within the uncertainty of the solubility used chen2015a X14; the surfactant-free solubility is 1.1 or 1.2 µg/mL depending on the table chen2015a X16. For lopinavir with HPMCP and polysorbate 80 the plotted ratio ≈1.55 does not follow from the paper's own inputs, ≈7.45/3.2 = 2.3 li2016b X2. The celecoxib dispersion authors call the supersaturation the same for all polymer solutions, whereas the polymers raised the crystalline solubility by 26–43%, so S was about 1.3–1.4 times higher without polymer xie2015 C43, X9. For delamanid the ratios printed as 42 at pH 5.0 equal the amorphous-to-crystalline ratio, although the measured concentrations at that pH were far above the amorphous solubility, so the value looks capped nguyen2023c X9. The gastric ratio did not order the final release of the delamanid dispersions nguyen2023c C39.

Concepts

supersaturation ratio, supersaturation, crystalline solubility, amorphous solubility advantage, non-sink dissolution, desupersaturation, incomplete drug release, micellar solubilization. Findings. Amorphous solubility and LLPS: F6, F16. ASD process: F20, F23, F25. Bioperformance: F3, F4, F10, F11, F14, F18, F23, F27, F28, F29, F30. Crystallization from solution: F1, F9, F14, F19, F23, F24, F28, F29, F31. Mesoporous silica: F7, F8, F15. Supersaturation from ASD dissolution: F4, F5, F6, F14, F15, F17, F19, F22, F24, F25.

← Concepts and formulas

formula · as used in Dissolution

surface-normalized release rate

Evidence table: surface-normalized release rate. Content from the release-mechanism chapter (2018–2025), with rows from the ASD process and Peptide permeability chapters.

Expression

A = \frac{k \times V}{S \times N} saboo2020a E3

R = \frac{k \times V}{S \times x} bapat2025b E1

Stated in words: the release rate is "normalized (to account for differences in drug and polymer content)" bhardwaj2018 E4; the slope of the initial linear part of percent release against time, normalized to each component's content and to the exposed area saboo2019 E4; the slope of drug concentration against time normalized by the area of the dissolving front and by the drug loading li2020 E13.

Printed in the papers of 2020–2022:

R = \frac{k \times V}{S \times x} saboo2020 E1

R = \frac{k\,V}{A\,x} yang2021 E1

R = \frac{k}{S \times x} correasoto2022a E1

R = \frac{k}{S \times x} correasoto2022b E1

In the last two forms k is the slope of cumulative mg released, so the medium volume drops out correasoto2022a E1.

Printed in the papers of 2022–2023:

R = \frac{k\,V}{A\,x} yang2022a E1

R = \frac{k \times V}{S \times x} bapat2023 E1

R = \frac{k}{S \times x} correasoto2023 E1

Printed in the papers of 2023–2025:

R = \frac{k\,V}{A\,x} yang2023 E1

R = \frac{k \times V}{S \times x} bapat2024 E1

R = \frac{k \times V}{S \times x} bapat2025a E1

Variables and units

symbolmeaningunit
A, Rnormalized release rate of one componentmg/min/cm² (µg/min/cm² in the 2018 paper)
kslope of the regression line of concentration against time, not including the originmg/(mL min)
Vvolume of medium100 mL
Sexposed compact area0.5 cm²
N, xweight fraction of the component–
A (2022 ritonavir form)exposed surface area of the compactunits not printed

Assumptions and valid domain

The weight fraction is used on the assumption that the component densities are similar saboo2020a E3; the exposed area stays constant saboo2019 E4; the slope is taken from the linear part of the release curve bapat2025b E1. Used for compacts of 25–100 mg in an 8 mm die bhardwaj2018 P6; saboo2019 P9; saboo2020a P6. Slope from the linear region, the first 30 min when the profile is not linear yang2021 E1; from the initial linear points with the exposed area assumed constant correasoto2022a E1; slope window not stated correasoto2022b X19. The 2023 plasticizer paper took the slope after a lag time, from 30 to 60 min, where a lag occurred correasoto2023 E1, P6.

Use in the library

paperused forvalues or fitted parametersstatus / recomputed
bhardwaj2018loading-normalized ITZ and PVPVA rates of spray-dried compacts≈100, ≈250, ≈555, ≈2000 µg/min/cm² at 50, 25, 20, 10%reproduces if the rate is divided by the weight fraction: 106, 256, 565, 1990 bhardwaj2018 E4, R11
saboo2019nilvadipine, cilnidipine and PVPVA rates0.002–3.49 mg/min/cm²inputs not printed saboo2019 E4, R5, R6
saboo2020afelodipine and polymer rates, five polymers; 40% HPMCAS analogues≈0.0008–3.8 mg/min/cm²inputs not printed; plot-based check in X10 saboo2020a E3, R13, R14, R16
li2020 (ASD process)spray-dried ritonavir–PVPVAsurface-normalized dissolution rateinputs not printed li2020 E13
bapat2025b (Peptide permeability)release of OCA, SNAC and PVPVAneat PVPVA ≈3.2; OCA ≈8.1 mg/min/cm²reproduces within plot reading (≈3.1 and ≈8.6) bapat2025b E1, R2
saboo2020indomethacin and its methyl ester with PVPVA over 5 min≈0.01–4.2 mg/min/cm²; neat PVPVA ≈3.4plot check reproduces neat PVPVA ≈3.4 saboo2020 E1, R3
yang2021loratadine compacts with PVPVA and HPMCAS at 37 and 5 °C≈0–3.45 mg/min/cm²inputs not printed yang2021 E1, R18, R21
correasoto2022aclopidogrel and PVPVA, 40–60% ± surfactant≈0.2–6.7 mg/min/cm²inputs not printed correasoto2022a E1, R18
correasoto2022batazanavir and PVPVA with additives, 37 and 55 °C≈0.07–5.6 mg/min/cm²inputs not printed correasoto2022b E1, R3, R7
yang2022aritonavir and PVPVA rates, 10–50%congruency judged on normalized ratesinputs not printed yang2022a E1, R1, R2
bapat2023HPMCAS-MF, its salt, indomethacin and its methyl ester by medium and rotation speed≈0.12–1.62 mg/min/cm² at 100 rpminputs not printed bapat2023 E1, R5, R9, R10, R16
correasoto2023atazanavir, ledipasvir and PVPVA with plasticizersatazanavir ≈2.0–5.1; PVPVA with plasticizer ≈4.8–6.1; neat PVPVA ≈2.7 mg/min/cm²inputs not printed correasoto2023 E1, R6, R7, R13
yang2023PVPVA release from surfactant blends; Tween 80 dispersion at 30 against 40%≈3.6–6.9 mg/min/cm² (blends)inputs not printed yang2023 E1, R5
bapat2024drug and HPMCAS rates of eight drugs, 5–60%≈0.01–0.85 mg/min/cm²bapat2024 E1, R2
bapat2025aloratadine and cinnarizine in three HPMCAS grades≈0.01–0.73 mg/min/cm²bapat2025a E1, R2, R3

Where it fails or is disputed

For neat PVPVA an extractor check of the 2020 release curve gives ≈1.7 mg/min/cm² against ≈3.4 plotted, while the same check reproduces the other neat polymers; the compact mass of the neat polymers is not stated saboo2020a X10. The visible part of the 2018 PVPVA curve corresponds to about 8 against the stated 10.4 mg/min/cm² bhardwaj2018 X8. The neat PVPVA compact of the ledipasvir study weighed 250 mg against 100 mg for the dispersions que2019 X13. The basis of the felodipine–TPGS rates is not stated and they appear to be per total dispersion mass saboo2021 X4; the rates of the analogue study were derived in an unstated way que2021 X6; for ternary dispersions whether x uses the drug:polymer ratio or the weight fraction is not stated correasoto2022a X9. The basis of x (with or without surfactant) is not stated in the 2023 surfactant study yang2023 X10; in the 2025 grade paper the cinnarizine concentrations after 1 h do not match the plotted rates bapat2025a X8.

Concepts

intrinsic dissolution rate, congruent release, limit of congruency. Findings. Release mechanism and LoC: F1, F2, F3, F6, F11, F13, F14, F15, F17, F19, F21, F23, F26, F31, F32, F33.

← Concepts and formulas

formula · as used in Dissolution

Vogel-Tammann-Fulcher equation

Expression

\tau = \tau_0 \exp\left(\frac{D\,T_0}{T - T_0}\right) [baird2010 E12];

\eta = \eta_0 \exp\left(\frac{D\,T_0}{T - T_0}\right) [baird2012 E4].

Variables and units

symbolmeaningunits
\tau, \etamean molecular relaxation time, or viscositys; Pa·s [baird2010 E12; baird2012 E4]
\tau_0, \eta_0value for the unrestricted materialτ0 ≈ 10⁻¹⁴ s [baird2010 E12]
Dstrength parameterdimensionless [baird2012 E4]
T_0zero-mobility temperature, for some systems the Kauzmann temperatureK [baird2012 E4]

Assumptions and valid domain

For the strength parameter D^b: T_0 = T_K, τ(Tg) ≈ 10² s, τ0 ≈ 10⁻¹⁴ s [baird2010 E12]. Valid from Tm down to about 0.4 Tg on a scale with T_g = 0 and T_m = 1, with D and T0 fitted together [baird2012 E4]. Strong liquids have D above 30, fragile ones below 10 [baird2010 R30].

Use in the library

paperused forvalues or fitted parametersstatus / recomputed
baird2010D^b from Tg and Kauzmann temperature for class II and IIIindomethacin D^b 5reproduces: \ln(10^{16}) \times (318.15 - 282.15)/282.15 = 4.70 [baird2010 E12, R18]
baird2012fits of melt viscosity for 28 compoundsD 4.3–8.7, all below 10inputs not printed (η0 not reported) [baird2012 E4, R12]

Where it fails or is disputed

The fitted T0 and D do not satisfy the paper's own relation between T0, D and Tg [baird2012 X5]. The six class I-A compounds were not fitted, though the abstract calls all compounds fragile [baird2012 X7]. Whether a compound counts as strong or fragile depends on using m or D [baird2010 X14]. Good and poor glass formers showed the same non-Arrhenius behaviour, so kinetic fragility "may not accurately assess" glass-forming ability [baird2012 C43]; fragility was also invoked, untested, for two growth-rate outliers [trasi2014a C29, X18].

Concepts

fragility, melt viscosity, glass transition temperature, supercooled liquid. Findings. F5, F12.

← Concepts and formulas

formula · as used in Dissolution

water plasticization rule of thumb

Evidence table: water plasticization rule of thumb. Content from the release-mechanism chapter (2017–2022), with a row from the amorphous solubility and LLPS chapter.

Expression

Stated in words: the wet Tg equals the dry Tg less about 10 °C for each 1% of water sorbed indulkar2017b E6; Tg falls by about 10 °C for each 1% of water sorbed ilevbare2013a E15. Written as an expression (synthesis: transcription of the words):

T_{g,\mathrm{wet}} \approx T_{g,\mathrm{dry}} - 10\,w

Variables and units

symbolmeaningunit
T_{g,\mathrm{wet}}, T_{g,\mathrm{dry}}glass transition temperature with and without sorbed water°C
wwater content% (w/w)

Assumptions and valid domain

A typical observation, taken from indomethacin (cited) indulkar2017b E6; cited from earlier work ilevbare2013a E15.

Use in the library

paperused forvalues or fitted parametersstatus / recomputed
indulkar2017bwet Tg of water-saturated nifedipine dropletsdry 42 °C, 2.5% water, approximately 17 °Creproduces: 42 − 10 × 2.5 = 17 indulkar2017b E6, M1, C16
ilevbare2013a (LLPS chapter)Tg of a water-saturated drug-rich phasedry 50.4 °C, 0.4 °C with 4.87% waterreproduces within rounding: 50.0 / 4.87 = 10.3 °C per 1% ilevbare2013a E15
saboo2020wet Tg of amorphous indomethacin from 37 °C sorption29 °Cinputs not printed saboo2020 E6, M1
yang2021wet Tg of miconazole, danazol, elbasvir from 37 °C sorption−4.7, 73.3, 129.1 °Cinputs not printed yang2021 E3, M2, M3, M4
hiew2022bwet Tg of lumefantrine dispersions with 35–55% waterall below 37 °Creproduces: 105.5 − 10 × 35 lies far below 37 hiew2022b E3, C44, R5

Where it fails or is disputed

The nifedipine water content was extrapolated from a 25 °C sorption profile to 100% RH and no Tg of water-saturated nifedipine was measured indulkar2017b X8. For lumefantrine dispersions the rule puts every wet Tg below 37 °C, so it cannot by itself explain release hiew2022b C44; a measured 70% indomethacin dispersion fell from 62.64 to 18.48 °C with about 6% water, about 7 °C per 1% (synthesis: 44.2/6) saboo2020 R30.

Concepts

plasticization by water, glass transition temperature, supercooled liquid. Findings. Release mechanism and LoC: F5, F18, F22.