Topic 1Two release regimes and their measurement1 of 5
Assay the polymer beside the drug, or dissolve into drug-saturated medium, to tell polymer-controlled from drug-controlled release.
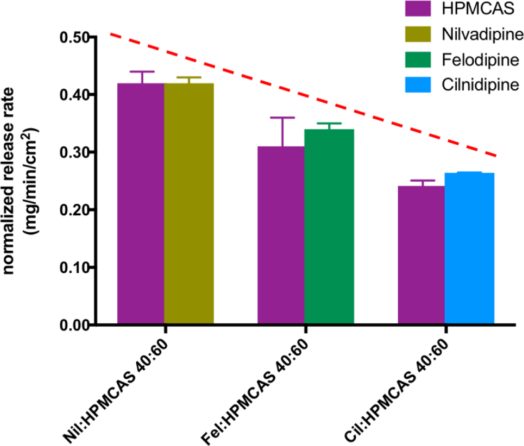
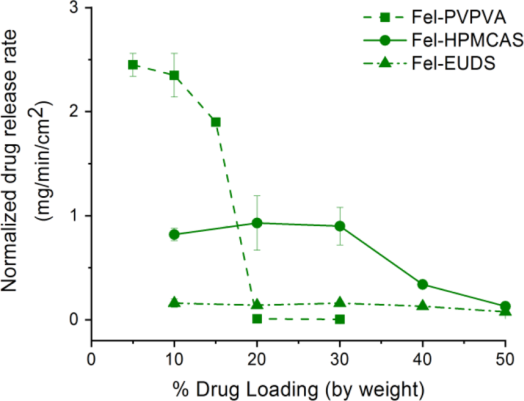
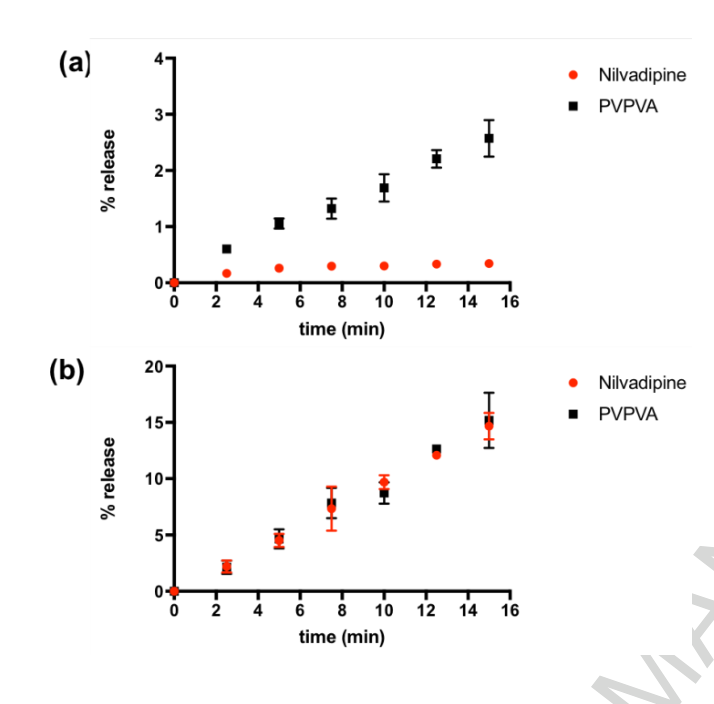
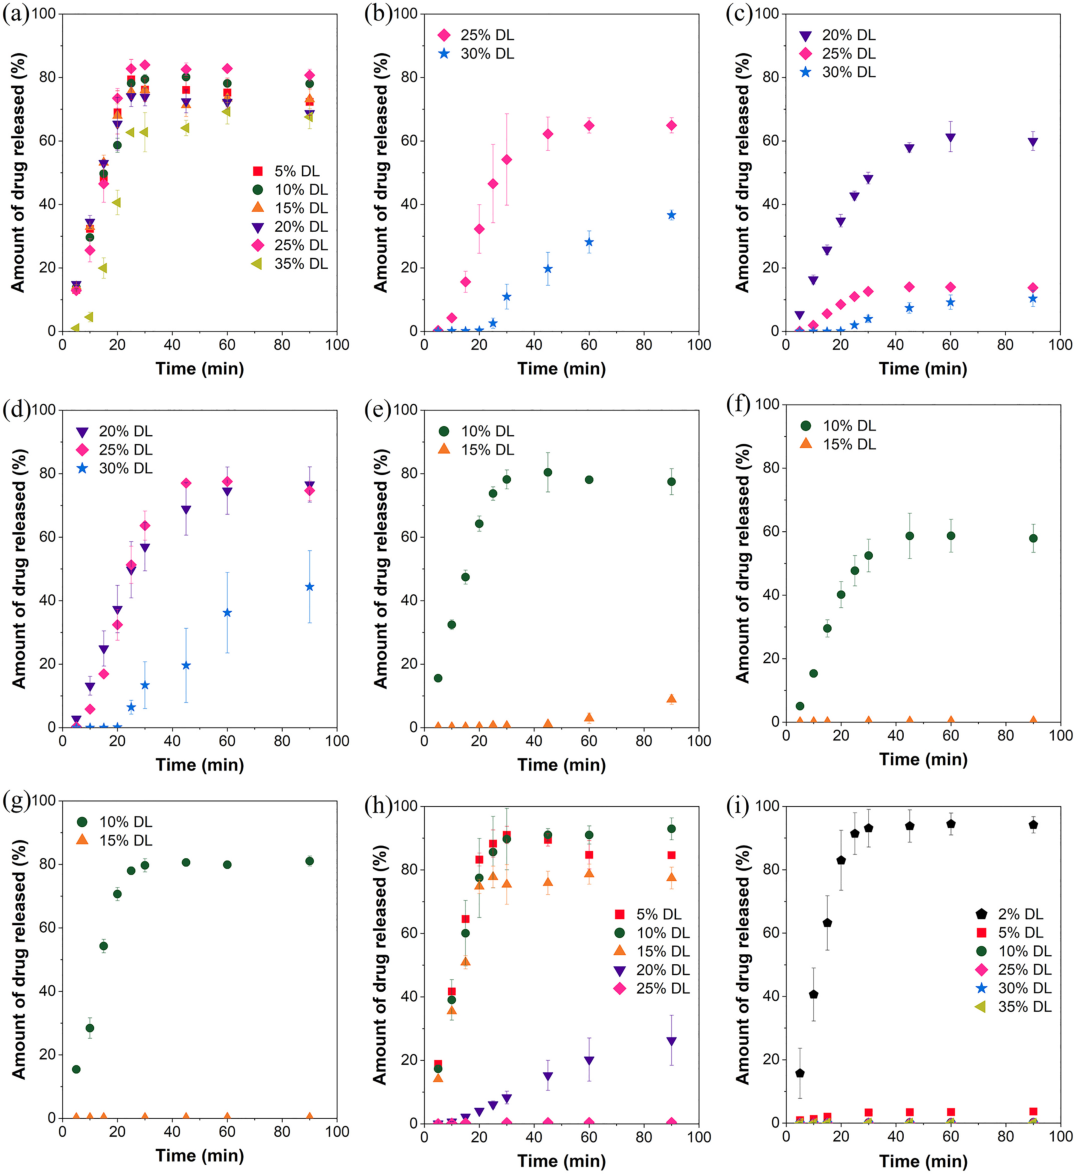
Five papers of 2018–2020 pressed the dispersion into a die so that one face of about 0.5 cm² dissolved, and assayed drug and polymer in the same samples. Each rate was divided by the component's weight fraction, so equal values mean that both leave in the ratio in which they are present bhardwaj2018 P6, P7, E4; indulkar2019a P2, P3, P4; saboo2019 P9, E4; saboo2020a P6, E3. A second test dissolves the dispersion into medium already at the amorphous solubility: release that continues is polymer-controlled, release that stops is drug-controlled indulkar2019a R12, C43, C42.
moderateModerate to strong: drug and polymer were assayed separately in triplicate on compacts of fixed area in four papers, but the limits are brackets between loadings usually 5% apart and no paper states a numerical criterion for "congruent" saboo2019 K1; indulkar2019a K1, X7; saboo2020a X11.
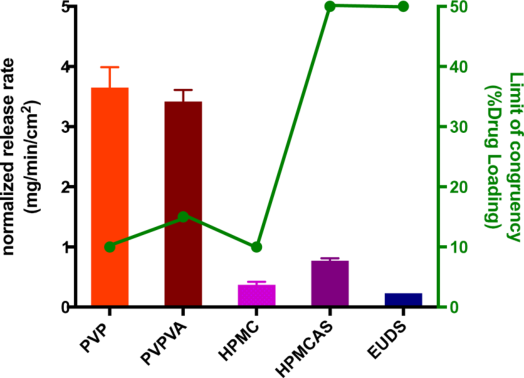
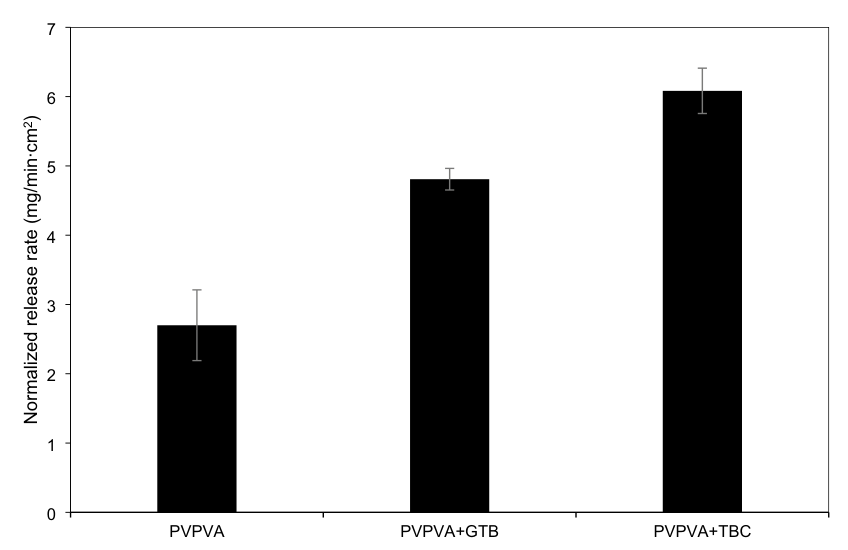
Neat references set the scale; the 10% dispersion releases its drug near the polymer rate. saboo2019 R5, R7, R8; saboo2020a R13
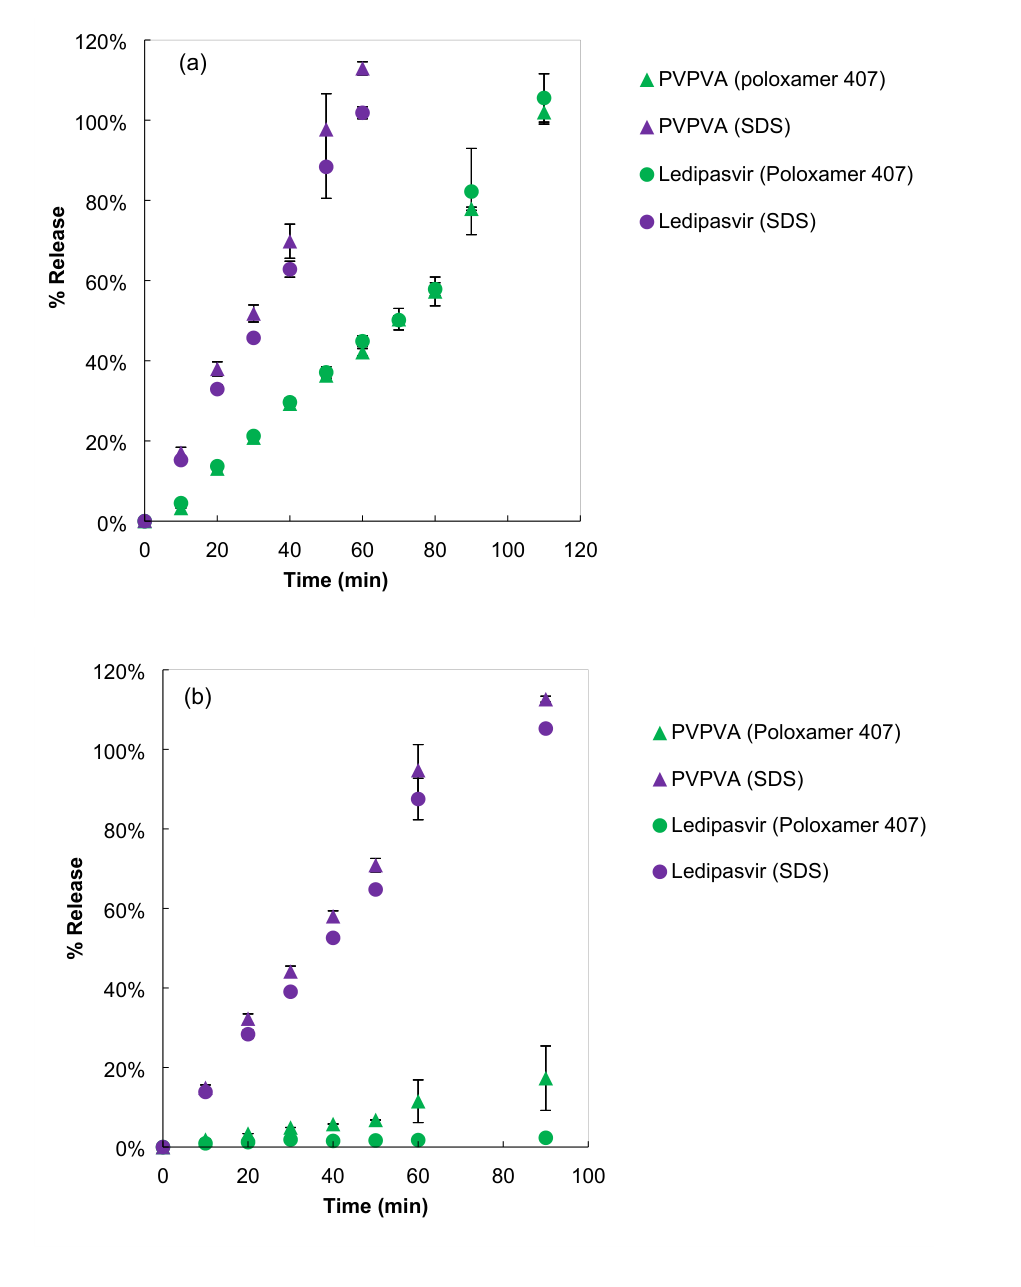
Release that continues into saturated medium is polymer-controlled; release that stops is drug-controlled. indulkar2019a R12, R13
For your drug
- Press compacts of the dispersion, the neat polymer and the neat amorphous drug of the same mass into the same die, assay the polymer in the same samples, and compare normalized rates by a statistical test.
- Run the lowest and the target loading once more in medium presaturated at the amorphous solubility.
- Near an expected switch use loading steps finer than 5%, and run the test for at least 30–60 min, since 5-min rates missed surface crystallization.
saboo2019 P10, P20; saboo2020a P7, X11; indulkar2019a R12, C43, C42; saboo2020 R8
How it works and key numbers
- A single solid dissolves by \frac{dm}{dt} = A\,\frac{D}{h}\,(C_s - C_b) indulkar2017b E4.
- If the drug controls the surface, C_s is the amorphous solubility; in medium already at it, C_s = C_{amorph} = C_b and there is no driving force indulkar2017b E5.
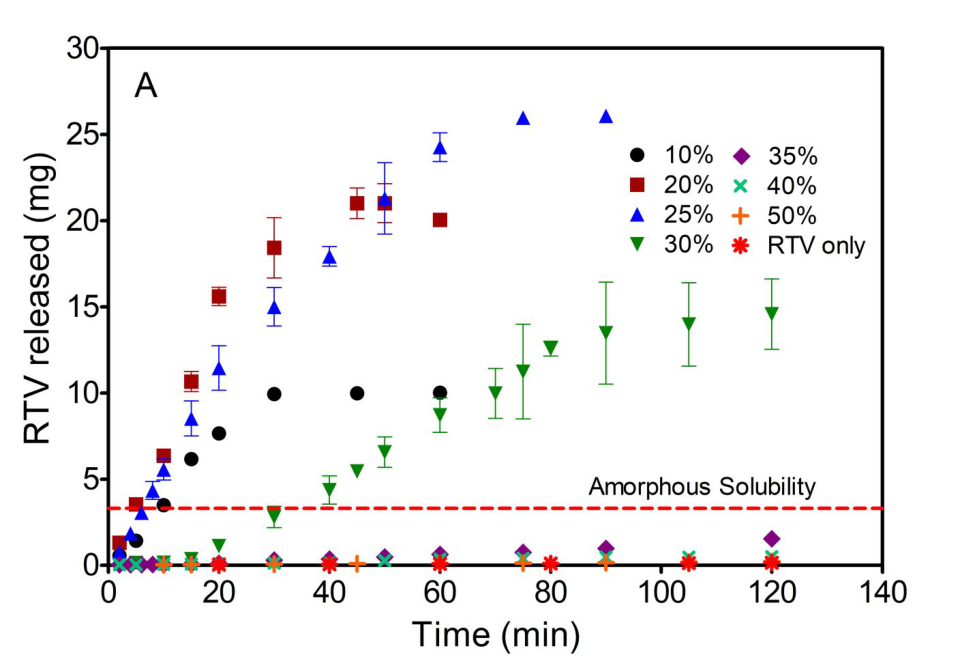
- If the polymer controls, the drug leaves at the polymer rate times the mass ratio, (dC/dt)_{drug} = (dC/dt)_{polymer}\, m_{drug}/m_{polymer}; at 10% ritonavir and 20 min, ≈67 mg PVPVA × 10/90 gives ≈7.4 mg against ≈7.6 mg ritonavir read from the plot indulkar2019a E3, R1, R2.
- Normalized by weight fraction, the same relation predicts equal drug and polymer rates, which is how congruency is read saboo2020a E2, E3.
- The constant face removes the particle-size and disintegration effects of powders indulkar2019a C15.
Evidence: data, conditions and papers
Finding F1. Assaying the polymer beside the drug from a compact of constant area, and dissolving it into medium already at the amorphous solubility, tells polymer-controlled from drug-controlled release; the drug concentration alone does not
In short. Five papers of 2018–2020 pressed 25–100 mg of dispersion into a die so that one face of about 0.5 cm² dissolved, assayed drug and polymer in the same samples and divided each rate by the component's weight fraction, so that equal values mean that both leave in the ratio in which they are present bhardwaj2018 P6, P7, E4; indulkar2019a P2, P3, P4; que2019 P3, P4; saboo2019 P9, E4; saboo2020a P6, E3. Against compacts of the neat components the gap is large: neat PVPVA dissolved about 1700 times faster than amorphous nilvadipine (3.49 against 0.002 mg/min/cm²), and five polymers 290–4600 times faster than amorphous felodipine saboo2019 R5, R7; saboo2020a R13. Dissolving into a medium presaturated with drug separates the regimes: 10% ritonavir–PVPVA tablets released as in plain buffer while 50% tablets released no drug, and nifedipine dispersions kept dissolving into water already at their amorphous solubility of 110 µg/mL indulkar2019a R12, R13; indulkar2017b R8, R9, R1. The limits of congruency these tests give are brackets between tested loadings, usually 5% apart, and no paper states a numerical criterion for "congruent" indulkar2019a X7; saboo2019 X11; saboo2020a X11.
Type. method comparison Strength. to strong: drug and polymer were assayed separately in triplicate on compacts of fixed area in four papers, with t-tests in one, and the presaturated-medium test gave the clearest single contrast of the chapter saboo2019 K1: strong; indulkar2019a K1: strong, K3: moderate to strong; weaker where the normalization, the presaturation or the neat-compact mass is not stated saboo2020a X10; indulkar2019a X8; que2019 X13.
How it was shown
Five papers of 2018–2020 pressed 25–100 mg of dispersion into a die so that one face of about 0.50 cm² dissolved, assayed drug and polymer in the same samples and divided each rate by the component's weight fraction bhardwaj2018 P6, P7, E4; indulkar2019a P2, P3; saboo2019 P9, E4; saboo2020a P6, E3. Indulkar and co-workers also dissolved nifedipine (2017) and ritonavir–PVPVA (2019) dispersions into medium presaturated with the drug indulkar2017b P1, P7; indulkar2019a P4, P5.
What the data show
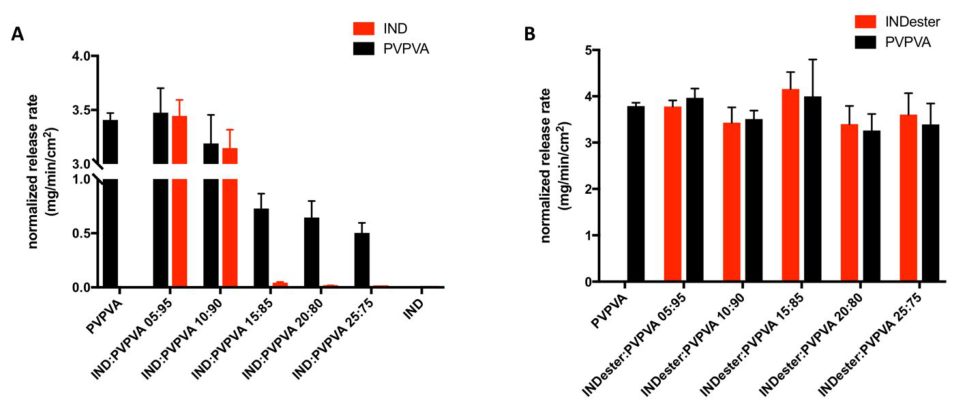
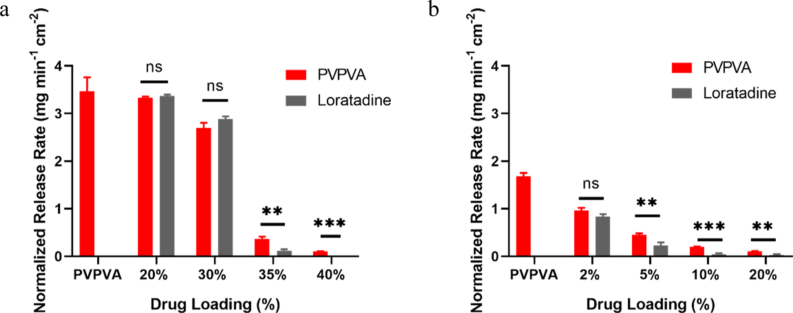
Normalized drug and polymer rates of congruent dispersions were statistically equal (2.13 against 2.35 mg/min/cm² for 10% nilvadipine, "ns"), and those of incongruent ones differed at p ≤ 0.001 to 0.0001 saboo2019 R5, R8.
| test | system and conditions | result | ids |
|---|---|---|---|
| neat compacts | PVPVA and amorphous nilvadipine, pH 6.8, 100 rpm | 3.49 and 0.002 mg/min/cm² (≈1700-fold) | saboo2019 R5, R7 |
| neat compacts | five polymers and amorphous felodipine | polymers ≈0.23–3.6, felodipine ≈0.0008 mg/min/cm² (290–4600-fold) | saboo2020a R13 |
| normalized rates, t-test | nilvadipine and cilnidipine in PVPVA | drug = polymer (ns) up to 10% and 15%; p ≤ 0.001 above | saboo2019 R8 |
| presaturated buffer | ritonavir–PVPVA 10, 30, 50%, 37 °C | 10% unchanged; 30% still releasing; 50% zero | indulkar2019a R12, R13 |
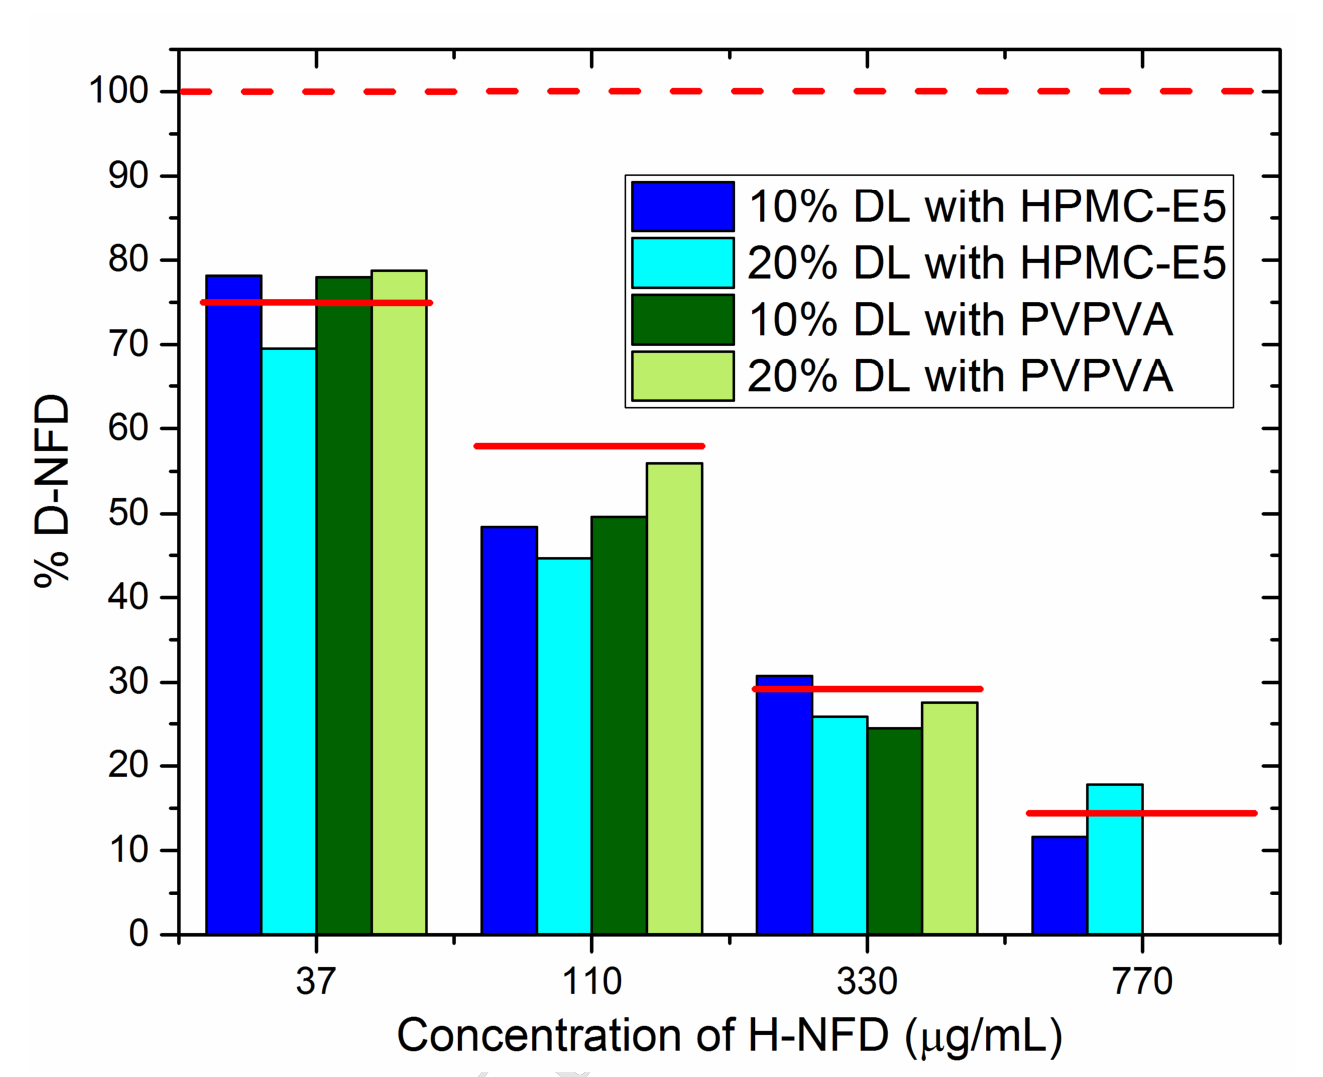
| presaturated D2O, 110 µg/mL | nifedipine 10, 20%, HPMC-E5 and PVPVA, 5 °C | release continued to ≈214–218 µg/mL | indulkar2017b R8, R9 |
| 5-min rates against 30-min profiles | indomethacin methyl ester–PVPVA | limit ≥25% by 5-min rates, congruent over 30 min only at 5% | saboo2020 C14, R8 |
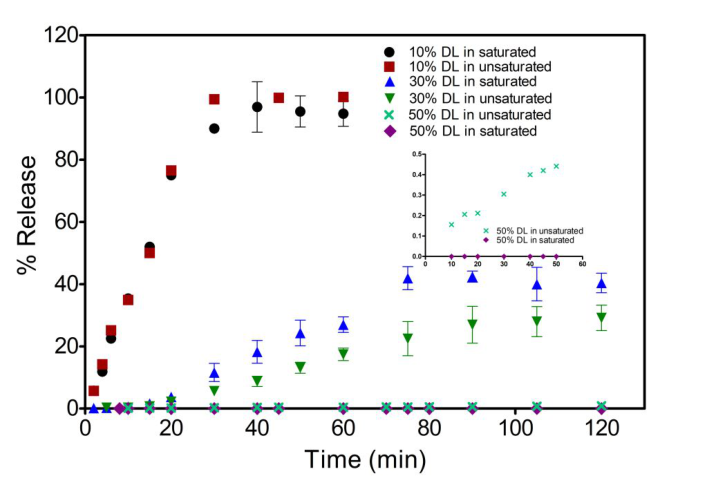
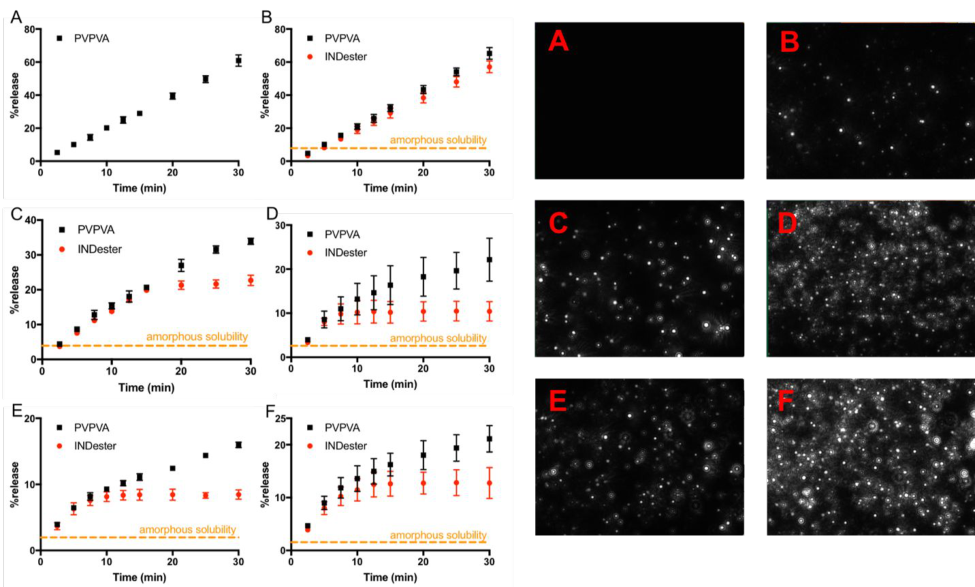
The 10% curves overlap in both media, while the 50% tablet (inset) shows a small rise in plain buffer and none in saturated buffer indulkar2019a R12.
Why
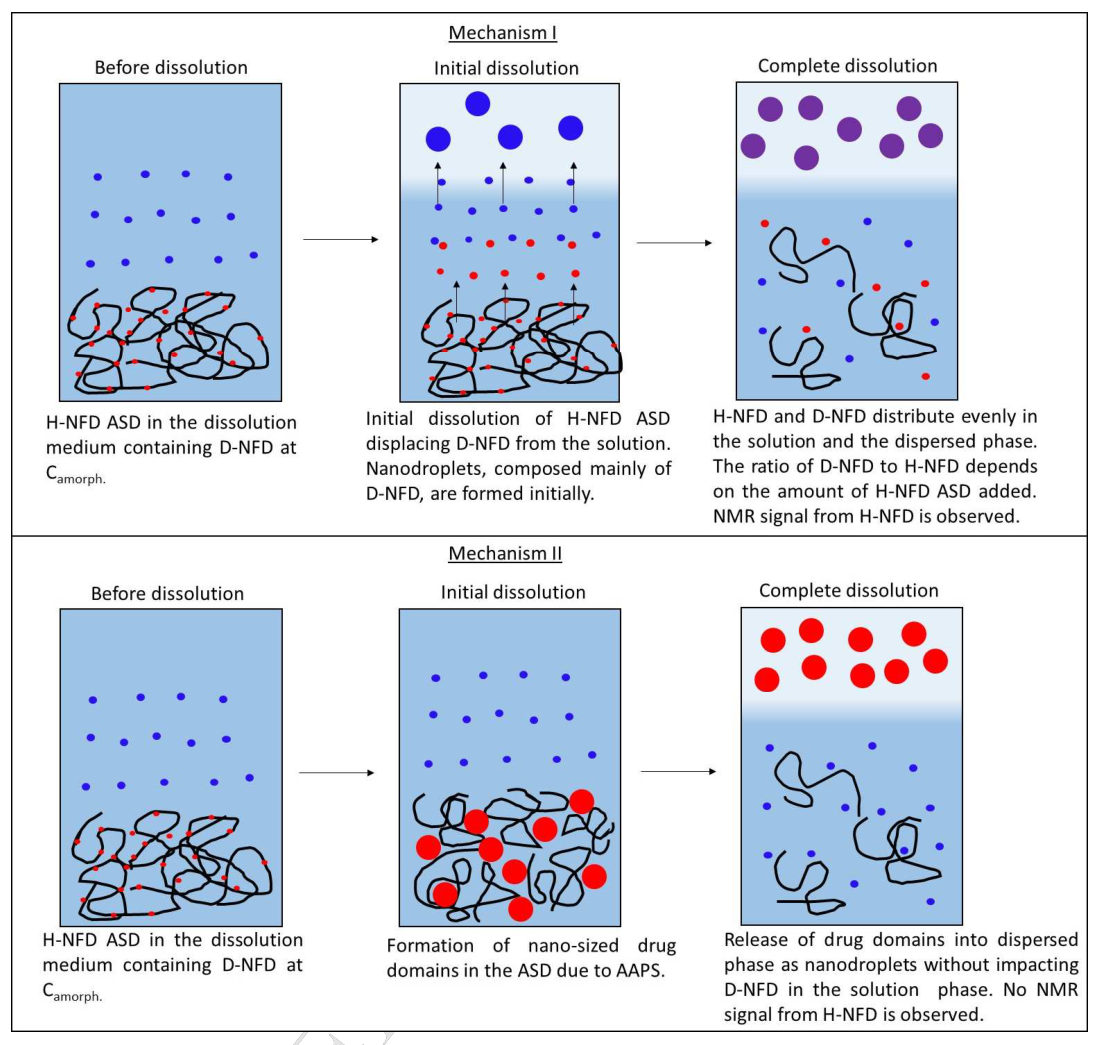
For a drug-controlled surface with C_s = C_{amorph} = C_b the dissolution equation of a single solid gives no driving force, so the authors read continued release into a saturated medium as polymer control ("clearly indicate"; "confirming") and zero release as a drug-rich surface indulkar2017b E4, E5, C35; indulkar2019a C43, C42. (synthesis: the drug concentration alone cannot separate the regimes, because a slow polymer-controlled dispersion and a drug-controlled one can give similar drug curves; only the polymer curve or the saturated-medium test shows which component sets the rate.)
Limits and transfer
How the medium was presaturated is not stated indulkar2019a X8, and the later papers differ in limit criterion, so their limits compare only to the loading step saboo2020 P5; que2021 P9; yang2021 P17; hiew2022b P8, X6. Press compacts of the dispersion, the neat polymer and the neat amorphous drug into the same die, compare normalized rates by a statistical test, and rerun the lowest and the target loading in presaturated medium for at least 30–60 min saboo2019 P10, P20; indulkar2019a R12, C43; saboo2020 R8.
How it was shown
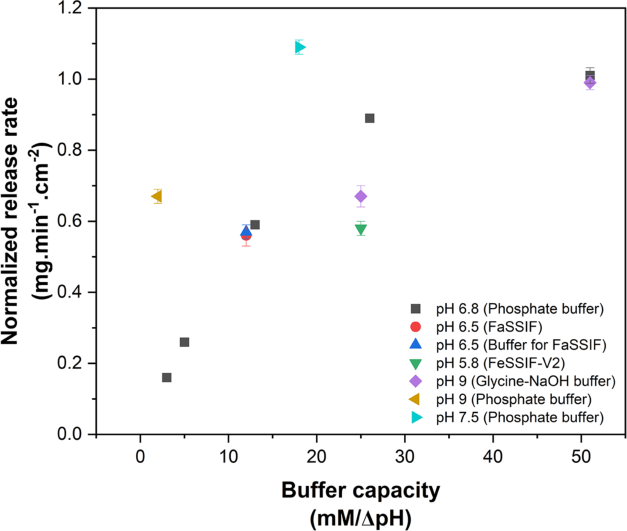
Indulkar and co-workers (2017) asked whether nifedipine dispersions dissolve by a drug- or a polymer-controlled route; they dissolved 10 and 20% dispersions with HPMC-E5 or PVPVA (150–250 µm) at 5 °C in 20 mL D2O at 300 rpm, once into plain D2O to 220 µg/mL drug and once into D2O presaturated with nifedipine at 110 µg/mL plus a further 110 µg/mL from the dispersion, following the drug by UV at 360 nm indulkar2017b P1, P7. Purohit and Taylor (2017) dissolved ritonavir films cast on vial walls in 18 mL of 100 mM pH 6.8 phosphate at 25 °C, followed the drug by UV (240 nm minus 400 nm) and the polymer by colorimetry of 1 µm-filtered aliquots (phenol–sulfuric acid for HPMCAS, potassium triiodide for PVP and PVPVA), and measured the free drug after ultracentrifugation; the film area was not controlled purohit2017b P14, P16, P19, P20. Bhardwaj and co-workers (2018) pressed 25 ± 5 mg of itraconazole (ITZ)–PVPVA at 500 psi in an 8 mm die, backed it with ethyl cellulose pressed at 1000 psi and sealed it with a silicone septum so that one face of about 0.50 cm² dissolved, in 70 mL 0.1 N HCl at 37 °C and 300 rpm; ITZ was read at 253 nm and PVPVA from the residual absorbance at 220 nm (quadratic calibration), n = 3, and rates were the 0–20 min slopes bhardwaj2018 P6, P7, E7. They expressed the ITZ rate relative to crystalline ITZ and divided both rates by the component's weight fraction bhardwaj2018 E2, E4. Indulkar and co-workers (2019) used Wood's apparatus with 100 mg compressed at 1600 lbs in an 8 mm die, rotated at 100 rpm in 100 mL 50 mM pH 6.8 phosphate at 37 °C, assayed unfiltered samples for ritonavir (HPLC, 210 nm) and PVPVA (size-exclusion chromatography, 205 nm), ran neat amorphous ritonavir and neat PVPVA tablets, and repeated the 10, 30 and 50% tablets in buffer presaturated with ritonavir at about 30 µg/mL indulkar2019a P2, P3, P4, P5. Que and co-workers (2019) used the same set-up at 1500 psi, mixing each drug sample with ethanol to dissolve drug-rich colloids and filtering the polymer sample through 0.2 µm, with a 250 mg neat PVPVA compact que2019 P3, P4, X13. Saboo and co-workers (2019) used 100 mg at 1500 psi in 100 mL 100 mM pH 6.8 phosphate at 100 rpm, took rates from the initial linear part of percent release normalized to each component's content, compared drug and polymer rates by t-test, and added powder dissolution at a nominal 100 µg/mL saboo2019 P9, P10, E4, P20, P19. Saboo and co-workers (2020) wrote the rate as A = kV/(SN) and assayed HPMC and HPMCAS by HPLC with evaporative light scattering and PVP, PVPVA and Eudragit S 100 (EUDS) by size-exclusion chromatography, with EUDS at pH 7.4 saboo2020a E3, P6, P7. The papers of 2020–2022 kept the 100 mg, 0.5 cm² compact but varied the read-out: Saboo and co-workers (2020) took rates from samples every minute over the first 5 min, each drug in its own medium saboo2020 P5, X5; Que and co-workers (2021) defined the limit as the last loading with simultaneous release and at least 80% of the drug in 90 min que2021 P9; Yang and co-workers (2021) compared drug and polymer rates by t-test at each loading and also dissolved powders, the PVPVA powders in medium holding 400 µg/mL HPMCAS yang2021 P17, P12, X18; Correa Soto and co-workers (2022) normalized by R = k/(Sx) without the medium volume and sampled to 120 min correasoto2022a E1, P11; and Hiew and Taylor (2022) dissolved into 250 mL and read the limit from drug release alone, without a stated criterion hiew2022b P8, X6. Indulkar and co-workers (2022) kept the 100 mg Wood's set-up with unfiltered samples so that drug held in colloids was counted, and set early PVPVA release of ternary tablets against a binary tablet reprinted from the 2019 paper, in amounts not normalized to the polymer content indulkar2022 P3, C7, P2, X6. Yang and co-workers (2022) printed the normalized rate as R = kV/(Ax) but reported only percent-release profiles, so no normalized rates are available from that paper yang2022a E1, X12. Bapat and co-workers (2023) kept the 100 mg, 0.5 cm² compact at 100 rpm and 37 °C but varied the medium (phosphate pH 6.8 at 3–51 mM/ΔpH buffer capacity, FaSSIF, FeSSIF, glycine and pH 7.5 and 9.0 buffers), assayed HPMCAS by HPLC with evaporative light scattering calibrated in each medium, and took rates from the initial linear part of each curve by R = kV/(Sx) bapat2023 P7, P8, P14, E1. Deac and co-workers (2023) added the drug content of the gel scraped from the compact at 10, 20 and 30 min, which they consider a more sensitive test of congruency than separate release rates because the drug gathers in the gel while release is incongruent (F25) deac2023a P4, C13, R3; their percent release is calculated on a 100 mg basis for compacts of 100–200 mg deac2023a X9.
What the data show
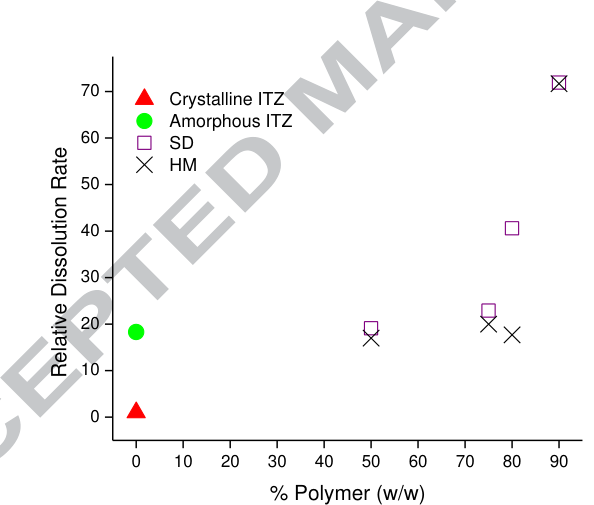
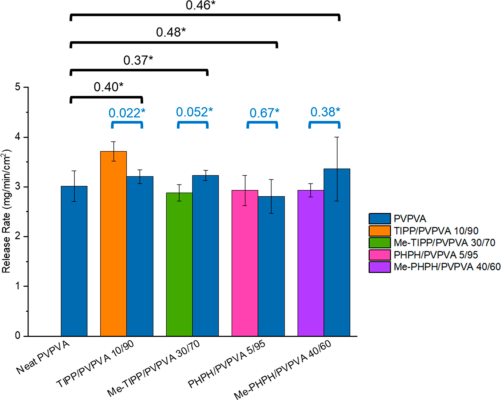
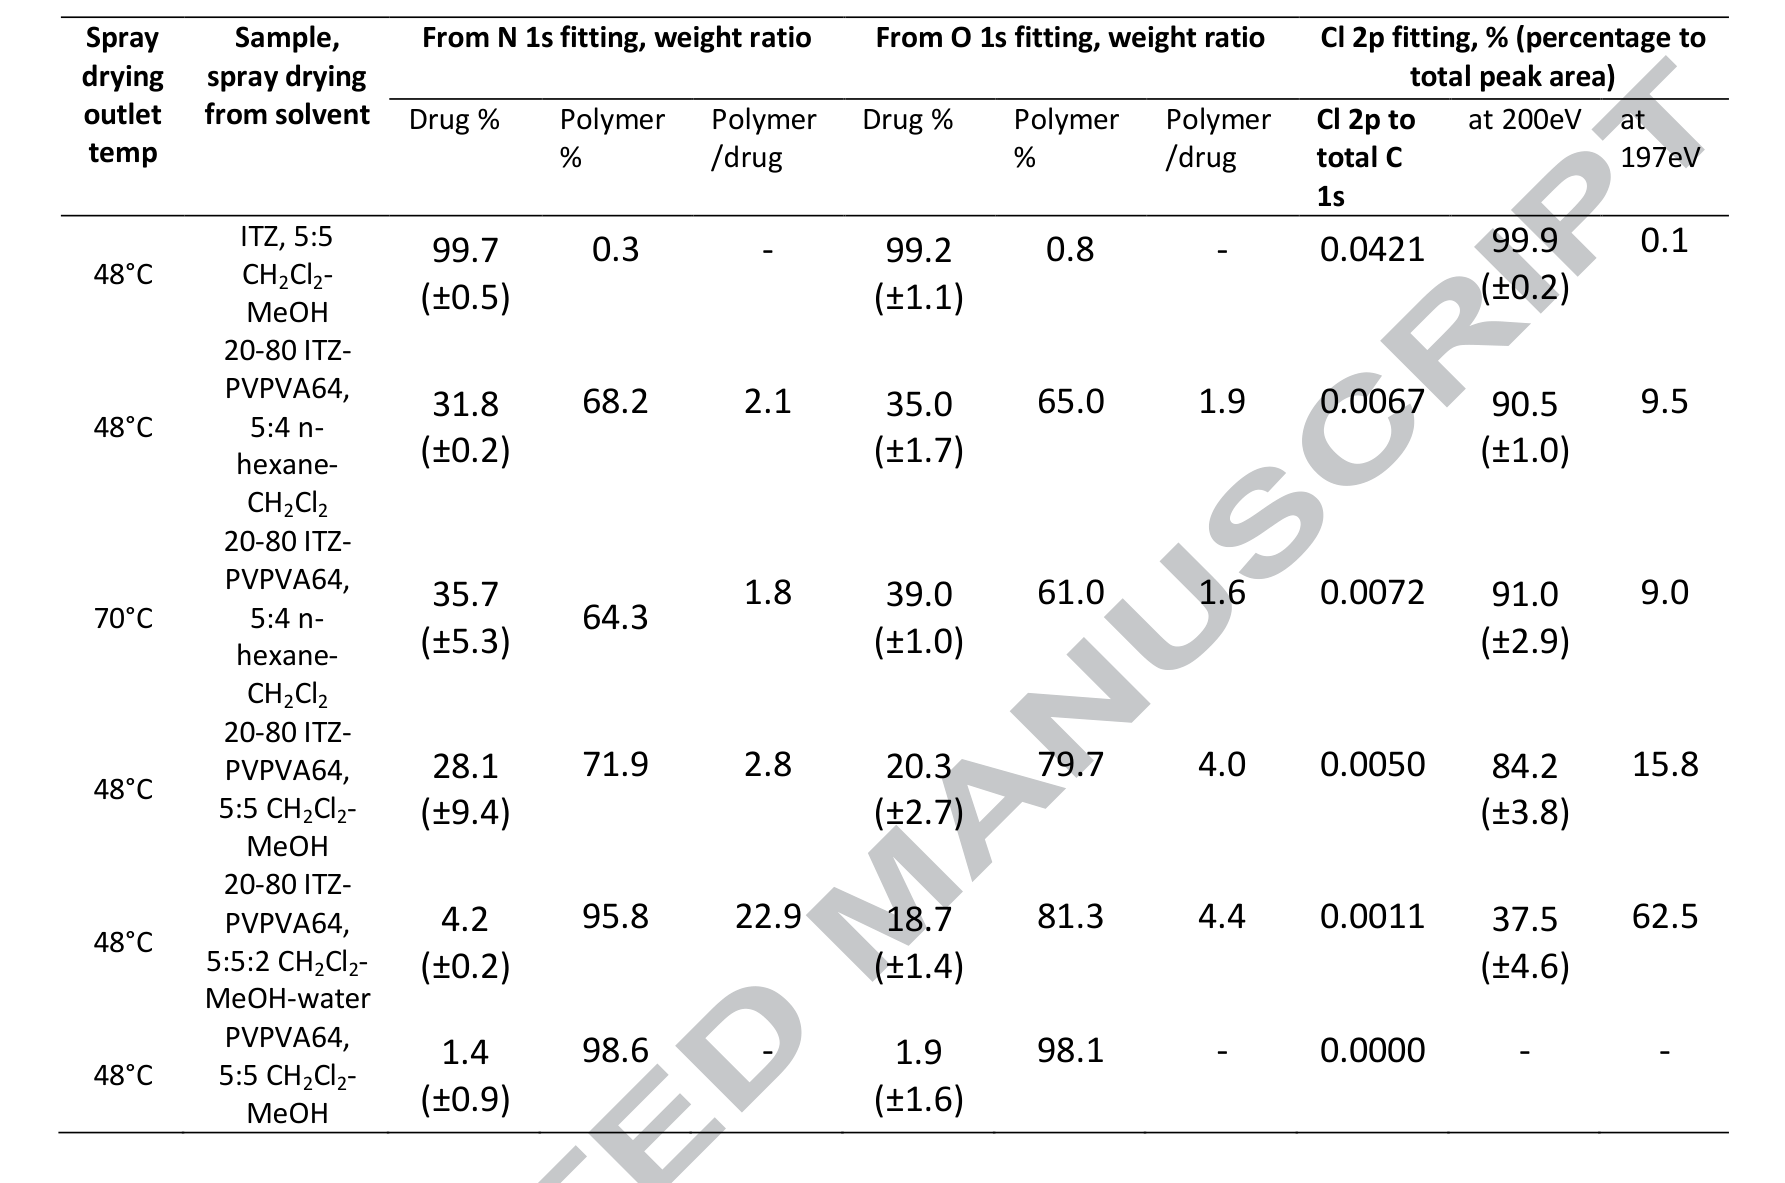
The neat references set the scale on which every dispersion is read. Melt-quenched ITZ dissolved at 51 ± 2 and crystalline ITZ at 2.8 ± 0.2 µg/min/cm², a ratio of about 18 that the authors equate with the amorphous-to-crystalline solubility ratio, which they did not measure bhardwaj2018 R4, R5, C45. Neat PVPVA dissolved at 10.4 mg/min/cm² in 0.1 N HCl at 300 rpm, 3.49 mg/min/cm² in pH 6.8 phosphate at 100 rpm, and ≈3.4 in the 2020 paper, where an extractor check of the plotted curve gives ≈1.7 bhardwaj2018 R9; saboo2019 R5; saboo2020a R13, X10 (synthesis: the three values come from different media, paddle speeds and compact masses and are not comparable). Amorphous nilvadipine dissolved at 0.002 mg/min/cm² and amorphous felodipine at ≈0.0008, neat amorphous ritonavir released essentially nothing in 120 min, and neat amorphous ledipasvir nothing detectable in 2 h saboo2019 R5; saboo2020a R13; indulkar2019a R1; que2019 R2. Against these, normalized drug and polymer rates of congruent dispersions were statistically equal (for example 2.13 against 2.35 mg/min/cm² for 10% nilvadipine, "ns"), and those of incongruent ones differed at p ≤ 0.001 to 0.0001 saboo2019 R5, R8. In ritonavir-saturated medium the 10% tablet released ≈90% by 30 min against ≈99.5% in plain buffer, the 30% tablet ≈40.5% by 120 min against ≈29.5%, and the 50% tablet 0 at every point up to 50 min against ≈0.44% in plain buffer indulkar2019a R12. Nifedipine dispersions in medium already at 110 µg/mL rose to ≈201 (10% HPMC-E5) and ≈211 µg/mL (10% PVPVA) within 5 and 1 min, and to ≈214–218 µg/mL at 60 min indulkar2017b R8, R9. Powders behaved like compacts: nilvadipine powders reached ≈89–91 µg/mL at 5–10% and ≈13.5–15 µg/mL at 15–20%, cilnidipine ≈96–99 up to 15% and ≈0.65–1.33 µg/mL at 20–25% saboo2019 R20, R21; ritonavir powders formed LLPS for the same combinations as films (data not shown) purohit2017b R19. In the papers of 2020–2022 the read-outs agreed where both were taken: at the limits of four phenolphthalein analogues drug and polymer rates differed with p = 0.022–0.67, and powders of six drugs showed the same cliff as compacts que2021 R21; yang2021 C41. The 5-min read-out of indomethacin methyl ester gave a limit of at least 25%, but over 30 min the ester released congruently only at 5% because crystals formed on the surface (F19) saboo2020 C14, R8.
| paper | system | method and conditions | result | ids |
|---|---|---|---|---|
| bhardwaj2018 | crystalline and melt-quenched ITZ; PVPVA | 0.5 cm² compacts, 0.1 N HCl, 37 °C, 300 rpm | 2.8 and 51 µg/min/cm² (ratio ≈18); PVPVA 10.4 mg/min/cm² | bhardwaj2018 R4, R5, R9 |
| saboo2019 | PVPVA, amorphous nilvadipine | Wood's, pH 6.8, 100 rpm | 3.49 and 0.002 mg/min/cm² (≈1700-fold) | saboo2019 R5, R7 |
| saboo2020a | five polymers, amorphous felodipine | same; EUDS pH 7.4 | polymers ≈0.23–3.6; felodipine ≈0.0008 (290–4600-fold) | saboo2020a R13 |
| saboo2019 | Nil and Cil in PVPVA | normalized rates, t-test | drug = polymer (ns) up to 10% and 15%; p ≤ 0.001 above | saboo2019 R8 |
| indulkar2019a | ritonavir–PVPVA 10, 30, 50% | plain against presaturated buffer, 37 °C | 10% unchanged; 30% still releasing; 50% zero | indulkar2019a R12, R13 |
| indulkar2017b | nifedipine HPMC-E5 and PVPVA 10, 20% | D2O presaturated at 110 µg/mL, 5 °C | release continued to ≈214–218 µg/mL | indulkar2017b R8, R9 |
| saboo2019 | Nil and Cil powders | 100 µg/mL nominal, 300 rpm | same cliff as compacts | saboo2019 R20, R21 |
| purohit2017b | ritonavir powders | 100 mL buffer | same LLPS combinations as films (not shown) | purohit2017b R19 |
| saboo2020 | IND, INDester–PVPVA | 5-min rates against 30-min profiles | INDester limit ≥25% by 5-min rates, congruent over 30 min only at 5% | saboo2020 C14, R8 |
| que2021 | four analogues | limit = congruent and ≥80% in 90 min; t-test at 99% | drug against polymer p = 0.022–0.67 at the limits | que2021 P9, R21 |
| yang2021 | six drugs, PVPVA and HPMCAS | powders (PVPVA media with 400 µg/mL HPMCAS) and compacts | same cliff in powders and compacts | yang2021 P12, C41, X18 |
| hiew2022b | lumefantrine forms | drug release only, 250 mL | limit read without a stated criterion | hiew2022b P8, X6 |
| li2020 (ASD process) | spray-dried ritonavir–PVPVA | drug rate normalized by area and DL only | polymer not assayed in the rate | li2020 E13 |
| benson2025 (ASD process) | coated ritonavir–PVPVA tablets | drug only | congruency not measured | benson2025 X18 |
Figure
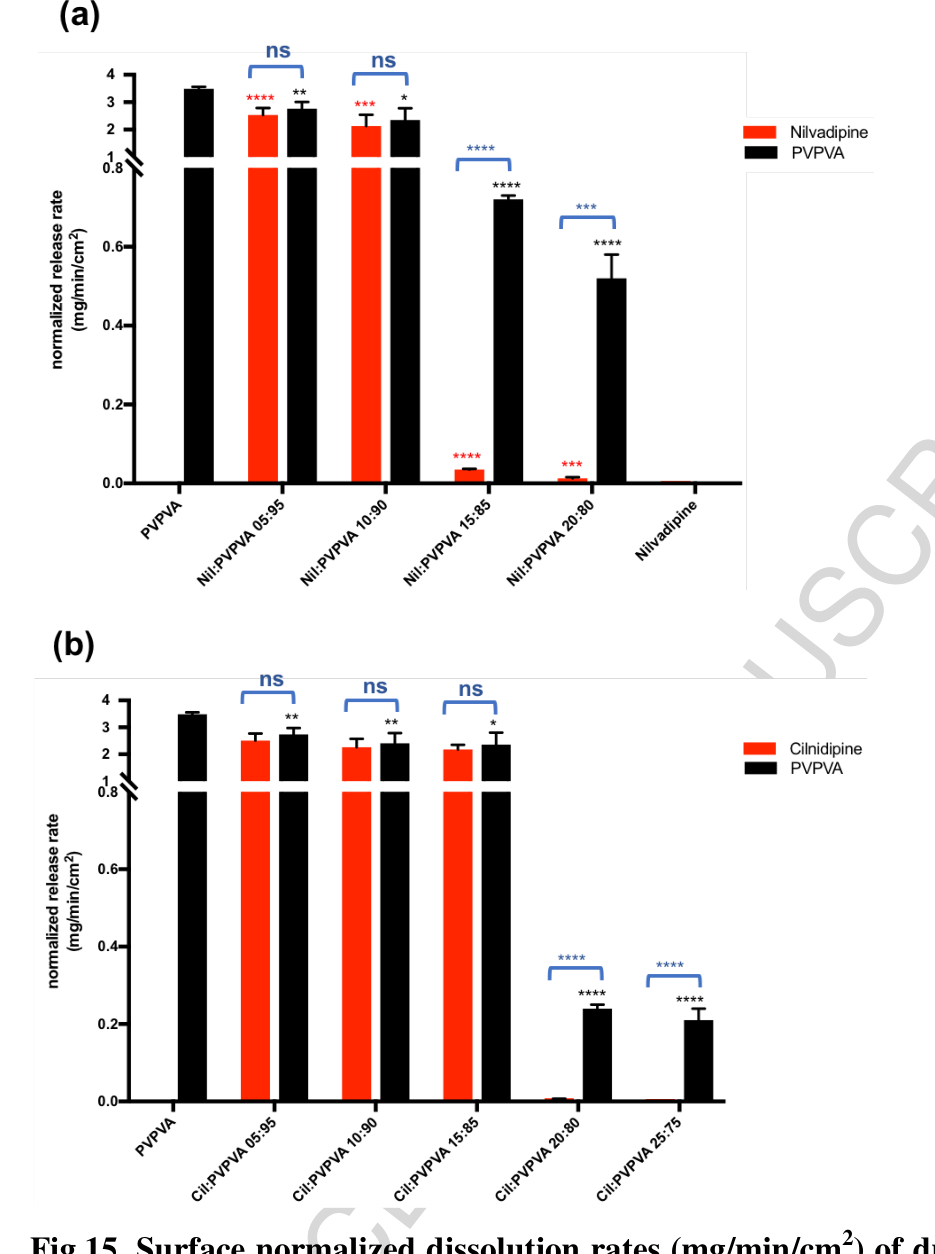
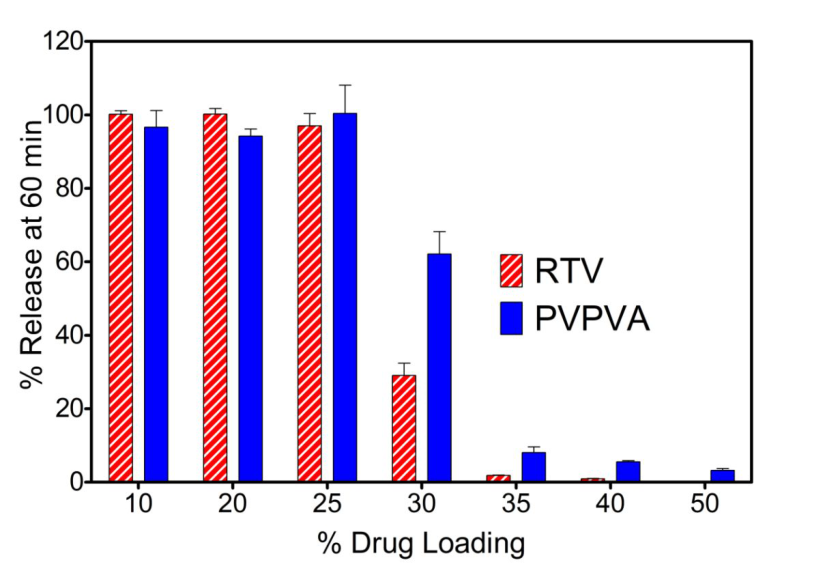
Red (drug) and black (PVPVA) bars stand together and are marked "ns" up to 10% nilvadipine and 15% cilnidipine; one 5% step higher the drug bar collapses below the break of the y-axis while the polymer bar remains saboo2019 R8, R5, R6.
The 10% curves overlap in both media, while the 50% tablet (inset) shows a small rise in plain buffer and none in saturated buffer indulkar2019a R12.
Why
The presaturated-medium test rests on the dissolution equation of a single solid,
\frac{dm}{dt} = A\,\frac{D}{h}\,\left(C_s - C_b\right)
indulkar2017b E4, which for a drug-controlled surface with C_s = C_{amorph} = C_b gives no driving force indulkar2017b E5. The authors therefore read continued release into a saturated medium as polymer control ("clearly indicate"; "confirming") and zero release as a drug-rich surface "in agreement with" the Nernst–Brunner form dC/dt = (DA/Vh)(C_s - C) indulkar2017b C35; indulkar2019a C43, C42, E2. For the polymer-controlled case they write the drug rate as the polymer rate times the mass ratio, (dC/dt)_{drug} = (dC/dt)_{polymer}\, m_{drug}/m_{polymer}; at 10% ritonavir and 20 min, ≈67 mg PVPVA × 10/90 gives ≈7.4 mg against ≈7.6 mg ritonavir read from the plot indulkar2019a E3, R1, R2. Normalized by weight fraction, the same relation predicts equal drug and polymer rates, which is how congruency is read in the 2020 paper saboo2020a E2, E3. The constant face removes the particle-size and disintegration effects of powders (the authors' stated reason), although packed particle layers present a renewed surface during dissolution indulkar2019a C15; bhardwaj2018 C47, C64. Reading the amorphous-to-crystalline IDR ratio as a solubility ratio is carried over from polymorphs ("should be the same") bhardwaj2018 E3, C45. (synthesis: the drug concentration alone cannot separate the regimes, because a slow polymer-controlled dispersion and a drug-controlled one can give similar drug curves; only the polymer curve or the saturated-medium test shows which component sets the rate.)
Conditions and limits
Compacts of 25–100 mg at 37 °C in 0.1 N HCl (ITZ), 50 or 100 mM pH 6.8 phosphate, or pH 7.4 for EUDS; ritonavir films at 25 °C; nifedipine at 5 °C bhardwaj2018 P7; indulkar2019a P2; saboo2019 P9; saboo2020a X8; purohit2017b P14; indulkar2017b P7. The weight-fraction normalization assumes similar component densities saboo2020a C8. How the medium was presaturated, and whether the starting concentration was subtracted, is not stated indulkar2019a X8; the two nifedipine media received different amounts of dispersion indulkar2017b X10. Some percent releases exceed 100% without a stated basis indulkar2019a X12. The neat PVPVA compact of the ledipasvir study weighed 250 mg against 100 mg for the dispersions, and the compact mass of the neat polymers of the 2020 study is not stated que2019 X13; saboo2020a X10. High-loading HPMCAS and EUDS rates are slopes after a lag saboo2020a X9. In the ritonavir films polymer release was measured only at 10:90 and 50:50 purohit2017b X12. The later papers differ in medium volume, sampling window and limit criterion (5-min rates, at least 80% in 90 min, t-test of rates, drug release alone), so their limits compare only to the loading step saboo2020 P5; que2021 P9; yang2021 P17; hiew2022b P8, X6. In the 2022 ritonavir surfactant paper the axis of the early polymer-release plot is labelled mg/mL but the values behave as milligrams released per vessel indulkar2022 X5. From 2024 the PVP molecular-weight paper counted release as congruent when more than 80% of both components left and took the limit as the highest loading passing 80% of the drug, over 90–120 min, and the bedaquiline paper of 2025 dispersed powders without assaying the polymer deac2024a C36, X6; kaur2025 P11, X14.
Counterexamples and conflicts
None found against the test itself. Papers that measured only the drug inferred the regime: the spray-dried ritonavir study normalized the drug rate by area and loading only, a coated-tablet study did not measure PVPVA, and a fluorescence study read the regime from whether the amorphous solubility was reached li2020 E13; benson2025 X18; tres2018 X10. A congruency test over the first 5 min missed the later failure of a fast crystallizer (F19) saboo2020 X7.
Transfer check
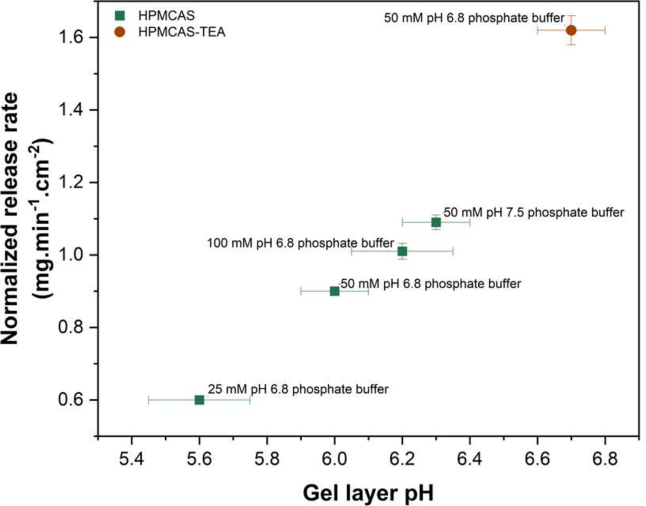
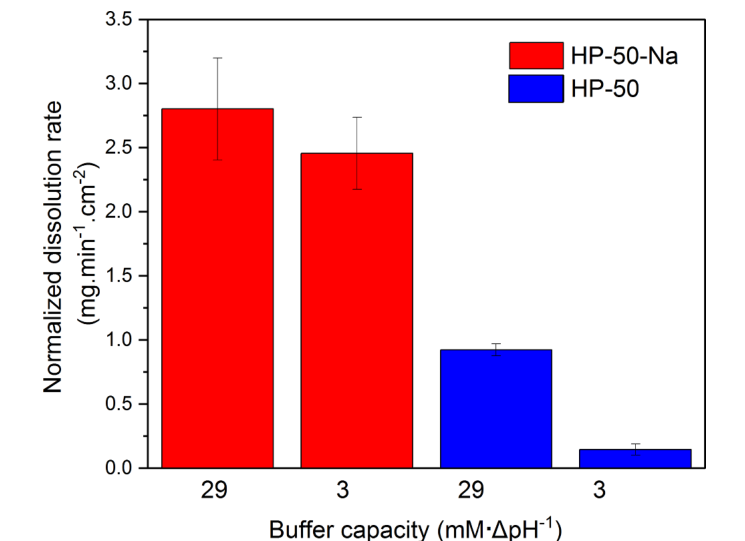
Press compacts of the target dispersion and of the neat polymer and the neat amorphous drug of the same mass into the same die, assay the polymer in the same samples (size-exclusion chromatography, light-scattering detection or colorimetry), and compare normalized rates by a statistical test saboo2019 P10, P20; saboo2020a P7. Run the lowest and the target loading once more in medium presaturated at the amorphous solubility: release that continues is polymer-controlled, release that stops is drug-controlled indulkar2019a R12, C43, C42. Near an expected switch use loading steps finer than 5%, since every limit reported here is a bracket saboo2020a X11; indulkar2019a X7. Run the test for at least 30–60 min, since 5-min rates missed surface crystallization saboo2020 R8. For an enteric polymer, record the buffer capacity of the medium beside its pH, since the HPMCAS rate changed about sixfold between 3 and 51 mM/ΔpH at pH 6.8 (F23) bapat2023 R5. Scrape and assay the gel layer at 10–30 min: a rising drug content of the gel marks incongruent release even while percent release still matches the neat polymer deac2023a R3, C13.
History
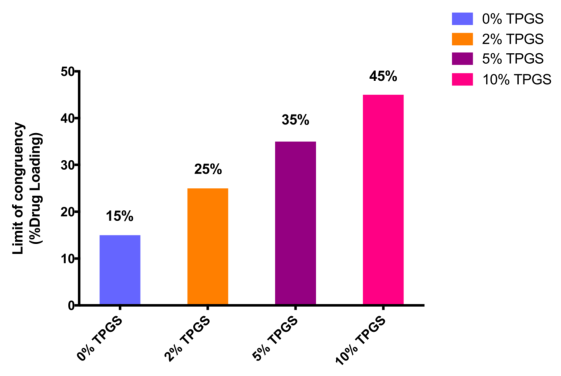
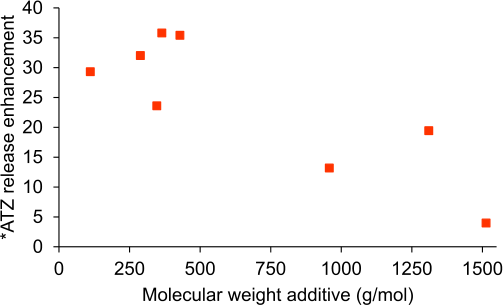
Compacts of sulfathiazole–PVP had shown crystalline-drug-, amorphous-drug- and polymer-controlled regimes as loading fell (Simonelli 1969, cited), and normalized ketoconazole release had tracked polymer release at 20% loading (Chen 2016, cited) bhardwaj2018 R22, R23. In the library Indulkar and co-workers (2017) first used a drug-saturated medium to show polymer control, and Purohit and Taylor (2017) first assayed drug and polymer together, on films indulkar2017b C35; purohit2017b C52. Bhardwaj and co-workers (2018) introduced the constant-area compact with both components and loading-normalized rates bhardwaj2018 C65. Indulkar and co-workers (2019) combined both components, neat references and the presaturated medium in Wood's apparatus indulkar2019a C15, C16; Saboo and co-workers (2019) took over the surface-normalized method (builds_on) and added t-tests and powders, and Que and co-workers (2019) and Saboo and co-workers (2020) carried it to ledipasvir and to five polymers saboo2019 R8; que2019 P3; saboo2020a E3. The papers of 2020–2022 kept the method for indomethacin and its ester, four phenolphthalein analogues, felodipine with TPGS, loratadine at two temperatures, clopidogrel, atazanavir and lumefantrine salts, and added powder release of six drugs saboo2020 P5; que2021 P9; saboo2021 P6; yang2021 P15, P12; correasoto2022a P11; correasoto2022b P5; hiew2022b P8. The HPMCAS papers of 2024–2025 kept the constant-area compact with drug and polymer assayed for eight drugs and three grades, while the bedaquiline study of 2025 used powders and drug assay only (F32, F33, F34) bapat2024 P7; bapat2025a P6; kaur2025 P11.