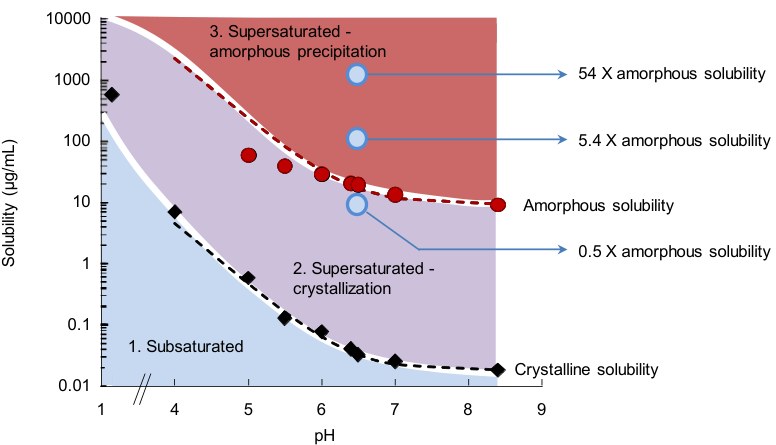
| C F10 | D F1 | extends | Five weak bases left a non-birefringent precipitate with a Tg of 28–56 °C after a pH rise hsieh2012 R1, R5, R10; for three such bases (clotrimazole, atazanavir, nicardipine) the total LLPS concentration rose 30- to 65-fold with ionization while the un-ionized part stayed near 5.6–8.4, 57–70 and 4.5–6.8 µg/mL indulkar2015 R18, R5, R6, R7, R9, F2. |
| C F23 | D F1 | extends | The two outcomes of a pH shift, crystals that end supersaturation within minutes or an amorphous solid that holds a plateau hsieh2012 R1, R5, R10, were placed on the dose: pazopanib above its amorphous solubility at pH 6.5 formed glassy colloids with a capped free drug, and at about 0.5 times it formed no colloids and could only crystallize sugihara2018 R8, R11, R12, R15, R20. |
| C F23 | D F16 | extends | After a pH shift chemically diverse polymers kept glyburide and warfarin precipitates amorphous for at least 6 h but none stopped papaverine or dipyridamole crystallizing hsieh2014 R4, R12; for pazopanib the outcome was set by the dose relative to the amorphous solubility at the intestinal pH, and HPMC set how long supersaturation lasted sugihara2018 R8, R20, R22. |
| D F2 | C F5 | same mechanism | The supernatants of four type 2 bases after a pH rise (5.09, 157, 76.5 and 11.3 µg/mL) lay near Hoffman estimates of the amorphous solubility hsieh2012 R10, as solvent-shift onsets of 17 compounds lay mostly at 0.91–1.15 times the prediction C_{amorphous} = C_{eq}\,e^{-I(a_2)}\,e^{\Delta G/RT} ilevbare2013a R8; almeidaesousa2015 R5, R11; indulkar2015 R2; mosqueragiraldo2015 R13; in both chapters the best-fitting estimate changes with the compound. |
| D F2 | C F6 | extends | Warfarin held 103–224 µg/mL, 13–25 times its polymer-specific solubility, against a Hoffman ratio of about 48 hsieh2014 R4, R16, inside the range of maximum supersaturations, about 2 to 600, that the amorphous-solubility chapter measured and called "highly compound dependent" almeidaesousa2015 R5, C23; sugihara2018 R4. |
| D F2 | C F10 | builds on | The plateaus of the type 2 bases and the measured amorphous solubility of posaconazole at pH 7.0 (9.08 µg/mL) are values for drugs that are largely un-ionized in the test hsieh2012 R10; duong2022b R6, R7; for weak bases the limit is set by the un-ionized drug and the total rises with ionization indulkar2015 R18, F2 (synthesis). |
| D F2 | C F13 | same mechanism | Dissolved amorphous ritonavir reached 19.8 of a calculated 20.6 µg/mL, efavirenz 12.3 of 19.8 and celecoxib only 2.5 of 22.6 ilevbare2013c R2; amorphous films of three weak bases reached 69–110% of the LLPS concentration indulkar2015 R18, F6; in both, a dissolving amorphous solid reaches the limit only when crystallization is slow enough. |
| D F3 | C F3 | same mechanism | Started at their calculated amorphous solubility without polymer, celecoxib, efavirenz and ritonavir crystallized after about 2.4, 5.1 and 120 min ilevbare2013c R8, R9.a, the drug-dependent lifetime, from minutes to hours, of the drug-rich phase in the LLPS chapter ilevbare2013a R8, R11, R12; mosqueragiraldo2015 R1; almeidaesousa2015 R1, R4. |
| D F4 | C F1 | builds on | Danazol separated a noncrystalline drug-rich phase seen by UV extinction and the pyrene ratio jackson2014 R5.a, R8, R6, the same read-outs and the same phase as in the 21 compounds of the amorphous-solubility chapter ilevbare2013a C2, R8; almeidaesousa2015 C41. |
| D F4 | C F3 | same mechanism | Without polymer the danazol drug-rich phase gave crystals within 6–10 min by three read-outs jackson2014 R13, R17.a–c, like telaprevir (birefringent particles after about 15 min) and the six fast crystallizers that turned turbid "only a few minutes" before particles appeared mosqueragiraldo2015 R1; almeidaesousa2015 R1. |
| D F4 | C F4 | conditions differ | The danazol onset moved from 13 to about 8 µg/mL when it was read 1 or 5 min instead of 15 s after the addition jackson2016 R8, R13, a reading-time effect not considered in the agreement of onset methods within a few µg/mL for ritonavir, telaprevir, lopinavir and paclitaxel ilevbare2013a R8, R4, R6; mosqueragiraldo2015 R13; trasi2015a R1. |
| D F9 | C F6 | builds on | Growth inhibition by CAP Adp 0.85 fell from 6.4-fold at S 3.8 to 1.6-fold at S 15.3, the calculated amorphous solubility ilevbare2012b R5; the supersaturation at which a polymer must act is the drug's maximum supersaturation, which ranges from about 2 to about 600 almeidaesousa2015 R5, C23; sugihara2018 R4 (synthesis). |
| D F14 | C F14 | same mechanism | HPMC lengthened celecoxib's induction time 31-fold at S 7.3 against about 5-fold at S 14.7 ilevbare2013c R15, R9.a, R9.j, R16, and for pazopanib after a pH shift the time supersaturation lasted rose from 5 ± 2 to about 39 min with 50 µg/mL HPMC sugihara2018 R22; in both, a dissolved polymer buys time that depends on the supersaturation reached. |
| D F15 | C F19 | conditions differ | For danazol three polymers at 1–1000 µg/mL left the onset at about 8 µg/mL jackson2016 R8, R17, whereas HPMC and PVP-VA at 300 µg/mL lowered the amorphous solubility of ibuprofen from 177.1 to about 91–97 µg/mL by entering its drug-rich phase ueda2020b R1; whether a polymer lowers the onset depends on the drug–polymer pair. |
| D F15 | C F20 | conditions differ | The enzalutamide and posaconazole droplets held HPMCAS and changed size and charge with the polymer wilson2021 R13, R14; shah2025 R11, R15, and the share of polymer in the ibuprofen drug-rich phase ranged from about 0.40 to 1.14 by weight with grade and chemistry ueda2021 R5; the danazol onset did not move with polymer jackson2016 R8. |
| D F15 | C F22 | same mechanism | HPMC and HPMC-AS kept danazol droplets at about 230–345 nm for 2–4 h instead of about 9800 nm in 1 h jackson2014 R22, R23, and HPMC and PVP-VA gave ibuprofen droplets of 268–345 nm against 3182–5313 nm in buffer ueda2020b R5, R6. |
| D F19 | C F8 | builds on | Supersaturation has to be referred to solubilities measured in the same medium hsieh2014 R4; chen2015 R1, because above the limit the free concentration, activity and flux stop rising and extra drug only adds drug-rich phase mosqueragiraldo2015 R10, R12; trasi2015a R2, R1. |
| D F19 | C F11 | same mechanism | Taurocholate lowered the amorphous solubility of atazanavir from 65 to 38 µg/mL indulkar2018 R6, and the bile salts STCDC and SGCDC lowered the maximum flux of telaprevir, read as components that mix into the drug-rich phase like a second drug lu2017b R13, R18, C31, X6; trasi2015a R7. |
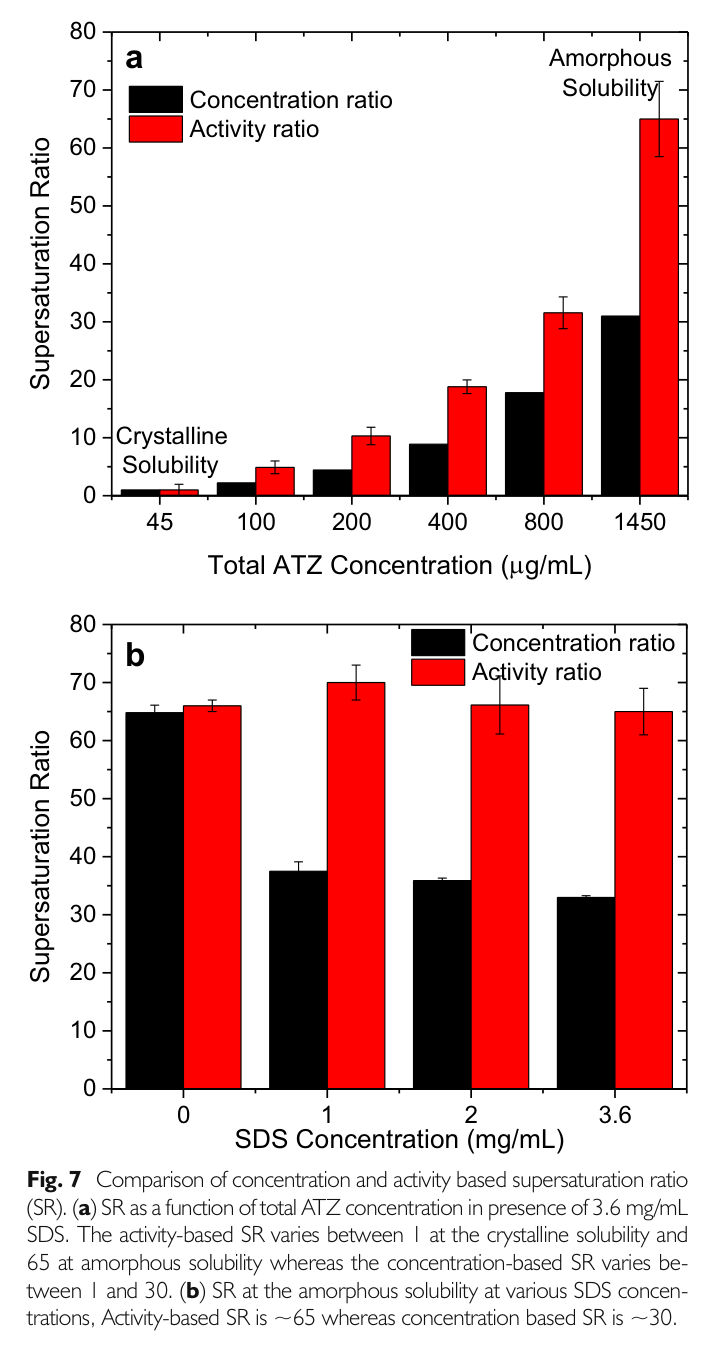
| D F19 | C F18 | builds on | FaSSIF and FeSSIF raised both posaconazole limits while the concentration ratio fell from about 34 to about 20 duong2022b R8; in SDS the amorphous solubility of atazanavir rose only half as much as predicted from the crystal because the micelle/water partition coefficient falls with drug concentration indulkar2017a R9, R14. |
| D F19 | C F19 | same mechanism | Polymers that entered enzalutamide droplets lowered the dissolved drug from 42 to about 20–37 µg/mL wilson2021 R8, as HPMC and PVP-VA lowered the amorphous solubility of ibuprofen without changing its crystalline solubility ueda2020b R1. |
| D F20 | C F14 | extends | A dissolved polymer holds a crystal-free solution for hours but not one seeded with crystals (felodipine with HPMC: about 5.0 against 2.2 µg/mL) alonzo2012 R18, which bounds the time a polymer buys for dissolving solid forms, where HPMC raised the CRH1 maxima from 2.9–5.4 to 6.2–12.1 µg/mL almeidaesousa2016 R8, R9. |
| D F21 | C F3 | extends | Six dihydropyridine precipitates from a 10 mg/mL solvent shift stayed amorphous for 0.25 to 12 h raina2015b R6, R7, R8, a range of lifetimes for the drug-rich phase beside the minutes of telaprevir and griseofulvin without polymer mosqueragiraldo2015 R1; almeidaesousa2015 R1, R4. |
| D F22 | C F7 | builds on | The revised danazol onset of about 8 µg/mL matched a recalculated amorphous solubility of 7.8 µg/mL jackson2016 R8, R3, the comparison for which the heat-capacity free energy fitted better than the Hoffman equation for high-melting drugs almeidaesousa2015 R14, R15; mosqueragiraldo2015 R13. |
| D F22 | C F8 | same mechanism | The maximum membrane flux of danazol at 15 µg/mL did not fall with three polymers jackson2016 R8, R9, R3, R11, the same plateau of flux at the limit seen for telaprevir, ritonavir, lopinavir and paclitaxel mosqueragiraldo2015 R10, R12; trasi2015a R2, R1. |
| D F22 | C F19 | contradicts | Three polymers at 1–1000 µg/mL left the danazol onset at 7–9.1 µg/mL (all p > 0.3) jackson2016 R8, R9, whereas HPMC and PVP-VA at 300 µg/mL lowered the ibuprofen amorphous solubility by about 45–49% (177.1 → 96.9 and 90.7 µg/mL) ueda2020b R1; the two results differ by drug, polymer level and method and were not reconciled in either paper (synthesis). |
| D F25 | C F3 | builds on | The telaprevir nucleation screen was run at 150 µg/mL, above the glass–liquid phase separation at about 90–100 µg/mL mosqueragiraldo2016 R4, where without polymer the drug-rich phase gave birefringent particles after about 15 min mosqueragiraldo2015 R1. |
| D F26 | C F20 | builds on | PVPVA and HPMCAS were found in the felodipine precipitate and in the water, PAA almost only in the water raina2015b R12; the polymer:drug ratio in a drug-rich phase was later measured by NMR, about 0.40–1.14 for six polymers with ibuprofen ueda2021 R5. |
| D F28 | C F12 | builds on | Runs with STC and SDS were set at a fixed ratio of concentration to the crystalline solubility measured in the same medium chen2015 R1, C7, the scale on which a micellar solubilizer raises crystalline solubility and LLPS concentration together ilevbare2013a R16, C54. |
| D F28 | C F17 | conditions differ | At 0.1% sodium taurocholate lengthened the induction time of all 11 drugs chen2015 R3, C13, while for telaprevir the trihydroxy bile salts did little to either solubility and only STCDC and SGCDC lowered the maximum supersaturation lu2017b R1, R2, R13; the bile salt acts on nucleation without changing the thermodynamic limit. |
| D F29 | C F17 | same mechanism | The best bile salt for delaying crystallization depended on the drug and "not interchangeable" was the conclusion li2016a R6, C63, C69, the same words used for the thermodynamic effects of six bile salts on telaprevir lu2017b C56, C52. |
| D F31 | C F16 | builds on | The flux-based supersaturation at the amorphous solubility was 63–65 for atazanavir and 9.2–10 for ritonavir in buffer, FaSSIF-V1 and a six-bile-salt medium indulkar2018 R12, R8, the activity scale on which the micellar concentration ratio understates supersaturation about twofold indulkar2017a R11, R13. |
| D F31 | C F17 | builds on | The telaprevir nucleation runs at an activity-based supersaturation of 11.5 used the flux calibration of the bile-salt thermodynamics study, in which 12 mM dihydroxy salts doubled both solubilities lu2017 R1, R3; lu2017b R1, R2. |
| D F32 | C F3 | extends | At δ 28.8, just above the amorphous solubility, buffer crystallized at once and 1.86 mM bile salts held the drug-rich solution from about 30 to more than 960 min lu2017 R4, an inhibitor-dependent lifetime of the drug-rich phase like those of telaprevir with 5 µg/mL HPMCAS-MF mosqueragiraldo2015 R1. |
| D F32 | C F17 | builds on | At 12 mM STDC, SGDC and STCDC lost most of their delay (about 140, 125 and 180 min) lu2017 R3; these are the micellar dihydroxy bile salts that raised the telaprevir GLPS onset to 238–360 µg/mL lu2017b R1, R2. |
| D F33 | C F17 | conditions differ | Monomeric STCDC stopped growth on telaprevir seeds and held 60.5 of 65.2 µg/mL for 15 h lu2017a R7, R12, whereas in the thermodynamic study STCDC and SGCDC lowered the maximum flux to about 0.8–0.9 of buffer lu2017b R13, R18; the same bile salts inhibit growth and lower the ceiling. |
| D F34 | C F10 | builds on | The posaconazole induction times were run at S 5 to 33.6 in PBS pH 6.5 up to its amorphous limit duong2022b R10, a weak base whose limit is set by the un-ionized drug indulkar2015 R18, F2. |
| D F34 | C F18 | builds on | Intestinal media changed posaconazole nucleation in both directions duong2022b R11; in micellar media the partition coefficient of drug into micelles was later found much lower at the amorphous than at the crystalline solubility for atazanavir and posaconazole elkhabaz2019b C33; duong2022b C45. |
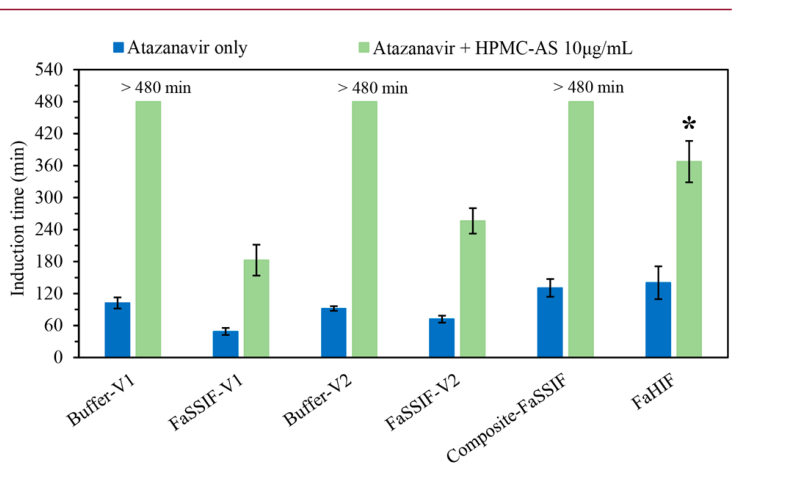
| D F35 | C F9 | explains | The polymer-free induction times of atazanavir differed about sixfold between buffers of different species and strength mosqueragiraldo2018a R1.b; enright2020 R2; buffer strength alone moved the ritonavir LLPS concentration from 37.2 to 4.7 µg/mL and the telaprevir onset from about 149 to 104 µg/mL ilevbare2013a R13; lu2017b R9, so the starting supersaturation changes with the buffer (synthesis). |
| D F37 | C F19 | builds on | Eudragit E PO and HPMCAS both lowered dissolved enzalutamide from 42 to about 20–37 µg/mL wilson2021 R7, R8, the lowering by polymers that enter the drug-rich phase first shown for ibuprofen ueda2020b R1, C33. |
| D F37 | C F20 | extends | The share of polymer in the droplets (about 41 w/w% Eudragit E PO against 13–25 w/w% HPMCAS; HPMCAS-H about 31 wt% in posaconazole droplets) did not rank the inhibitors wilson2021 R7, R3; shah2025 R17, R3, although it set how far each polymer lowered dissolved ibuprofen ueda2021 R5, R11. |
| D F38 | C F16 | builds on | The SDS nucleation series was run at an equal flux-based supersaturation of about 65 indulkar2019b R3, R1, R2, the activity scale on which the atazanavir concentration ratio fell to about 33 in SDS while the activity ratio stayed at about 65 indulkar2017a R11, R13. |
| D F38 | C F18 | builds on | Above the CMC the amorphous solubility and the dose rose from about 115 to 1480 µg/mL while the induction time stayed at about 52–68 min indulkar2019b R3, M2; the micellar solubilization of the amorphous drug is the one that rose only half as much as predicted indulkar2017a R9. |
| D F39 | C F11 | conditions differ | Lecithin and its digestion products shortened atazanavir induction times indulkar2018 R16, R19; enright2020 R6, R10; in the thermodynamic chapter a second component acts by mixing into the drug-rich phase and lowering the limit trasi2015a R7, R16, E4, a route not measured for the lipids. |
| D F39 | C F17 | conditions differ | Telaprevir crystallized in FaSSIF (about 21 min) as fast as in buffer although taurocholate alone held it beyond 960 min lu2018 R6, R4; the thermodynamic study had found STC, the bile salt of FaSSIF, to do little to telaprevir's solubilities lu2017b R1, C52. |
| D F40 | C F17 | extends | A six-bile-salt medium held atazanavir, ritonavir, tacrolimus and telaprevir about two- to more than fortyfold longer than FaSSIF indulkar2018 R20, R12; lu2018 R6, the kinetic side of the finding that STC "is not an adequate surrogate" for the human bile salts lu2017b C52, C56. |
| B F1 | C F13 | conditions differ | Amorphous films of three weak bases and a ritonavir film reached the LLPS concentration indulkar2015 R18, F6; ilevbare2013a R13, whereas neat amorphous felodipine at 37 °C was about 54% crystalline at the first reading and dissolved only to the crystal level alonzo2010 R2, R1; the limit is reached only by drugs whose wetted solid does not crystallize first. |
| B F1 | C F14 | same mechanism | The rates of crystallization in the wetted solid and in solution relative to dissolution "in large part shape" the concentration–time profile alonzo2010 C32, C47; for the solid forms of CRH1 reaching the limit was likewise decided by dissolution outrunning crystallization almeidaesousa2016 R8. |
| B F1 | D F2 | same mechanism | Neat amorphous felodipine and celecoxib crystallized in the slurry and dissolved no higher than the crystal alonzo2010 R2, R1; xie2015 R4, R8, R7, as dissolved amorphous celecoxib reached only 2.5 of a calculated 22.6 µg/mL while slowly crystallizing ritonavir reached 19.8 of 20.6 ilevbare2013c R2. |
| B F2 | C F14 | extends | Dissolved polymer bought time for wetted amorphous felodipine (50% crystallinity after 13.5–20.5 min instead of within 1 min) but not for nifedipine or celecoxib particles alonzo2010 R6, R5, R4, R3; raina2014b C11, R2; xie2015 R9, R10, whereas 20 µg/mL HPMC raised the maxima of every CRH1 form almeidaesousa2016 R9. |
| B F2 | D F2 | extends | Felodipine with dissolved PVP, HPMC or HPMC-AS peaked at 7.3–12.0 µg/mL against an estimated amorphous solubility of about 9 µg/mL alonzo2010 R4, R3; the solution chapter compares such plateaus with estimates and finds that the best estimate changes with the compound hsieh2012 R10; jackson2014 R5, R1, X1. |
| B F2 | D F20 | same mechanism | With 5 µg/mL HPMC or HPMCAS in the buffer, wetted amorphous celecoxib formed no crystals in the liquid but crystallized on its particles xie2015 R9, R10, R7; a dissolved polymer holds a crystal-free solution but not one that contains crystals alonzo2012 R18; ilevbare2012b R5, R17. |
| B F3 | D F6 | extends | Dissolved PVP, HPMC and HPMCAS lengthened the life of γ nifedipine to about 20, 60 and 110 min raina2014b R9, R10, an effect on conversion beside the separate effects of polymers on nucleation and growth alonzo2012 R5, R16, R17. |
| B F3 | D F21 | conditions differ | Neat nifedipine glass crystallized as γ within minutes in buffer raina2014b R6, R8, and nifedipine was the fastest of six dihydropyridines precipitated from a solvent shift (Bragg peaks at 0.25 h) raina2015b R6, R7, R8. |
| B F4 | D F7 | same mechanism | The best polymer for sustaining supersaturation changed with the drug konno2008a R7; xie2015 R1; duong2022a R4, as the best growth inhibitor did: 12.6 (ritonavir), 10.2 (celecoxib) and about 4.9 (efavirenz) with different polymers ilevbare2013b R9. |
| B F4 | D F8 | explains | Cellulosic polymers held felodipine, danazol, celecoxib and praziquantel far longer than PVP or PVPVA konno2008a R7; jackson2015 R5; xie2015 R1; polyzois2024 R3; the solution chapter explains growth inhibition by moderate hydrophobicity relative to the drug, ionized carboxyls and a semirigid chain, with flexible synthetic chains mostly failing ilevbare2012c R10, R11; ilevbare2013b R9. |
| B F4 | D F13 | same mechanism | 5 µg/mL PVP left the ritonavir induction time at 120.0 against 119.3 min ilevbare2013d R12, and flexible synthetic polymers did not work for ritonavir and efavirenz even when matched in solubility parameter ilevbare2013c R13, R9. |
| B F4 | D F15 | same mechanism | Danazol dispersions began to crystallize after about 56–70 (PVP), 188–200 (HPMC) and 284–319 min (HPMCAS) jackson2015 R5, the order of the antisolvent induction times with the same polymers jackson2014 R17; jackson2016 R17. |
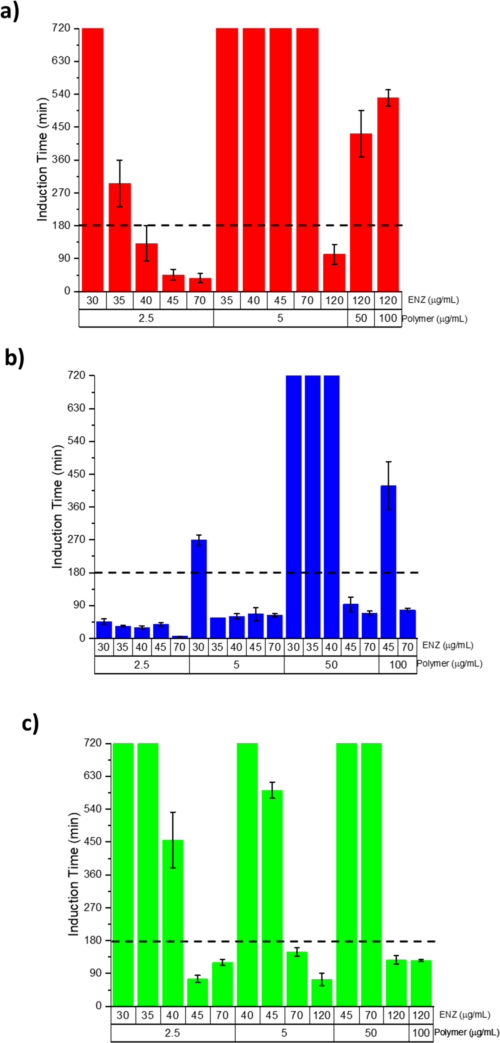
| B F5 | C F1 | conditions differ | The felodipine solvent shift to a nominal 50 µg/mL read about 6 µg/mL at 5 min konno2008a R12, a solution far above the onset at which supersaturated solutions split into a drug-rich phase ilevbare2013a C2, R8; the drop was read as crystal growth, not as phase separation (synthesis). |
| B F5 | D F5 | builds on | The 2008 growth reading of felodipine rested on initial slopes and equal crystal surface areas konno2008a R16, C28; the seeded slope and the unseeded induction time later measured growth and nucleation separately, with assumptions checked only in part ilevbare2012a R7, R9; ilevbare2013b R5. |
| B F5 | D F6 | contradicts | Konno and co-workers concluded that the cellulose polymers "appeared to reduce" growth and did not prevent nucleation konno2008a C28, C36, C25; with seeded and unseeded runs separated, 1 µg/mL HPMC slowed felodipine growth only 1.6-fold but nucleation about 1,400-fold alonzo2012 R5, R16, R17. |
| B F5 | D F9 | same mechanism | HPMCAS slowed growth on celecoxib seeds about 70-fold but nucleation about 4000-fold xie2016a R12, R13, and growth inhibition weakens as supersaturation rises, to 1.6-fold for ritonavir at its amorphous solubility ilevbare2012b R5. |
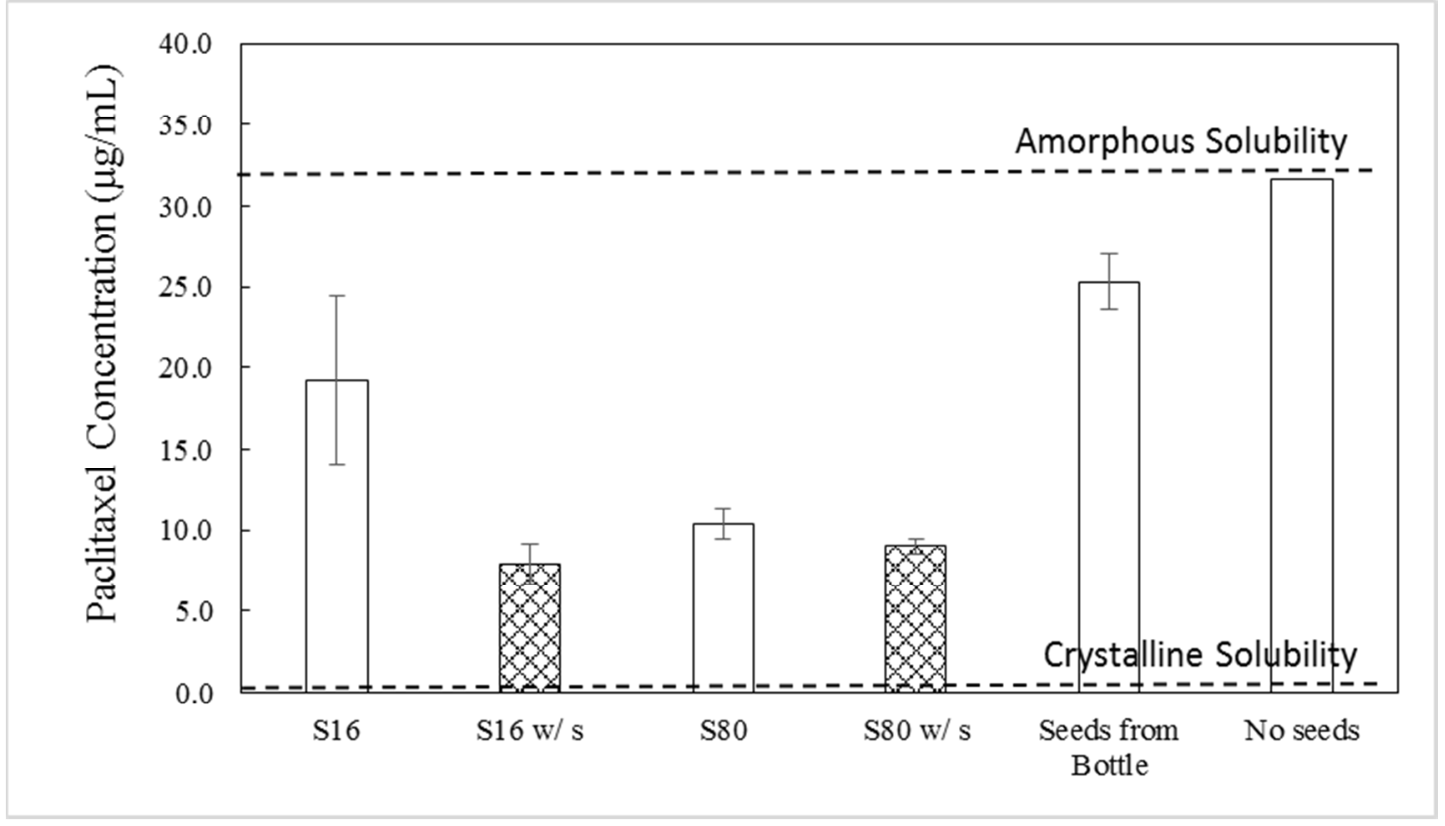
| B F5 | D F20 | same mechanism | HPMCAS held unseeded paclitaxel at S ≈88 for more than 16 h but was "unable to completely block crystal growth" on seeds que2018 R3, R14, C30; for felodipine an unseeded HPMC solution held its level while a seeded one fell from about 5.1 to 2.2 µg/mL within 58 min alonzo2012 R18. |
| B F6 | D F13 | builds on | The celecoxib dispersion study used the induction-time screen, which it called "quite predictive" xie2015 C48; in that screen the best polymer lengthened the celecoxib time from 2.4 to about 12.6 min at its amorphous solubility ilevbare2013c R9, R12. |
| B F6 | D F15 | builds on | The danazol dispersion order PVP < HPMC < HPMCAS matched antisolvent induction times of about 111, 173 and 365 min jackson2015 R5, the polymer series of the solution chapter jackson2016 R17, C46. |
| B F6 | D F35 | same mechanism | Solution tests ranked polymers as dispersion dissolution did but the absolute times differed (danazol PVP dispersions crystallized after about 56–70 min, half the antisolvent value) jackson2015 R5, X8, as induction times of one drug differ up to about sixfold between protocols mosqueragiraldo2018a R1.b; enright2020 R2. |
| B F7 | C F5 | builds on | The ceilings of dissolving dispersions were set against amorphous solubilities that the LLPS chapter measured or calculated, for felodipine a predicted advantage of about 9 alonzo2011 M1, R14 and for tacrolimus 46–50 µg/mL by four methods trasi2016 R4, R15, the agreement of onset and calculation of that chapter ilevbare2013a R8, C6. |
| B F7 | C F6 | builds on | Receiver slopes of felodipine dispersions were 8.5–10.5 times those of the crystal against a predicted amorphous advantage of about 9 alonzo2011 R14, M1, the ratio that the amorphous-solubility chapter measured from about 2 to about 600 across drugs almeidaesousa2015 R5, C23. |
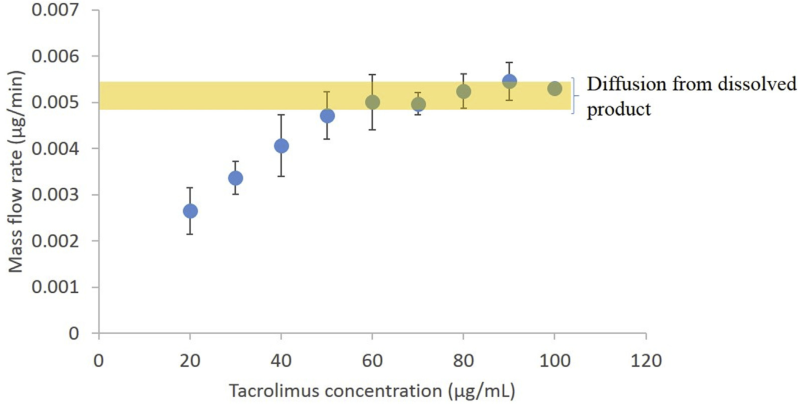
| B F7 | C F8 | same mechanism | Flux, NMR and ultracentrifugation put the free drug from dissolving felodipine, danazol, ritonavir, lopinavir and tacrolimus dispersions at about the amorphous solubility alonzo2011 R14, M1; jackson2015 R9, R2, M1; trasi2016 R10, R4, R15, R14, the cap that solvent-shift solutions showed as a plateau of free drug and flux mosqueragiraldo2015 R10, R12; trasi2015a R2, R1. |
| B F7 | C F13 | extends | Six marketed tacrolimus capsules all levelled at ≈46–50 µg/mL, the amorphous solubility measured four ways trasi2016 R10, R4, R15, R14; the earlier tests reached the same limit from films, a ritonavir–PVP dispersion and salts indulkar2015 R18, F6; ilevbare2013a R17, R8, R13; almeidaesousa2016 R12, R2. |
| B F7 | C F19 | conditions differ | Danazol dispersions with PVP and HPMC gave 7.1–7.3 µg/mL free drug against 8.7–9.1 µg/mL with HPMCAS and an amorphous solubility of 8 µg/mL jackson2015 R9, R2; polymers that enter the drug-rich phase lowered ibuprofen's amorphous solubility by up to about half ueda2020b R1; ueda2021 R5. |
| B F8 | C F4 | same mechanism | UV read ≈27 µg/mL for a 90:10 felodipine dispersion and ≈16.2 µg/mL for a danazol dispersion where flux gave about 8 µg/mL alonzo2011 R1, R14, R15; jackson2015 R2, R9; in solvent-shift solutions extinction cannot tell crystals from droplets and an in situ UV probe overread a drug-rich solution (19.1 against 11.4 µg/mL) almeidaesousa2015 C16; almeidaesousa2016 R12. |
| B F8 | C F15 | extends | NMR gave the dissolved felodipine of dispersions that UV overread alonzo2011 R14, and for low-Tg ibuprofen solution NMR separates dissolved drug from drug in the drug-rich phase in one tube (154 against 151 µg/mL calculated) ueda2021 R3, R5, R6. |
| B F9 | C F1 | same mechanism | A ritonavir–PVP dispersion added stepwise gave ≈350 nm droplets at 20 µg/mL and none at 10 µg/mL ilevbare2013d R1, the drug-rich phase that solvent-shift solutions form past a drug-specific concentration ilevbare2013a C2, R8; almeidaesousa2015 C41. |
| B F9 | C F2 | same mechanism | The phase isolated from a dissolving ritonavir dispersion had a Tg of about 1 °C ilevbare2013d R2, as the solvent-shift ritonavir phase had 0.4 °C, a supercooled liquid at 37 °C ilevbare2013a R5, C23. |
| B F9 | C F4 | builds on | Danazol dispersions were followed by the pyrene ratio and particle tracking jackson2015 R2, R5, R6, the probe and scattering methods whose onsets agree within a few µg/mL in the LLPS chapter ilevbare2013a R8, R4, R6. |
| B F9 | D F4 | same mechanism | Danazol dispersions lowered the pyrene ratio once the concentration passed about 6–10 µg/mL and held droplets of 246–284 nm jackson2015 R2, R5, R6, the drug-rich phase that danazol forms near 8 µg/mL from a solvent shift jackson2016 R8, R13. |
| B F10 | C F13 | conditions differ | A 50:50 HPMCAS danazol dispersion levelled at ≈6 µg/mL without a drug-rich phase and a 50% posaconazole–HPMCAS dispersion never reached the amorphous solubility jackson2015 C36, R2, R9; elkhabaz2019a R8, C44, whereas films, a 1:9 ritonavir–PVP dispersion and salts reached it indulkar2015 R18; ilevbare2013a R17; the limit is reached only when release is fast enough. |
| B F10 | C F14 | same mechanism | Release speed set by loading decided whether danazol, celecoxib and indomethacin dispersions reached the ceiling jackson2015 R2; xie2016a R4, R17; xie2017 R10, R13, R14, as the race between dissolution and crystallization decided it for the solid forms of CRH1 almeidaesousa2016 R8, R9. |
| B F10 | D F44 | same mechanism | At 50% drug HPMC and HPMCAS dispersions of danazol, celecoxib and indomethacin released slowly jackson2015 R2; xie2016a R4, R17; xie2017 R10, and for posaconazole the higher-acetyl HPMCAS grades released only about 5–31 µg/mL at pH 5.5–6.5 shah2025 R4, R5; the polymer that inhibits best can limit release. |
| B F11 | C F11 | builds on | In dissolving films and dispersions five of six mixed ritonavir and lopinavir values lay within 0.5 µg/mL of C_{max} = S_a\,x_d trasi2015b R5, E1, the ideal-mixing relation S_a(x_1) = S_a^\circ x_1 first fitted to solvent-shift mixtures trasi2015a R16, E4. |
| B F11 | C F19 | same mechanism | A second drug that mixes into the drug-rich phase lowered each drug's ceiling trasi2015b R5, R13, as dissolved polymers that enter the ibuprofen-rich phase lowered its amorphous solubility ueda2020b R1, C33. |
| B F12 | C F22 | same mechanism | HPMCAS and cellulose esters kept ritonavir droplets at about 200–350 nm and HPMCP and HPMCAS kept delamanid droplets at about 440 and 600 nm for 3 h ilevbare2013d R12, R14; duong2022a R7, R5, and HPMC kept most of the ibuprofen drug-rich phase dispersed for 3 h ueda2020b R15. |
| B F12 | D F13 | extends | At 20 µg/mL ritonavir, above the LLPS concentration, HPMCAS and four cellulose esters lengthened the induction time from 119.3 to 146.0–242.8 min ilevbare2013d R12, R14, the cellulose adipates that were the best nucleation inhibitors at the amorphous solubility (CAB Adp 0.81, about 244 min) ilevbare2013c R9, R12. |
| B F12 | D F15 | same mechanism | Charged additives kept ritonavir droplets small, read as charge repulsion between adsorbed polymers ilevbare2013d C37, C38, and anionic HPMC-AS made danazol droplets more negative (−8.1 to −13.7 mV) and kept them at about 230–345 nm jackson2014 R1, R22, R23. |
| B F12 | D F37 | extends | Additives that kept ritonavir droplets small did not all delay crystallization (Tween 80 and several ethers cut it to 23.6–59.5 min) ilevbare2013d R12, R14, and with enzalutamide the polymer that loaded the droplets most inhibited worst wilson2021 R7, R3. |
| B F13 | C F3 | extends | The drug-rich phase is a transient precursor of crystals ilevbare2013a R8, R11, R12; mosqueragiraldo2015 R1; in a dissolving ritonavir system crystallization appeared to start inside the droplets, which the authors read as droplets that "appear to promote" crystallization ilevbare2013d C39, C41. |
| B F13 | D F14 | same mechanism | The induction time of ritonavir fell from about 284 to 119.3 min across its LLPS concentration ilevbare2013d R16, R12, part of the general fall of induction time with supersaturation, for example danazol with HPMC-AS from 516 to 277 min between 10 and 20 µg/mL jackson2014 R17. |
| B F13 | D F37 | same mechanism | Ritonavir crystallized after about 120 min just above the LLPS concentration against about 284 min just below it ilevbare2013d R16, R12, and crossing enzalutamide's amorphous solubility cut the induction time with HPMCAS from about 129 to 43 min wilson2021 R3. |
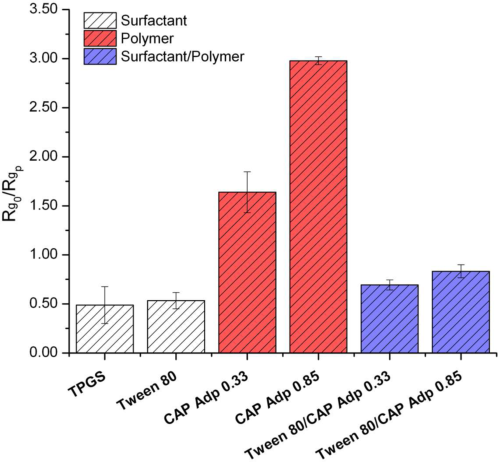
| B F14 | D F18 | same mechanism | Tween 80 and SDS cut the ritonavir induction time with droplets to 23.6 and 34.7 min ilevbare2013d R12, and below their CMC TPGS and Tween 80 doubled ritonavir crystal growth ilevbare2012a R17, R1.g, M17. |
| B F14 | D F28 | same mechanism | At S = 5 SDS and polysorbate 80 shortened the celecoxib induction time while STC held it beyond 960 min chen2015a R12, C6, the same split as 0.1% STC lengthening and SDS shortening the induction time of most of 11 drugs chen2015 R3, C17, C18. |
| B F14 | D F31 | builds on | STC at 0.75% held celecoxib beyond 960 min chen2015a R12; the bile salt delay is not a solubilization effect, since at matched concentration ratios and unchanged flux the induction times still rose chen2015 R1, R3; li2016a R13, R15. |
| B F14 | D F38 | same mechanism | SDS below its CMC still cut the celecoxib induction time to 29 min chen2015a R12, C6, and for atazanavir SDS shortened the induction time between about a seventh of its CMC and the CMC indulkar2019b R3, R1, R2, M2. |
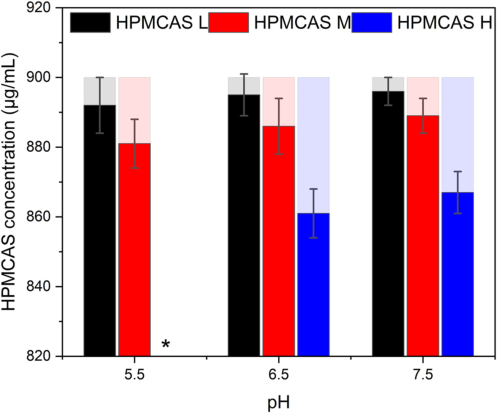
| B F15 | D F19 | builds on | The celecoxib supersaturation in SDS assumes that about 860 µg/mL dissolved HPMCAS leaves the crystalline solubility unchanged chen2015a R18, X9, whereas 1 mg/mL polymers raised the crystalline solubility of papaverine from 12.2 to 19.0–21.9 µg/mL and of warfarin from 3.7 to as much as 10.7 µg/mL hsieh2014 R4. |
| B F15 | D F44 | same mechanism | At pH 5 with SDS, HPMCAS-LF dissolved from lopinavir dispersions to about 290–330 µg/mL and HPMCAS-HF to about 120 µg/mL, which the authors attribute to a "small extent" of polymer ionization li2016b R13, R16, C24, C49; the low-succinoyl HPMCAS grades released posaconazole poorly at pH 5.5 shah2025 R4, R5; in both, partial ionization near pH 5 decides how much enteric polymer, and with it drug, is released (synthesis). |
| B F16 | C F14 | extends | Whether the wetted dispersion crystallizes depends on the dispersion polymer and its content, and an inhibitor in the medium did not prevent it wegiel2015 R9, R14; xie2016a R9, R10; for undispersed solid forms of CRH1 a dissolved polymer raised the maxima almeidaesousa2016 R9. |
| B F16 | D F20 | same mechanism | Crystals that formed in PAA particles kept celecoxib release at about half even when 5 µg/mL HPMCAS held the dissolved drug for 16 h xie2016a R9, R10, C31; µg/mL polymer levels do not hold a solution that already contains crystals alonzo2012 R18; ilevbare2012b R17. |
| B F17 | C F12 | same mechanism | EPO raised the crystalline solubility of indomethacin from 1.61 to 6.2 µg/mL and its amorphous solubility with HPMC from 36 to 41–56 µg/mL xie2017 R1, R3, as Tween 80 raised both ritonavir solubilities so that their ratio stayed near 14 ilevbare2013a R16. |
| B F17 | C F19 | conditions differ | Dissolved HPMCAS raised crystalline resveratrol about tenfold at 10 mg/mL wegiel2015 R2, R3, while at 300 µg/mL HPMC and PVP-VA left ibuprofen's crystalline solubility unchanged and lowered its amorphous solubility; only cationic EUD-E raised both ueda2020b R1. |
| B F17 | D F19 | same mechanism | Felodipine, celecoxib and lopinavir kept their crystalline solubility within about 1.4-fold at the polymer levels tested konno2008a R1; xie2015 R11; xie2016a R1; li2018 R1, whereas 1 mg/mL polymers raised papaverine from 12.2 to 19.0–21.9 µg/mL hsieh2014 R4; supersaturation has to be referred to the same medium. |
| B F18 | C F11 | extends | An undissolved polymer mixed with lopinavir lowered its maximum below the 17.4 µg/mL amorphous solubility, most at 15% drug (≈0.3–4.3 µg/mL) li2018 R3, R1, the mixing argument of a second component lowering the activity of the drug-rich phase trasi2015a R7, R16, E4. |
| B F18 | C F19 | same mechanism | HPMCP and EC films held lopinavir far below its amorphous solubility while a dissolving polymer (HPMC) did not li2018 R3, R8, R14; dissolved polymers that enter the ibuprofen-rich phase lowered its amorphous solubility by up to about half ueda2020b R1; ueda2021 R5. |
| B F18 | C F20 | same mechanism | The lowering of the lopinavir maximum rose as drug loading fell li2018 R3, as the lowering of dissolved ibuprofen rose with the polymer:drug ratio in its drug-rich phase ueda2021 R5, R11. |
| B F19 | C F12 | same mechanism | Surfactants raised leached lopinavir and its crystalline solubility together, so that C/Ceq stayed at ≈3.25–3.9 with HPMCAS-HF li2016b R19, R20, as a micellar solubilizer raised both ritonavir solubilities without raising the ratio ilevbare2013a R16, C54. |
| B F19 | C F16 | conditions differ | The constant lopinavir C/Ceq in micellar media is a concentration ratio li2016b R19, R20; for atazanavir in SDS the concentration ratio fell to about 33 while the flux-based activity ratio stayed at about 65 indulkar2017a R11, R13. |
| B F19 | D F19 | builds on | Leaching was judged against the crystalline solubility measured in the same surfactant medium li2016b R19, R20, the reference that the solution chapter requires because surfactants raised it up to about 266-fold chen2015 R1. |
| B F20 | D F13 | builds on | HPMCAS and HPMC were chosen as the minor inhibitor xie2015 R6, the polymer that was best for celecoxib in the induction-time screen (HPMC, 2.4 → about 12.6 min) ilevbare2013c R9, R12. |
| B F20 | D F17 | conditions differ | A minor cellulosic in PVP or PAA dispersions held released celecoxib for 16 h xie2015 R6; xie2016a R14, R17, a combination aimed at nucleation and release; the polymer pairs of the solution chapter acted on ritonavir growth, mostly at twice the total polymer ilevbare2012a R11, R12. |
| B F20 | D F44 | same mechanism | Adding HPMCAS or HPMC to a PVP dispersion removed desupersaturation but slowed release (≈6.7–12.4 against ≈16.1 µg/mL at 2 h) xie2015 R6, the same trade-off between inhibition and release that the HPMCAS grades showed for posaconazole shah2025 R3, R4, R5. |
| B F21 | C F10 | conditions differ | Indomethacin is a weak acid whose solubility rises on the shift from pH 2.2 to 5 or 6.8 xie2017 R10, R22, the mirror image of weak bases, whose total limit rises as pH falls indulkar2015 R18, F2 (synthesis). |
| B F21 | C F23 | same mechanism | Indomethacin nanodroplets formed in acid redissolved within about 2 min after the shift to pH 5, while crystals formed in acid recovered only to 32.1 of 40 µg/mL xie2017 R10, R20, R19, R23; for pazopanib the pH-shift outcome was likewise set by whether glassy colloids or crystals formed sugihara2018 R8, R20. |
| B F21 | D F1 | same mechanism | What separated in acid decided recovery after the pH rise xie2017 R19, R23, R25, as after a pH shift the form of the precipitate, crystalline or amorphous, matched the solution behaviour in all ten weak bases hsieh2012 R1, R5, R10. |
| B F22 | D F6 | same mechanism | HPMCAS held unseeded paclitaxel more than 16 h against 6 min without polymer but only slowed growth on seeds que2018 R3, R14, the decoupling of nucleation and growth inhibition seen for felodipine with HPMC alonzo2012 R5, R16, R17. |
| B F22 | D F9 | same mechanism | At S ≈88 HPMCAS could not stop growth on paclitaxel seeds que2018 R3, R14, as growth inhibition by polymers weakened with supersaturation and ritonavir grew continuously above a critical supersaturation ilevbare2012b R5, R12, R13. |
| B F22 | D F10 | builds on | Que and co-workers explain continued growth on paclitaxel seeds by a two-dimensional nucleus (5.4–7.0 nm) smaller than the spacing of adsorbed polymer (≈10.5–16.8 nm) que2018 R15, R12, C38, the step-pinning picture fitted to felodipine and ritonavir growth alonzo2012 R7, R8, R13; ilevbare2012b R16. |
| B F22 | D F20 | builds on | HPMCAS held unseeded paclitaxel for 16 h but seeds lowered it to 7.9–25.3 µg/mL que2018 R3, R13, R14, the contrast between unseeded and seeded solutions first shown for felodipine and ritonavir alonzo2012 R18; ilevbare2012b R5, R17. |
| B F22 | D F24 | builds on | Seeds grown at S 16 and S 80 with the same end area left different residual levels que2018 R6, R18, R14, after the felodipine finding that the seed route changed HPMCAS growth inhibition from 2.7- to 12-fold schram2016 R2. |
| B F23 | C F7 | conditions differ | For delamanid the Hoffman estimate of the amorphous-to-crystalline ratio (31.8) lay below the measured 42.3 duong2022a R27, C43, whereas for high-melting drugs the Hoffman free energy overshot the onset (telaprevir 245 against 90–92 µg/mL) mosqueragiraldo2015 R13; almeidaesousa2015 R14, R15. |
| B F24 | D F11 | builds on | In acid, where enteric polymers stay undissolved, wetted posaconazole and delamanid dispersions crystallized elkhabaz2019a R16, R20; nguyen2023c R19, R20, and in solution carboxylated cellulose esters lost most of their inhibition at pH 3–3.8 ilevbare2012b R7, R9; mosqueragiraldo2016 R7. |
| B F24 | D F23 | builds on | Delamanid salt dispersions crystallized at their surfaces in acid, more with HPMCAS grades nguyen2023c R19, R20, where adsorbed HPMCAS sits on crystals as separate globules at pH 3 and slows growth about 1.8-fold less than at pH 6.8 schram2015 R4, R7, R10. |
| B F24 | D F44 | same mechanism | Undissolved HPMCAS in gastric media left the wetted drug to crystallize elkhabaz2019a R16, R20, and as pH fell toward 5.5 HPMCAS released posaconazole poorly while every grade inhibited nucleation longer shah2025 R3, R4, R5. |
| B F25 | C F10 | builds on | The gastric supersaturation ratio of delamanid dispersions rose from ≈0.9–3.8 at pH 1.6 to ≈11–42 at pH 5.0 nguyen2023c R13, because for a weak base the solubility rises with ionization at low pH indulkar2015 R18, F2 (synthesis). |
| B F25 | C F23 | extends | Final release of delamanid salt dispersions after a gastric stage ranged from about 0 to 101% with gastric pH and grade nguyen2023c R11, whereas for pazopanib the dose relative to the intestinal amorphous solubility decided the outcome sugihara2018 R8, R20; with an undissolved enteric polymer the gastric stage itself changes the solid. |
| B F25 | D F44 | same mechanism | After pH 5.0 the HPMCAS-MF and -HF delamanid dispersions released only ≈12.5 and 0% nguyen2023c R11, and the high-acetyl HPMCAS grades released posaconazole poorly at pH 5.5–6.5 shah2025 R4, R5. |
| B F26 | C F8 | builds on | A posaconazole dispersion dosed at ten times its amorphous solubility held ≈22–24 µg/mL, about that solubility elkhabaz2019a R6, R12, R2, the cap above which extra drug only adds drug-rich phase mosqueragiraldo2015 R10, R12; trasi2015a R2. |
| B F26 | C F13 | extends | Both doses of the posaconazole dispersion reached the amorphous solubility, but the lower one lost it about an hour sooner elkhabaz2019a R6, R12, so reaching the limit (C F13) indulkar2015 R18; ilevbare2013a R17 is not the same as holding it once crystals are present. |
| B F26 | D F20 | same mechanism | Crystals from the acid stage were present at transfer elkhabaz2019a R16, and seeds remove the protection that µg/mL polymer gives a crystal-free solution alonzo2012 R18; duong2022b R13, M2. |
| B F27 | D F11 | builds on | An enteric coat kept gastric medium from the delamanid–HPMCP tablet and prevented the surface crystals of uncoated films at pH 3.0 nguyen2023b R10, R6, where carboxylated polymers lose most of their inhibition ilevbare2012b R7; mosqueragiraldo2016 R7. |
| B F28 | C F16 | builds on | Delamanid dispersions released the same in FaSSIF as in buffer although the amorphous solubility was ten times higher (7.93 against 0.76 µg/mL) duong2022a R13, R1; in micellar media the concentration ratio understates the supersaturation and the activity at the amorphous solubility is unchanged indulkar2017a R11, R13; elkhabaz2019b R8, R9, C21. |
| B F28 | D F39 | same mechanism | The authors attribute the loss of praziquantel release in FeSSIF-V2 to its higher bile salt and lecithin content, which "promoted crystallization" alvarenga2025 C29, R16, R18; in solution lecithin and its digestion products shortened induction times in bile salt media indulkar2018 R16, R19; enright2020 R6, R10. |
| B F28 | D F42 | conditions differ | Fasted intestinal fluid changed praziquantel release little alvarenga2025 R12, and in pooled human fasted fluid atazanavir and posaconazole nucleated later than in simulated fluids elkhabaz2021 R6, R7. |
| B F28 | D F43 | conditions differ | With HPMCAS or HPMC in the dispersion, FeSSIF-V2 still lowered praziquantel release to about 34–52% at 1.5 mg/mL alvarenga2025 R16, R18, whereas 150 µg/mL HPMCAS-MF made buffer, FaSSIF and two lecithin media alike for telaprevir lu2018 R7, R9. |
| B F29 | D F13 | conditions differ | HPMCAS-MF and HPMC E5 LV held racemic praziquantel beyond 83 min but R-praziquantel only 37 and 15.5 min polyzois2024 R2, R3, R4; in the solution screen the effective polymer also changed between drugs ilevbare2013c R13, R9. |
| A F1 | C F4 | builds on | The presaturated-medium test dissolves compacts into medium already at the amorphous solubility, 110 µg/mL for nifedipine indulkar2017b R8, R9, R1, a value set by the onset methods compared in the LLPS chapter ilevbare2013a R8, R4, R6; mosqueragiraldo2015 R13. |
| A F1 | B F8 | extends | The concentration of drug in the medium cannot tell the release regime indulkar2019a R12, R13; indulkar2017b R8, R9, R1, and in situ UV overreads it once submicron particles form alonzo2011 R1, R14; jackson2015 R2, R9; both chapters move to read-outs that the colloid does not distort, the polymer assay and constant area in one, flux, NMR and ultracentrifugation in the other. |
| A F2 | B F9 | explains | Congruent release delivers the drug at the polymer rate, about 4 times amorphous itraconazole and 71 times the crystal for 10% ITZ–PVPVA bhardwaj2018 R4, R6, so the drug passes its amorphous solubility within minutes and the excess forms the colloid seen with ritonavir and danazol dispersions ilevbare2013d R1; jackson2015 R2, R5, R6. |
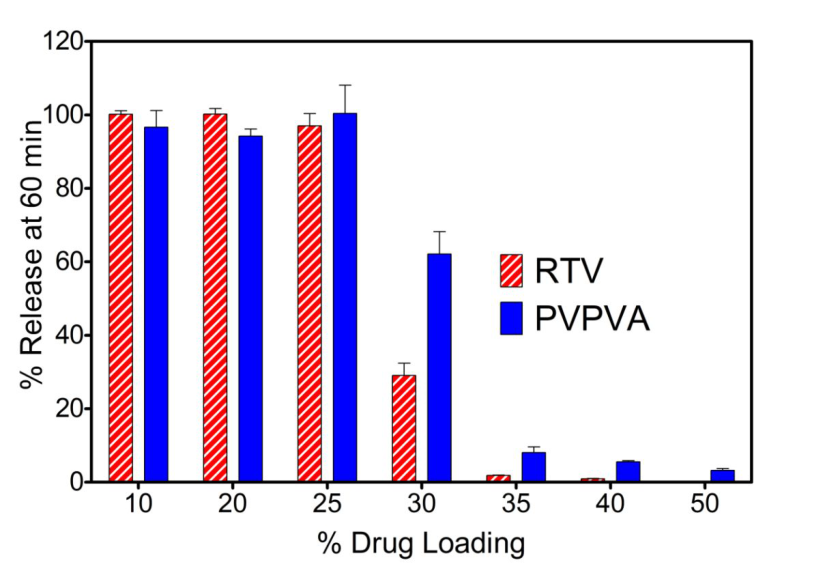
| A F2 | B F10 | explains | Low-loading dispersions release drug and polymer together at about the polymer's pace (ritonavir–PVPVA 97–100% in 60 min at 10–25%) indulkar2019a R11, R3, R1, which explains why 10% drug dispersions released within minutes and overshot into a colloid alonzo2011 R4, R2, R1. |
| A F3 | C F13 | conditions differ | From 50:50 ritonavir films PVP or PVPVA dissolved while ritonavir reached only ≈18 and ≈9 µg/mL, below its amorphous solubility of about 27 µg/mL purohit2017b R15, R16, R10, R1, whereas neat amorphous films of three weak bases reached 69–110% of the limit indulkar2015 R18, F6. |
| A F3 | B F7 | same mechanism | Drug-controlled release stops in medium already at the amorphous solubility and does not pass it indulkar2019a R12; purohit2017b R15, R16, R10, R1, and dispersions that dissolve past it do not raise the free drug above it alonzo2011 R14; jackson2015 R9; trasi2016 R10; from either regime the free drug cannot exceed the amorphous solubility. |
| A F3 | B F10 | explains | Above the switch the polymer leaves first and the drug dissolves near the neat amorphous rate bhardwaj2018 R4, R11; indulkar2019a R3, R7, which explains the slow release of 50% drug HPMC and PVP dispersions of felodipine and danazol in the supersaturation chapter alonzo2011 R4; jackson2015 C36, R2 (synthesis). |
| A F4 | C F1 | builds on | The droplets released by congruent dispersions are the drug-rich phase that supersaturated solutions form past a drug-specific concentration ilevbare2013a C2, R8; almeidaesousa2015 C41; ritonavir films that formed droplets lowered the pyrene I/III ratio to 1.50–1.66 purohit2017b R10, R11, R7. |
| A F4 | C F8 | builds on | Nanodroplets formed exactly where the free drug reached the amorphous solubility (27–30 µg/mL for ritonavir) purohit2017b R10, R11, R7, the concentration beyond which free drug, activity and flux stop rising trasi2015a R2, R1; ilevbare2013a R17, R8. |
| A F4 | B F8 | builds on | The link of nanodroplets to congruent release rests on free drug, a probe and particle counting purohit2017b R10, R11, R7; saboo2019 R10, R11, R12, because total concentrations overread above the limit alonzo2011 R1, R14; trasi2015b R6, R7. |
| A F4 | B F9 | builds on | The nanodroplets of 190–370 nm formed only where release stayed polymer-controlled purohit2017b R10, R11, R7; indulkar2019a R9, R20; saboo2019 R10, R11, R12, the colloid that fast-releasing ritonavir and danazol dispersions formed at the LLPS concentration ilevbare2013d R1, R2; jackson2015 R2, R5, R6. |
| A F5 | C F1 | builds on | The deuterium label in the medium was diluted as full mixing predicts indulkar2017b R11, P8, X2, so the droplets formed from dissolved drug by the phase separation of supersaturated solution ilevbare2013a C2, R8. |
| A F5 | C F2 | builds on | The isotope test relied on slow exchange between glassy droplets and solution at 5 °C indulkar2017b R3, R4, X5, a glassy state that follows the water-plasticized Tg of the drug-rich phase against the test temperature ilevbare2013a R5, C23; indulkar2015 R22, M1, M2. |
| A F5 | C F9 | builds on | The isotope test was run at 5 °C indulkar2017b R11, P8, where the limit itself depends on temperature (ritonavir: about 58 µg/mL at 10 °C against about 37 near 35 °C) ilevbare2013a R14, R15. |
| A F5 | B F9 | explains | Droplets of dissolving ritonavir–PVPVA compacts formed at the gel–solution interface and passed into the solution with the polymer yang2022a R6, R10, C50, one origin for the colloid that fast-releasing dispersions put into solution within minutes ilevbare2013d R1; jackson2015 R2, R5, R6. |
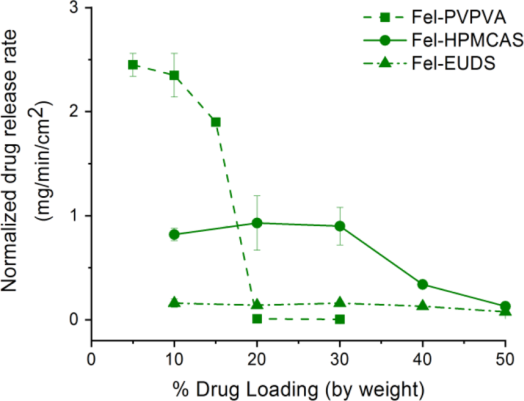
| A F6 | B F10 | explains | The limit of congruency is a narrow switch, ritonavir–PVPVA releasing ≈97% at 25% and at most ≈2% at 35–50% indulkar2019a R11, C2, C31; the loading series of the supersaturation chapter (danazol, celecoxib, indomethacin) show the same fall in release with loading jackson2015 C36, R2; xie2016a R4, R17; xie2017 R10, R13, R14. |
| A F7 | B F10 | explains | Above the limit the dissolving surface turned drug-rich within minutes (ledipasvir 17 → 54 wt% in 10 min) que2019 R15; saboo2019 R18, the authors' reading of a barrier; a 50:50 HPMC–felodipine particle kept its shape for at least 30 min while a 90:10 one dissipated within 5 min alonzo2011 R4, R2. |
| A F8 | C F1 | same mechanism | Water separated ritonavir, ledipasvir and felodipine films into drug-rich domains above the limit indulkar2019a R18; que2019 R14; saboo2020a R23, as supersaturated solutions split into a non-crystalline drug-rich phase ilevbare2013a C2, R8; both are separation of a drug-rich amorphous phase on water uptake (synthesis). |
| A F9 | C F2 | builds on | Que and co-workers note that under the test conditions ritonavir (wet Tg about 0 °C) is a supercooled liquid and ledipasvir a glass que2019 M1, R27, R28, C48, C49, the classification of drug-rich phases by water-plasticized Tg against the test temperature ilevbare2013a R5, C23; mosqueragiraldo2015 R2, M1. |
| A F9 | C F6 | conditions differ | The limit of congruency did not follow log P saboo2019 R7, C6, C35; que2021 C29, and the maximum supersaturation, amorphous over crystalline solubility, ranged from about 2 to about 600 without a single descriptor almeidaesousa2015 R5, C23. |
| A F11 | D F44 | same mechanism | The polymer choice is a "trade-off" between fast release at low loading and workable release at higher loading saboo2020a C55, and for posaconazole the HPMCAS grade is a trade-off between inhibition and release shah2025 R3, R4, R5. |
| A F11 | B F4 | conditions differ | HPMCAS and EUDS released felodipine congruently up to 50% but more slowly than PVP and PVPVA at 10% saboo2020a R15, R14; for holding supersaturation HPMCAS led for felodipine, danazol, celecoxib and praziquantel, while PVPVA held delamanid as long as HPMCAS konno2008a R7; jackson2015 R5; xie2015 R1; duong2022a R4. |
| A F11 | B F10 | same mechanism | HPMCAS dispersions of loratadine, miconazole and danazol declined gradually with loading instead of falling off a cliff yang2021 R7, R8, R9, R10, C2, and praziquantel–HPMCAS dispersions showed no release cliff up to 40% drug polyzois2024 R8, R9, C17. |
| A F13 | C F12 | conditions differ | The SDS gain in limit was not micellar, the medium staying below the CMC que2019 C51, X19, whereas the LLPS chapter's micellar solubilizer raised both solubilities without raising their ratio ilevbare2013a R16, C54. |
| A F13 | D F18 | conditions differ | At complete release the ledipasvir medium held at most about 0.05 mg/mL surfactant, below the CMC que2019 C51, X19, the range in which surfactants doubled ritonavir crystal growth and SDS shortened induction times ilevbare2012a R17; chen2015 R3. |
| A F13 | B F12 | same mechanism | The surfactant colloids from ledipasvir dispersions measured about 60 nm with SDS against ≈225–257 nm without que2019 R12, as surfactants kept ritonavir droplets at 178–395 nm ilevbare2013d R12, R14. |
| A F13 | B F14 | contradicts | Five parts SDS per 100 raised the ledipasvir–PVPVA limit of congruency from 5 to 30% que2019 R7, R8, R9, C12, while SDS promoted crystallization of celecoxib from HPMCAS particles and of ritonavir droplets chen2015a R14, R12; ilevbare2013d R12; the surfactant helps release and harms the supersaturation it creates. |
| A F14 | B F23 | conditions differ | At 20% ITZ–PVPVA the spray-dried compact released 113 and the extruded one 48.8 µg/min/cm² bhardwaj2018 R4, and spray-drying delamanid free base at 25% gave an amorphous dispersion that released more than 80% where rotary-evaporated ones held crystals nguyen2023c R5, R6; duong2022a R8; the route acts through the surface in one case and residual crystals in the other. |
| A F15 | B F10 | extends | The polymer rate that caps polymer-controlled release changed with the drug and additives, from about 0.22 of the neat rate to about twice it bhardwaj2018 R12; correasoto2022a R18, M1, C30, C48, which adds to the dependence of release speed on loading and polymer alonzo2011 R4; trasi2015b R14. |
| A F16 | C F22 | same mechanism | PVPVA droplets from elbasvir and loratadine dispersions grew while HPMCAS droplets stayed small yang2021 R3, R6, and in solvent-shift ibuprofen only HPMC and EUD-E kept most of the drug-rich phase dispersed for 3 h ueda2020b R15, R7. |
| A F16 | D F15 | same mechanism | Danazol droplets grew to about 2780 nm even with dissolved HPMCAS in release yang2021 R4, R5, X9, whereas in solution HPMC and HPMC-AS kept danazol droplets at about 230–345 nm for 2–4 h jackson2014 R22, R23. |
| A F16 | B F12 | same mechanism | HPMCAS kept elbasvir and loratadine droplets at about 250–570 nm where PVPVA let them grow to 1190–2120 nm yang2021 R3, R6, as HPMCAS and cellulose esters kept ritonavir droplets at 200–350 nm and PVP droplets grew from ≈360 to ≈5590 nm ilevbare2013d R12, R5. |
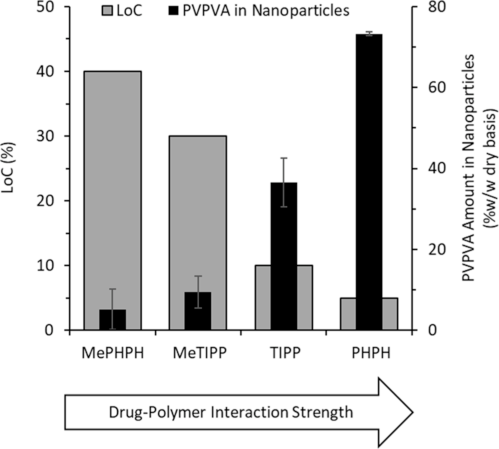
| A F17 | B F18 | same mechanism | Hydrogen-bonding drugs had lower limits in PVPVA and carried the polymer into their drug-rich phase saboo2020 R3; que2021 R7, R19; deac2023b R3, R8, and undissolved polymers that interact with lopinavir lowered its maximum concentration below the amorphous solubility, which the authors rationalize by "the extent and strength of drug-polymer interactions" li2018 R3, C68. |
| A F18 | C F2 | builds on | Cooling below the wet Tg of the drug-rich surface lowered the limit (indomethacin 10 → below 5%, loratadine 30 → 2%) saboo2020 R29, R30, C53; yang2021 R22, M1, the water-plasticized Tg against test temperature that decides whether a drug-rich phase is liquid or glassy ilevbare2013a R5, C23; indulkar2015 R22, M1, M2. |
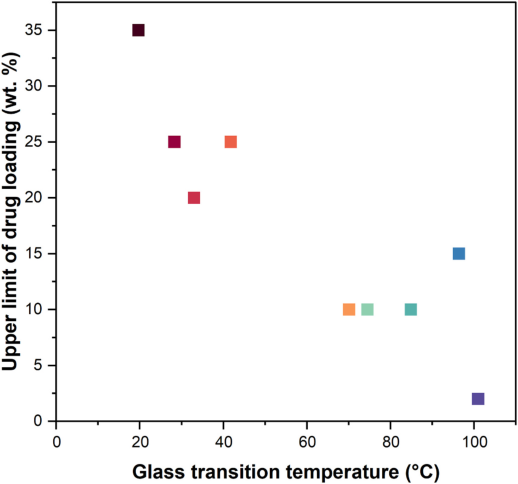
| A F18 | B F23 | contradicts | High-Tg drugs failed at 5–10% in PVPVA and heating restored atazanavir release yang2021 R7, R8, C25; correasoto2022b R6, R5, whereas for delamanid sulfonate salts that raised the Tg to 83.7–117.8 °C gave near-complete release at 25% with HPMCP duong2022a R20, R26; there the salt removed residual crystals of a fast crystallizer duong2022a C56, C67. |
| A F19 | D F18 | same mechanism | With 10 parts SDS, 30% ritonavir–PVPVA stopped near 70% with needle crystals on the surface by 15 min yang2023 R2, R16, R17, and below the CMC surfactants doubled ritonavir crystal growth ilevbare2012a R17 (synthesis: no crystallization rate was measured at the dissolving surface). |
| A F19 | B F1 | same mechanism | INDester crystallized on its dissolving surface and drug release levelled off while the polymer kept dissolving saboo2020 R8, R9, R22, the crystallization of the wetted solid that removes supersaturation of neat amorphous felodipine, nifedipine and celecoxib alonzo2010 R2; raina2014b R2, R6; xie2015 R4, R8. |
| A F19 | B F2 | same mechanism | 1000 µg/mL HPMC-606 in the medium did not prevent surface crystallization of INDester compacts saboo2020 R8, R1, M6, C36, C37, as dissolved polymer did not delay crystallization of wetted nifedipine or celecoxib raina2014b C11, R2; xie2015 R9, R10. |
| A F19 | B F16 | same mechanism | Crystals on the dissolving surface ended congruent release of INDester saboo2020 R9, R22, and crystallization in PAA and CAP particles left celecoxib and lopinavir dispersions incomplete xie2016a R9, R10; li2018 R7; in both the crystals form in the wetted solid, not in the medium. |
| A F20 | B F18 | conditions differ | In water-separated films a continuous drug-rich phase went with loss of release saboo2021 R21, R23; correasoto2022a R20, R21, whereas lopinavir films with CA and EUD, which showed two glass transitions, reached ≈12.8–17.0 µg/mL, closer to the amorphous solubility than one-phase films with HPMCAS, CAP, EC or HPMCP li2018 R3, R8. |
| A F21 | C F12 | conditions differ | 35 µg/mL TPGS dissolved in the medium did nothing for a 30% felodipine dispersion and the gain was not micellar solubilization saboo2021 R12, R15, whereas a micellar solubilizer in solution raises both solubilities together ilevbare2013a R16, C54. |
| A F21 | D F18 | conditions differ | Tween 80 and SDS raised ritonavir release at 30–40% yang2023 R2, C37, but at 5 µg/mL Tween 80 doubled ritonavir crystal growth and cancelled the cellulose esters ilevbare2012a R17. |
| A F21 | D F38 | conditions differ | SDS raised the clopidogrel limit from 40 to 50% and atazanavir release with SDS gave a limit of 10% correasoto2022a R17, R18; correasoto2022b R2, R4, and in solution SDS shortened the atazanavir induction time from about 0.075 mg/mL and cut the inhibition by PVPVA indulkar2019b R3, R4. |
| A F21 | B F14 | contradicts | A few percent of surfactant inside PVPVA dispersions raised the limit of four drugs saboo2021 R12; correasoto2022a R17; correasoto2022b R2, R4, while SDS and polysorbate 80 promoted crystallization of celecoxib and ritonavir chen2015a R14, R12; ilevbare2013d R12. |
| A F22 | B F23 | contradicts | Amorphous salts of lumefantrine raised its Tg to as much as 101 °C but lowered the loading with good release from 35% to 2–15% hiew2022b R2, R20, C53, whereas sulfonate salts of delamanid (Tg 83.7–117.8 °C) raised release at 25% from ≈20 to ≈95–97 µg/mL duong2022a R20, R26, C67; the delamanid free base, a fast crystallizer, had left crystals in its dispersions duong2022a R8, C56. |
| A F23 | D F44 | explains | The HPMCAS gel was 0.6–1.2 pH units more acidic than the medium and its dissolution rate rose with the gel pH bapat2023 R15, R16, which bears on the poor release of high-acetyl HPMCAS grades at pH 5.5–6.5 shah2025 R4, R5 (synthesis). |
| A F23 | B F15 | same mechanism | Buffer capacity and pH set how much enteric polymer dissolves (HP-50 about 0.92 against 0.14 mg/min/cm² in strong and weak phosphate) qi2022 R12, R2, as SDS raised the HPMCAS dissolved from suspended celecoxib particles about 250-fold at pH 3 chen2015a R18; in both the drug follows the polymer. |
| A F23 | B F25 | explains | At pH 5.0 neat HPMCAS-MF did not dissolve bapat2023 R5, R7, R8, and after a gastric stage at pH 5.0 the HPMCAS-MF and -HF delamanid dispersions released only ≈12.5 and 0% nguyen2023c R11. |
| A F23 | B F28 | conditions differ | FaSSIF matched its blank buffer for neat HPMCAS-MF and for a 10% indomethacin dispersion bapat2023 R5, R7, and fasted intestinal fluid changed praziquantel release little while FeSSIF-V2 lowered it alvarenga2025 R16, R18, R12. |
| A F24 | B F23 | conditions differ | Salt formation of the polymer (HP-50 neutralized with sodium or amines) raised miconazole release from about 8.6 to 84–90% qi2022 R14, R15, and salt formation of the drug (delamanid sulfonates formed in the dispersion) raised delamanid release at 25% duong2022a R20, R26; both are salt strategies, on different components. |
| A F25 | C F1 | same mechanism | In the gel of dissolving PVPVA compacts water separated discrete drug-rich droplets of 0.5–2 µm yang2022a R6, R10; deac2023a R6, R7, the phase that supersaturated solutions form past their limit ilevbare2013a C2, R8 (synthesis: in the gel it forms in a drug–polymer–water mixture rather than in dilute solution). |
| A F25 | C F2 | builds on | The drug-rich layer at 40% ritonavir was rigid and at 30% porous yang2022a R6, R10, R11, R12, R13; the drug-rich phase of ritonavir is a water-plasticized supercooled liquid at 37 °C ilevbare2013a R5, C23. |
| A F26 | C F2 | builds on | Lipophilic plasticizers raised the limit of the high-Tg drugs atazanavir and ledipasvir three- to fivefold but that of ritonavir only to 30% correasoto2023 R1, R11, R14, R16, the drug whose drug-rich phase is already a supercooled liquid at 37 °C ilevbare2013a R5, C23. |
| A F26 | B F23 | contradicts | Lowering the Tg of high-Tg drugs with plasticizers raised their limit of congruency correasoto2023 R1, R17, whereas raising the Tg of delamanid by salt formation raised its release duong2022a R20, R26; the two act through different failures, slow mobility at the surface against residual crystals (synthesis). |
| A F27 | C F19 | same mechanism | PVPVA lowered the amorphous solubility of phenolphthalein from 200 to 27.5 µg/mL by entering its drug-rich phase deac2023b R1, R3, as HPMC and PVP-VA lowered that of ibuprofen ueda2020b R1, C33. |
| A F27 | C F20 | extends | The PVPVA content of drug-rich nanoparticles ran from about 77 to 5 wt% across four phenolphthalein analogues in the reverse order of their limits of congruency deac2023b R3, R8, beside polymer:drug ratios of 0.40–1.14 in ibuprofen drug-rich phases ueda2021 R5. |
| A F27 | C F21 | builds on | The phenolphthalein partitioning was measured at 60 °C and by two routes deac2023b R3, R8, and polymer transfer into the ibuprofen-rich phase is endothermic and entropy-driven, so more polymer enters as temperature rises ueda2022 R10, R22, R23, C48. |
| A F28 | B F10 | extends | Grazoprevir–HPMCAS dispersions declined gradually with loading (about 102% at 5% to 27–30% at 50–75%) hiew2023 R8, C18, like other HPMCAS loading series xie2016a R4, R17; polyzois2024 R8, R9, and at high loading the surface drug content, not the bulk, separated good from poor release hiew2023 R14. |
| A F29 | C F22 | same mechanism | With short PVP chains clotrimazole droplets clustered into strands in the gel deac2024a R7, R10, and in solution the polymer type decided how long ibuprofen droplets stayed dispersed ueda2020b R15, R7. |
| A F29 | B F12 | same mechanism | Clotrimazole droplets grew at the same relative rate with PVP K12 or K29/32 in solution deac2024a R5, R10, and PVP droplets from dissolving ritonavir dispersions grew from ≈360 to ≈5590 nm in 120 min ilevbare2013d R5. |
| A F30 | C F19 | same mechanism | PVPVA made up 41.9–52.2 wt% of the phenolphthalein-rich phase in measured drug–PVPVA–water diagrams deac2024b R15, R17, the polymer uptake into a drug-rich phase that lowers the amorphous solubility of ibuprofen ueda2020b R1, R13. |
| A F30 | C F20 | extends | PC-SAFT diagrams put the critical point at about 33% loading for MePHPH and 3.7% for PHPH deac2024b R22, R23, R35; in solution the share of polymer in the drug-rich phase depended on its chemistry and amount ueda2021 R5, R10. |
| A F31 | D F38 | conditions differ | SDS raised the water needed to separate 30% ritonavir films from 14.0 to 24.5% and kept the 40% gel in one phase yang2023 R21, R13, while in solution SDS shortened the atazanavir induction time below its CMC indulkar2019b R3. |
| A F31 | B F14 | same mechanism | SDS in 30% ritonavir–PVPVA compacts brought needle crystals to the dissolving surface and release stopped at about 30 min yang2023 R16, C24, and SDS promoted crystallization of ritonavir droplets ilevbare2013d R12. |
| A F32 | C F10 | builds on | Lipophilic weak bases ionized at the gel pH complexed HPMCAS and released poorly bapat2024 R12, R5; kaur2025 R5, R13, ionization that also raises the total amorphous solubility of weak bases as pH falls indulkar2015 R18, F2. |
| A F32 | D F44 | conditions differ | Weak bases took up to 70–96% of HPMCAS out of solution at pH 6.0 bapat2024 R12; kaur2025 R5, and with posaconazole the HPMCAS grade that entered its droplets most (about 31 wt%) inhibited nucleation best shah2025 R17, R3. |
| A F33 | D F44 | same mechanism | For loratadine and cinnarizine the grade ranked release LF > MF > HF in the order of acid groups per gram bapat2025a R2, R3, M3, M4, M5, and for posaconazole the HF grade released only about 5 µg/mL at pH 5.5 while inhibiting nucleation longest shah2025 R3, R4, R5. |
| A F33 | B F25 | same mechanism | At pH 6.5 alone 25% delamanid salt dispersions released ≈88% (LF), ≈57.5% (MF) and ≈0% (HF) nguyen2023c R11, the grade order LF > MF > HF of loratadine and cinnarizine bapat2025a R2, R3. |
| A F34 | C F12 | conditions differ | The authors read the bedaquiline gain as drug binding to micelles in FaSSIF-V1, micellar solubilization and complex disruption not being separated kaur2025 C39, C49, C50, X13; in the LLPS chapter micelles raise both solubilities together ilevbare2013a R16, C54; lu2017b R1, R2. |
| A F34 | B F28 | conditions differ | FaSSIF-V1 and FeSSIF-V2 raised bedaquiline release from about 17–30% to 80–97% by suppressing complexation kaur2025 R13, R15, R17, R5, whereas delamanid dispersions released the same in FaSSIF as in buffer and fed fluid lowered praziquantel release duong2022a R13, R1; alvarenga2025 R16, R18. |
| A F35 | B F10 | extends | At 75% grazoprevir, wettable particles (FaSSIF contact angle 0–52°) released about 37–52% and poorly wettable ones 8–20% hiew2025 R15, R17, an added lever at loadings where HPMCAS dispersions release slowly xie2016a R4, R17; elkhabaz2019a R8, C44. |